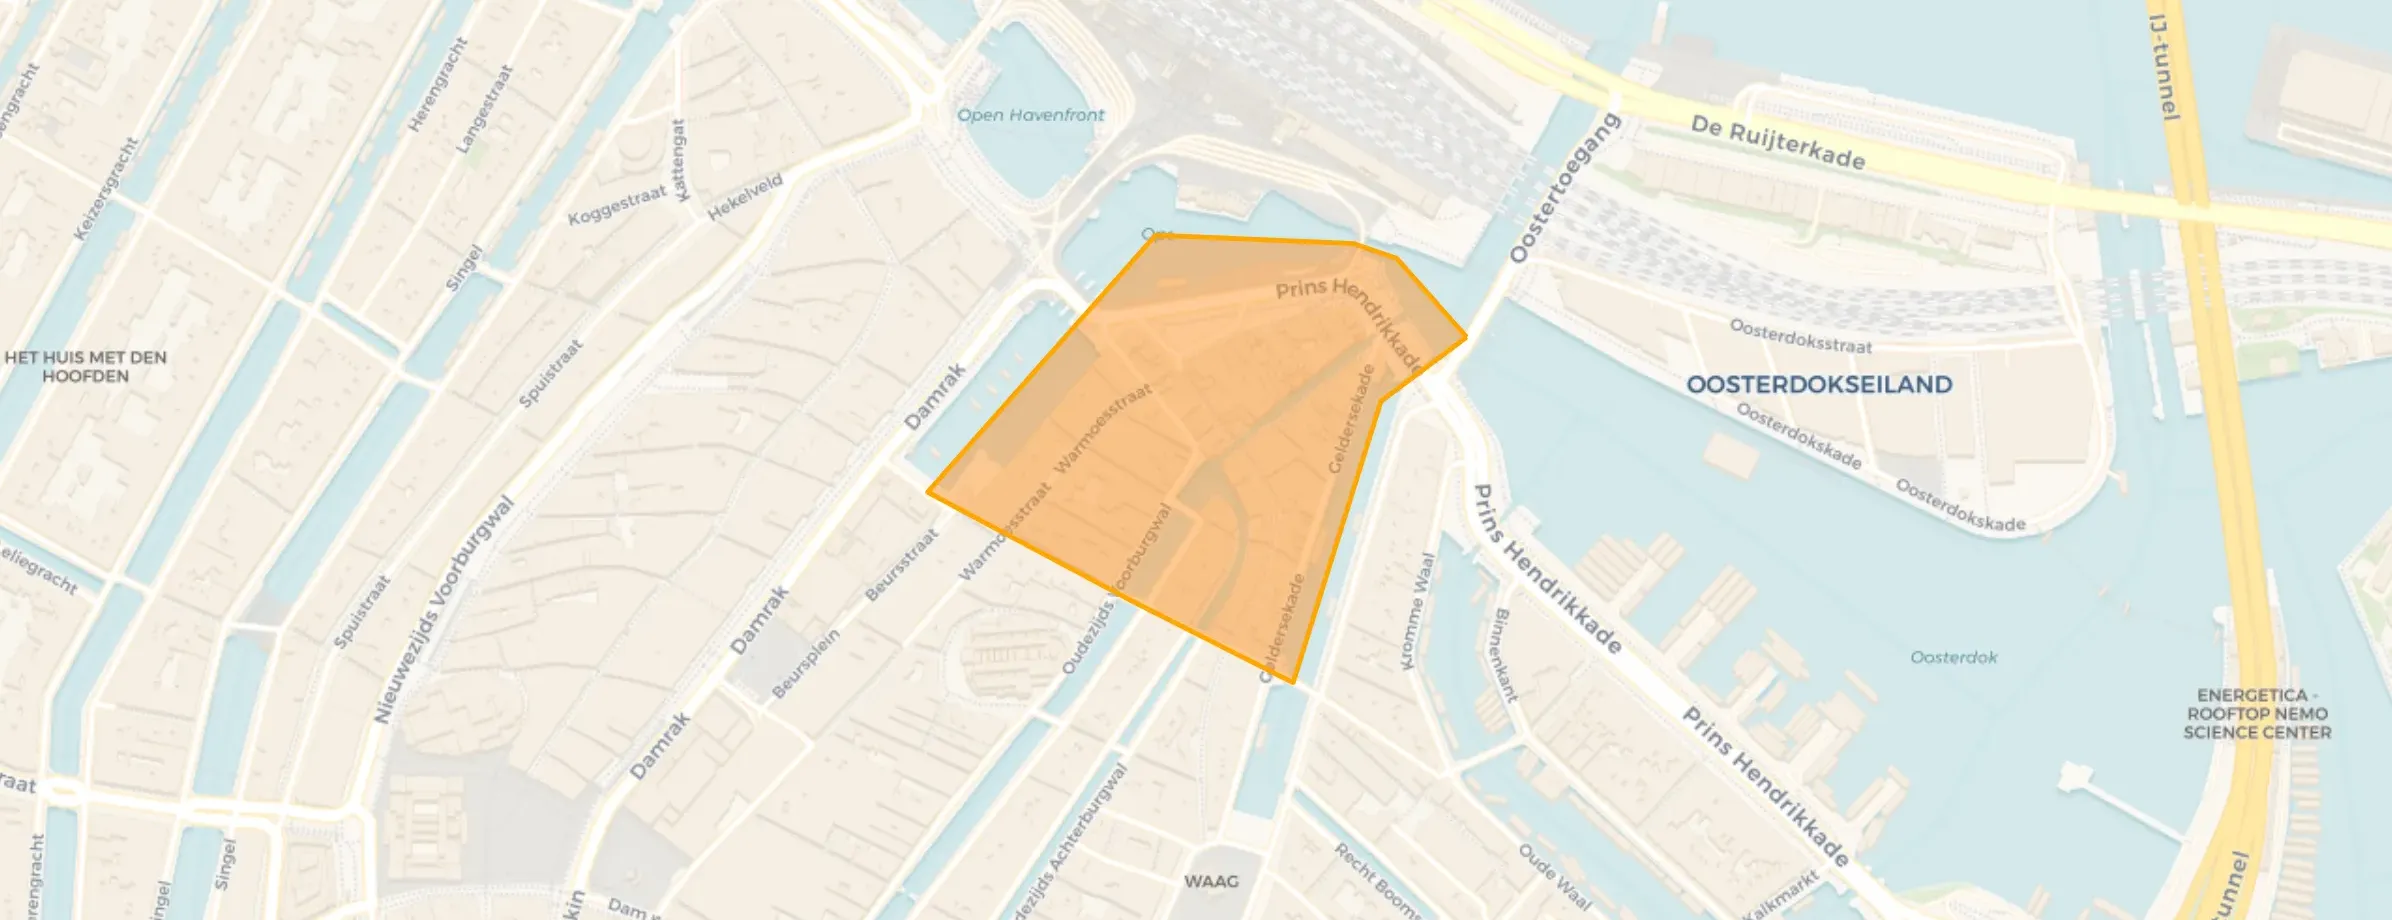
Neighbourhood in Amsterdam
Kop Zeedijk is located in the province of Noord-Holland, in the municipality of Amsterdam, in the district Burgwallen-Oude Zijde The neighbourhood has a total area of 8 hectares, of which 6 hectares are land and 2 hectares are water. The neighbourhood is coded as BU0363AE01. The postcode area is 1012AC-1012TM.
Two residents rate the neighbourhood as very good with a score of 8.2. They describe it as 'Generally very satisfied' and 'Unbearably noisy and unbelievably beautiful'. Based on a limited number of reviews, no clear trends are visible yet in this neighbourhood.
Kop Zeedijk has 1.185 residents. Of these, 56,5% are men and 43,0% are women. Most residents are 25 to 45 years (48,9%). The other age groups are 22,4% for '45 to 65 years', 15,6% for '15 to 25 years', 8,9% for '65 years or older' and 4,2% for '0 to 15 years'. Of the residents, 77,2% is unmarried, 14,3% is married, 7,2% is divorced and 1,3% is widowed. 490 residents originate from the Netherlands, 330 come from Europe and 365 come from countries outside Europe.
There are 830 households in Kop Zeedijk. 69,9% of these are single-person households, 24,1% households without children and 6,0% households with children. The average household size is 1,4 persons.
In Kop Zeedijk there are 1.000 income recipients. The average income per income recipient is €42.200, which is €6.400 (18%) higher than the national average of €35.800. Per resident, the average income is €38.900, which is €9.700 (33%) higher than the national average of €29.200. Most residents of Kop Zeedijk are highly educated. 61,1% have a university or higher professional education (HBO/WO), 34,3% have an intermediate education (HAVO, VWO or MBO 2-4) and 4,6% have a lower education (VMBO or MBO 1).
Of the 1.185 residents, around 70% are in paid employment, which amounts to 830 people. This is 5% higher than the national average of 65%. The majority of workers are in salaried employment (74%), while 26% are self-employed. In Kop Zeedijk, 12% of residents receive a benefit. The largest group is those receiving a state pension (AOW). 80 people receive this benefit.
In Kop Zeedijk there are 772 homes with an average assessed value (WOZ) of €492.000. Of these, around 85% are occupied and 15% unoccupied. Most homes are rental properties. This amounts to 80% rental homes and 20% owner-occupied homes. Of the homes, 20% privately owned, 7% owned by housing associations, 72% owned by other landlords and 1% of unknown ownership. The most common construction periods in Kop Zeedijk are 1700-1900 (49%) and Before 1700 (14%).
There are currently 11 homes for sale in Kop Zeedijk. The most recently listed home is Prins Hendrikkade 78H by Samuel Real Estate. Over the past year, 16 homes were sold in Kop Zeedijk. On average, a home was sold within 38 days.
The average asking price for a home for sale in Kop Zeedijk over the past year was €799.438. This is 62% higher than the average assessed value (WOZ) of €492.000. The average asking price per m² of plot is €572.
There are 6 homes for rent in Kop Zeedijk. The most recent home is Warmoesstraat 46B, offered by MA Residences. Over the past year, 53 homes were let in Kop Zeedijk. On average, a listing was let within 13 days.
The average rent for a rental home in Kop Zeedijk over the past year was €2.722 per month. Per m² of plot area that is €41 per month.
In Kop Zeedijk there are 837 addresses with a registered energy label. The most common labels are G (34%), B (16%) and C (14%). On average, an address in Kop Zeedijk uses 1.880 kWh of electricity per year. This is 33% below the national average of 2.810 kWh. With an annual consumption of 820 m³ per address, natural gas consumption is 36% below the national average of 1.280 m³.
I am generally very happy with my neighbourhood, all amenities are nearby, I have been living here very comfortably for years. The downside is that there is often a lot of rubbish on the streets.
Auto-translated to English by AILet's start with the most unpleasant aspect: in the evenings, it is unbearably noisy here. When you open the window in the living room during the summer evenings to let in some cool air, it is almost impossible to hear your interlocutor due to the street noise. Even in the bedroom, which overlooks the courtyard, you can hear the sounds of the street, including the crazy cries of tourists that can be heard until 5 a.m. In old buildings, it is forbidden to install new windows, and the old windows let in noise. Additionally, it often gets very, very dirty here, with mountains of garbage, especially in the mornings before the garbage truck has had time to pass. Apart from that, I really love this area. It's so beautiful here, and two of my favorite coffee shops in town are the Priesthood and the Old Church cafe. The proximity to the central station is very convenient, making it easy to travel. The most beautiful views of the city are always just around the corner.
Auto-translated to English by AI
The most common type is flats (92%).
Over the past year a home for sale in Kop Zeedijk was listed for an average of €687,500 (€8,614 per m²).
A rental home in Kop Zeedijk cost an average of €2,765 per month (€32 per m²).
Buurt Kop Zeedijk has 1,185 residents. The largest age group is 25 to 45 years (49%). Notably, 70% of the households are single-person households.
The housing supply in Kop Zeedijk is remarkably efficient: 62% has an A, A+ or B label. The average natural gas consumption per household is 820 m³ per year.
From Kop Zeedijk you can on average reach a supermarket at 0.3 km, a GP at 0.6 km, a railway station at 0.8 km, a primary school at 0.8 km (as the crow flies, source: CBS).
Right now you will find 16 homes for sale and 4 homes for rent in Kop Zeedijk.

Buurtje.nl uses cookies to make the site work and to improve it. In doing so, we process data such as your IP address and the pages you visit.
We use this data for three purposes: running the website (functional), measuring visits so we can improve Buurtje.nl (analytics), and — if you allow it — tailoring ads to your interests (marketing).
How we handle your data is described in our privacy policy. You can change your preferences at any time via 'Cookie preferences' at the bottom of every page.
Choose per category which cookies we may place. Read more in our privacy policy.