Neighbourhood in Hilversum
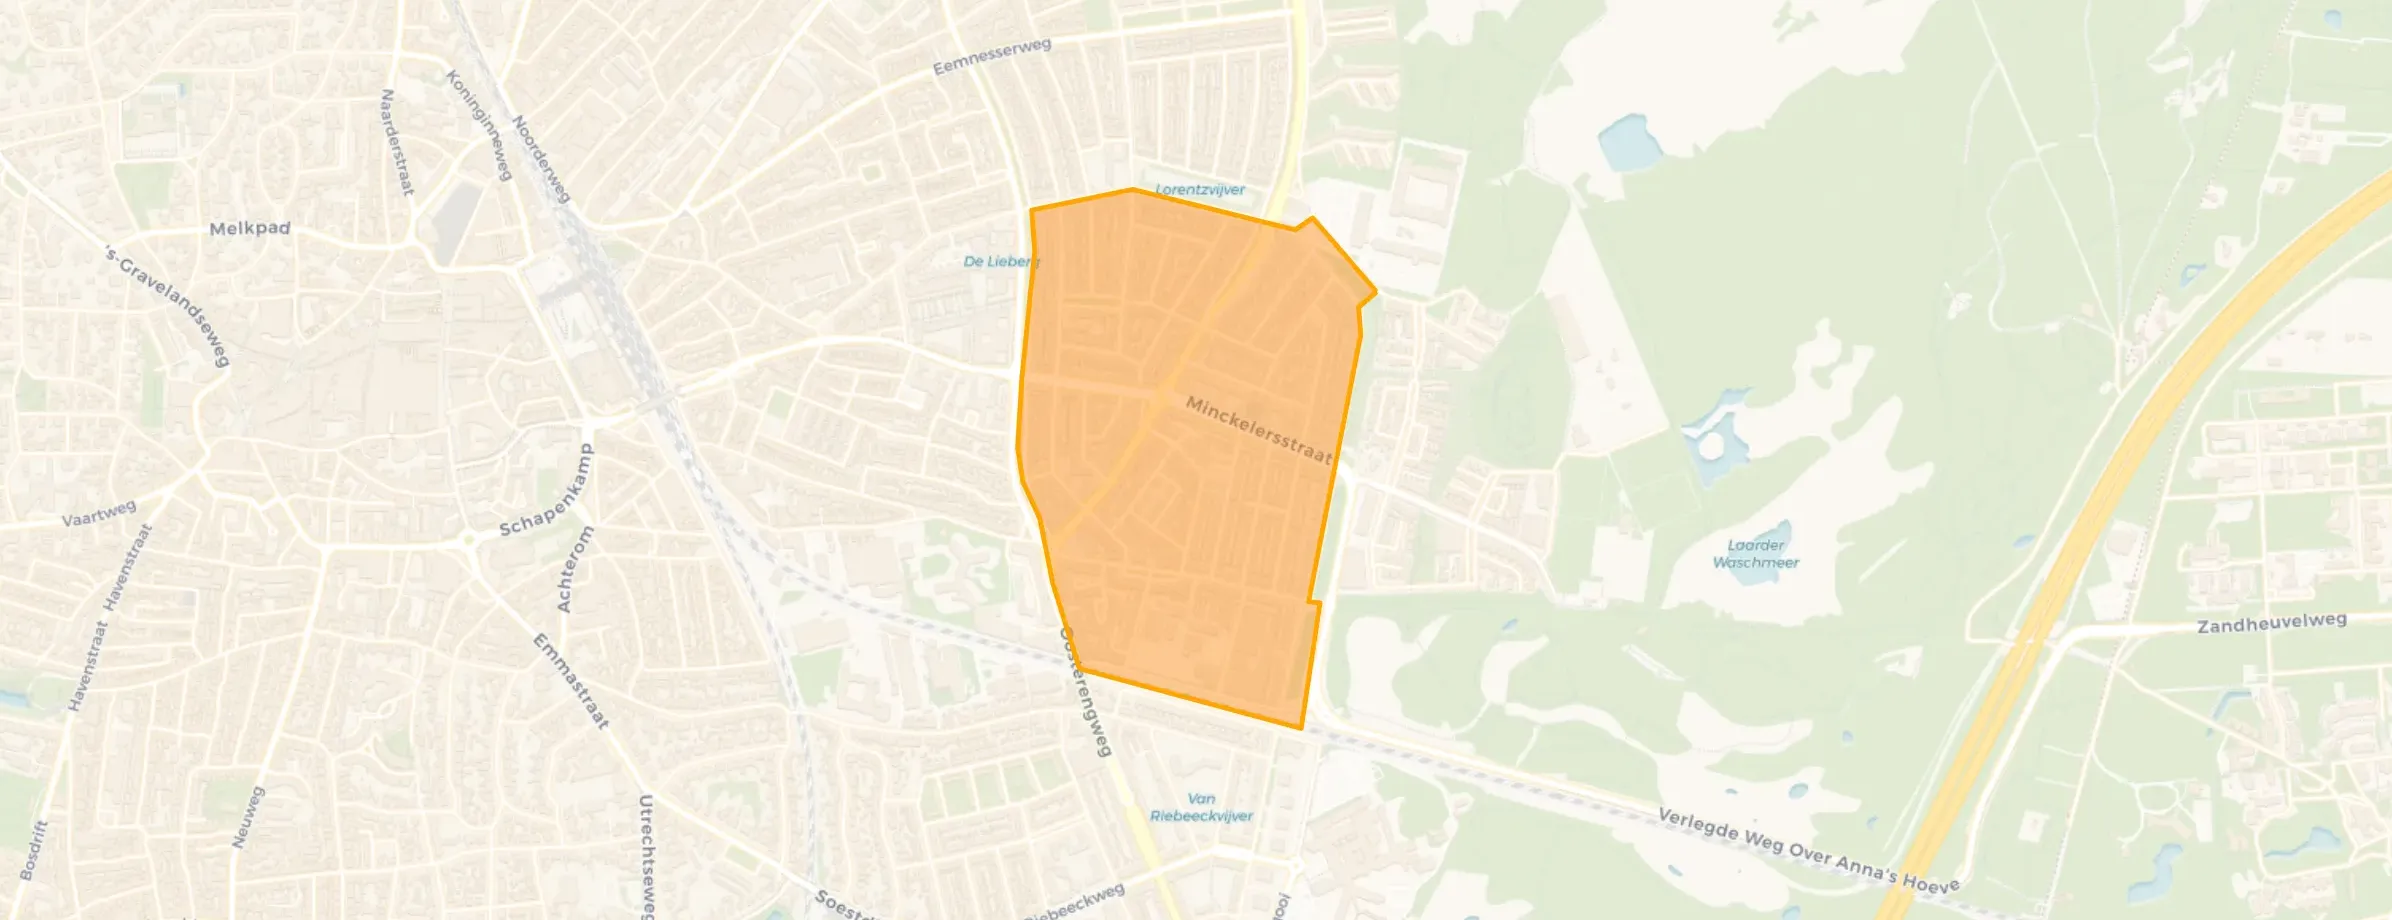
Liebergen is located in the province of Noord-Holland, in the municipality of Hilversum, in the district Oost The neighbourhood has a total area of 49 hectares, of which 49 hectares are land and 0 hectares are water. The neighbourhood is coded as BU04020604. The postcode area is 1223BK-1223RW.
One resident rates the neighbourhood as excellent with a score of 9.8. The resident describes this neighbourhood as 'Perfect neighbourhood to start a family'. Based on a limited number of reviews, no clear trends are visible yet in this neighbourhood.
Liebergen has 5.145 residents. Of these, 49,4% are men and 50,6% are women. Most residents are 25 to 45 years (29,7%). The other age groups are 26,7% for '45 to 65 years', 18,6% for '0 to 15 years', 14,4% for '65 years or older' and 10,6% for '15 to 25 years'. Of the residents, 53,6% is unmarried, 33,8% is married, 9,0% is divorced and 3,4% is widowed. 3.065 residents originate from the Netherlands, 490 come from Europe and 1.590 come from countries outside Europe.
There are 2.320 households in Liebergen. 38,8% of these are single-person households, 22,0% households without children and 39,2% households with children. The average household size is 2,2 persons. The national average is 2,1 persons.
In Liebergen there are 4.000 income recipients. The average income per income recipient is €37.800, which is €4.400 (10%) lower than the national average of €42.200. Per resident, the average income is €29.800, which is €5.100 (15%) lower than the national average of €34.900. Most residents of Liebergen are educated to an intermediate level. 36,6% have an intermediate education (HAVO, VWO or MBO 2-4), 34,5% have a lower education (VMBO or MBO 1) and 28,9% have a university or higher professional education (HBO/WO).
Of the 5.145 residents, around 69% are in paid employment, which amounts to 3.550 people. This is 3% lower than the national average of 72%. The majority of workers are in salaried employment (84%), while 16% are self-employed. In Liebergen, 23% of residents receive a benefit. The largest group is those receiving a state pension (AOW). 640 people receive this benefit.
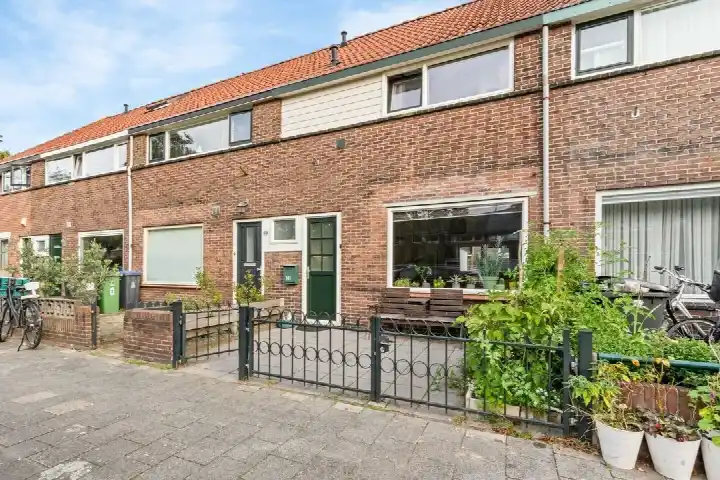
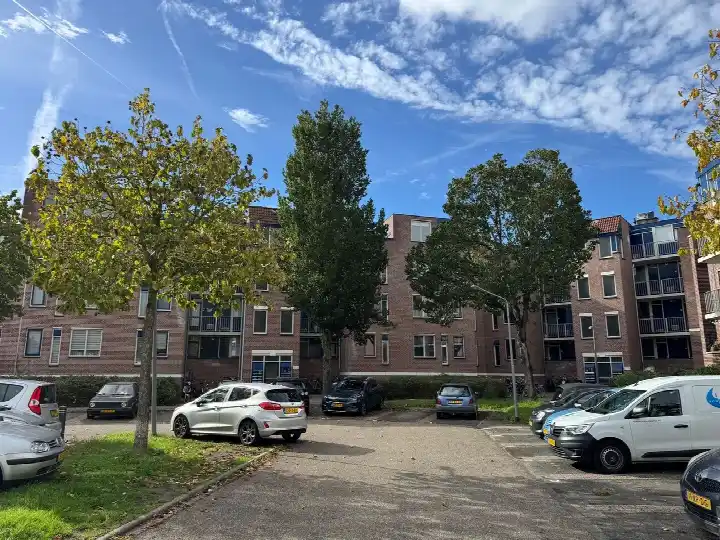
In Liebergen there are 2.256 homes with an average assessed value (WOZ) of €394.000. Of these, around 98% are occupied and 2% unoccupied. Most homes are rental properties. This amounts to 59% rental homes and 41% owner-occupied homes. Of the homes, 41% privately owned, 55% owned by housing associations and 4% owned by other landlords. The most common construction periods in Liebergen are 1925-1950 (51%) and 2000-2010 (25%).
There are currently 17 homes for sale in Liebergen. The most recently listed home is Merelstraat 57 by Alma & Tijhuis Makelaars-Taxateurs B.V.. Over the past year, 85 homes were sold in Liebergen. On average, a home was sold within 54 days.
The average asking price for a home for sale in Liebergen over the past year was €529.629. This is 34% higher than the average assessed value (WOZ) of €394.000. The average asking price per m² of plot is €5.634.
There are currently no homes for rent in Liebergen. The most recent home is Minckelersstraat 7, offered by CORPOwonen op Funda. Over the past year, 26 homes were let in Liebergen. On average, a listing was let within 45 days.
No recent rental data available for Liebergen.
In Liebergen there are 1.674 addresses with a registered energy label. The most common labels are A (36%), C (16%) and B (14%). On average, an address in Liebergen uses 2.250 kWh of electricity per year. This is 12% below the national average of 2.550 kWh. Natural gas consumption in this neighbourhood, at 800 m³ per year, exactly matches the national average.
I have lived in the Besselstraat my whole life and wouldn't want to live anywhere else. Everything is nearby (think: supermarket, school, petrol station, swimming pool, playgrounds, city centre, heath/forest/park, hospital/GP/pharmacy, young and old, snack bar, small beach, etc.) and everything still has the beautiful Dudok architecture. You can leave your bike in the garden without a lock and there is very good communication between neighbours thanks to the WhatsApp neighbourhood watch. Every year a outdoor play day is organised and from 10:00 to 22:00 it's nothing but fun for young and old. We also have good rules in the neighbourhood regarding nuisance, such as set times for DIY work so that as few people as possible are bothered by it. It's always very cosy; for example, when you take a walk on the heath, almost everyone says hello to you. A very nice neighbourhood to grow up in as there are many young families. The heath always looks very clean and beautiful, there are wild bulls and you can walk/picnic/run/mountain bike from sunrise to sunset. There has been some nuisance around the Lorentzvijver by foreigners, but that is very minimal and if you don't interfere they don't do anything, just send the police.
Auto-translated to English by AIThe housing stock is predominantly pre-war — 53% of the homes date from before 1945. In addition, the most common type is terraced houses (51%).
Over the past year a home for sale in Liebergen was listed for an average of €528,078 (€4,774 per m²). Last quarter prices fell by 15%.
Buurt Liebergen has 5,145 residents. The largest age group is 25 to 45 years (30%). Many families: 39% of the households have children.
From Liebergen you can on average reach a supermarket at 0.4 km, a GP at 0.5 km, a railway station at 1.6 km, a primary school at 0.5 km (as the crow flies, source: CBS).
Right now you will find 19 homes for sale and 1 homes for rent in Liebergen.