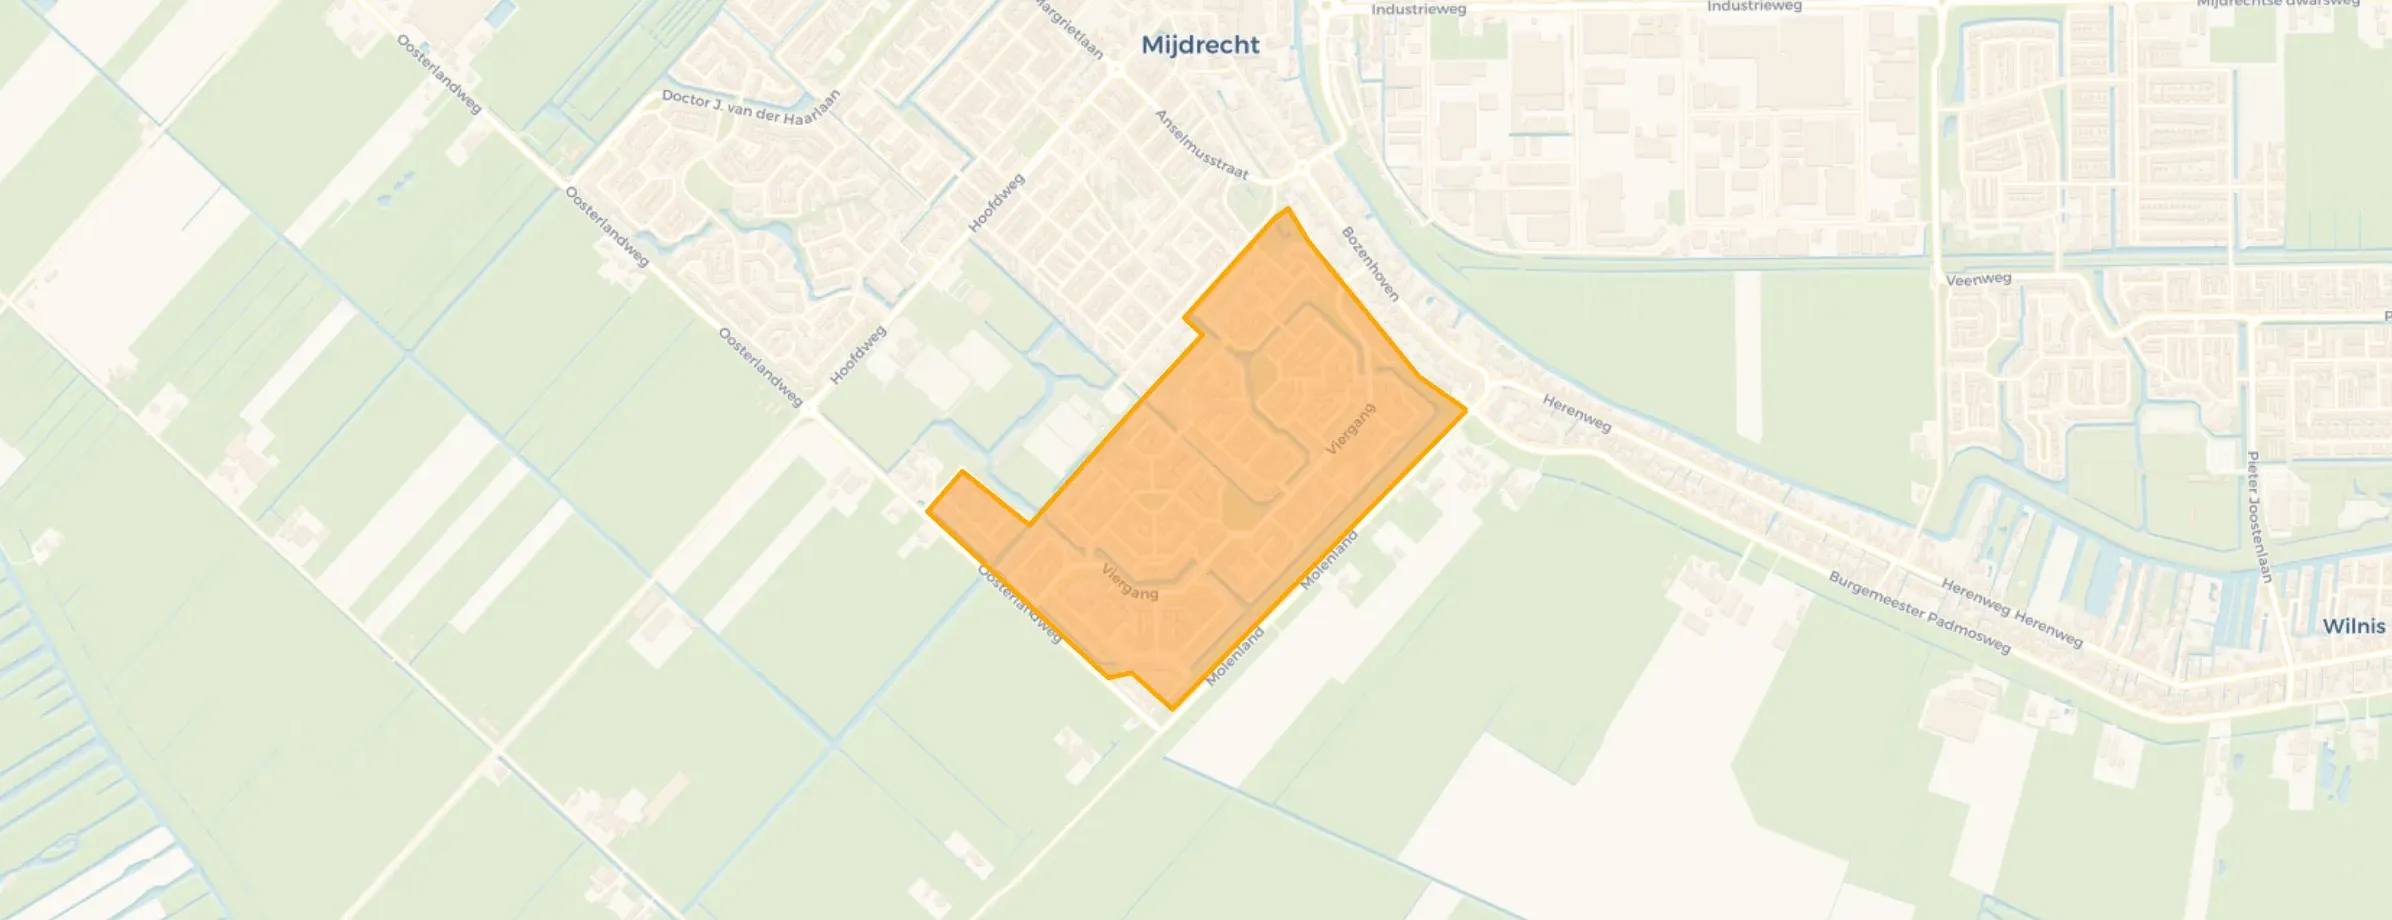
Neighbourhood in De Ronde Venen
Molenland is located in the province of Utrecht, in the municipality of De Ronde Venen, in the district Mijdrecht The neighbourhood has a total area of 46 hectares, of which 45 hectares are land and 1 hectares are water. The neighbourhood is coded as BU07360103. The postcode area is 3641AT-3642ZT.
Three residents rate the neighbourhood as good with a score of 7.3. They describe it as 'Lots of screaming next to me. 5 children and when my girlfriend comes, another 2', 'Annoying because of much too fast driving of cars, trucks, mopeds and Fadbike' and 'Nice neighbourhood with lots of greenery, which is well maintained'. Residents experience big differences in this neighbourhood: greenery, education, housing receive high ratings, while cleanliness and safety are mentioned as weak points.
Molenland has 3.080 residents. Of these, 50,0% are men and 49,8% are women. Most residents are 45 to 65 years (32,3%). The other age groups are 22,7% for '25 to 45 years', 19,3% for '65 years or older', 15,6% for '0 to 15 years' and 10,1% for '15 to 25 years'. Of the residents, 44,8% is unmarried, 44,6% is married, 7,0% is divorced and 3,6% is widowed. 2.510 residents originate from the Netherlands, 160 come from Europe and 415 come from countries outside Europe.
There are 1.290 households in Molenland. 27,9% of these are single-person households, 31,0% households without children and 41,1% households with children. The average household size is 2,4 persons.
In Molenland there are 2.600 income recipients. The average income per income recipient is €39.200, which is €3.400 (9%) higher than the national average of €35.800. Per resident, the average income is €32.500, which is €3.300 (11%) higher than the national average of €29.200. Most residents of Molenland are educated to an intermediate level. 45,1% have an intermediate education (HAVO, VWO or MBO 2-4), 29,3% have a university or higher professional education (HBO/WO) and 25,6% have a lower education (VMBO or MBO 1).
Of the 3.080 residents, around 69% are in paid employment, which amounts to 2.125 people. This is 4% higher than the national average of 65%. The majority of workers are in salaried employment (87%), while 13% are self-employed. In Molenland, 23% of residents receive a benefit. The largest group is those receiving a state pension (AOW). 470 people receive this benefit.
In Molenland there are 1.299 homes with an average assessed value (WOZ) of €406.000. Of these, around 99% are occupied and 1% unoccupied. Most homes are owner-occupied. This amounts to 39% rental homes and 61% owner-occupied homes. Of the homes, 62% privately owned, 31% owned by housing associations and 7% owned by other landlords. The most common construction periods in Molenland are 1980-1990 (67%) and 1990-2000 (30%).
There are currently no homes for sale in Molenland. The most recently listed home is Windmolen 63 by Vida makelaars og - Mijdrecht, Vinkeveen, Wilnis. No homes were sold in Molenland over the past year.
There are currently no homes for rent in Molenland. The most recent home is Poldermolen 27, offered by REBO Huurwoningen. No homes were let in Molenland over the past year.
No recent rental data available for Molenland.
In Molenland there are 1.300 addresses with a registered energy label. The most common labels are C (53%), B (31%) and A (13%). On average, an address in Molenland uses 2.710 kWh of electricity per year. This is 4% below the national average of 2.810 kWh. With an annual consumption of 920 m³ per address, natural gas consumption is 28% below the national average of 1.280 m³.
Very antisocial next to me.
Auto-translated to English by AIBeautiful neighbourhood, lots of greenery, much too fast driving by all traffic, the maximum speed is only 30 km/h and is hugely exceeded in some places. Behind houses, 3 cars regularly come a few times a week and according to residents, drugs are traded, judging by the packaging left behind. Children play there, but the police do not check despite various reports and video footage that have been offered to the police.
Auto-translated to English by AIThe neighbourhood looks good with various beautiful and nice houses. The number of playing children is increasing, but for them it is very unsafe because the through road Viergang, where a maximum speed of 30 km/h applies, is used as a racetrack by cars, trucks and mopeds. Sometimes there is an electronic speed display, where very often speeds that the user considers normal, such as 60 to even 90 km per hour, are achieved. I have observed this myself when I monitored the speed registration for a while, but no results of the registration findings ever come out. I have often complained about this, but to no avail. My preference is therefore to put many more stickers and signs along and on the road and more higher speed bumps. Also on various remote parking lots behind residential blocks, we have various cars gathering in the evening hours between 10:00 PM and 12:00 AM on Tuesdays and Fridays, and we see on camera that multiple people get into one car and later disappear in all directions, and this happens every week. We have reported this to the police, but as far as we know, nothing has ever been checked about what the youth are up to there. We as a neighbourhood find this worrying. All in all, we hope that the situation on the Viergang improves and that speed-limiting actions are taken, as well as checking what the youngsters are up to on the parking lots.
Auto-translated to English by AI
The housing stock is mainly post-war — 56% was built between 1945 and 1990. In addition, the most common type is terraced houses (59%).
Over the past year a home for sale in Molenland was listed for an average of €546,375 (€4,350 per m²).
A rental home in Molenland cost an average of €1,534 per month (€16 per m²).
Residents give Molenland a 7.3 out of 10 based on 3 reviews. Education stands out with a 8.7; safety lags behind with a 5.0.
Buurt Molenland has 3,080 residents. The largest age group is 45 to 65 years (32%). Many families: 41% of the households have children.
The housing supply in Molenland is remarkably efficient: 62% has an A, A+ or B label. The average natural gas consumption per household is 920 m³ per year.
From Molenland you can on average reach a supermarket at 1.3 km, a GP at 0.9 km, a railway station at 12.0 km, a primary school at 0.4 km (as the crow flies, source: CBS).

Buurtje.nl uses cookies to make the site work and to improve it. In doing so, we process data such as your IP address and the pages you visit.
We use this data for three purposes: running the website (functional), measuring visits so we can improve Buurtje.nl (analytics), and — if you allow it — tailoring ads to your interests (marketing).
How we handle your data is described in our privacy policy. You can change your preferences at any time via 'Cookie preferences' at the bottom of every page.
Choose per category which cookies we may place. Read more in our privacy policy.