Neighbourhood in Woerden
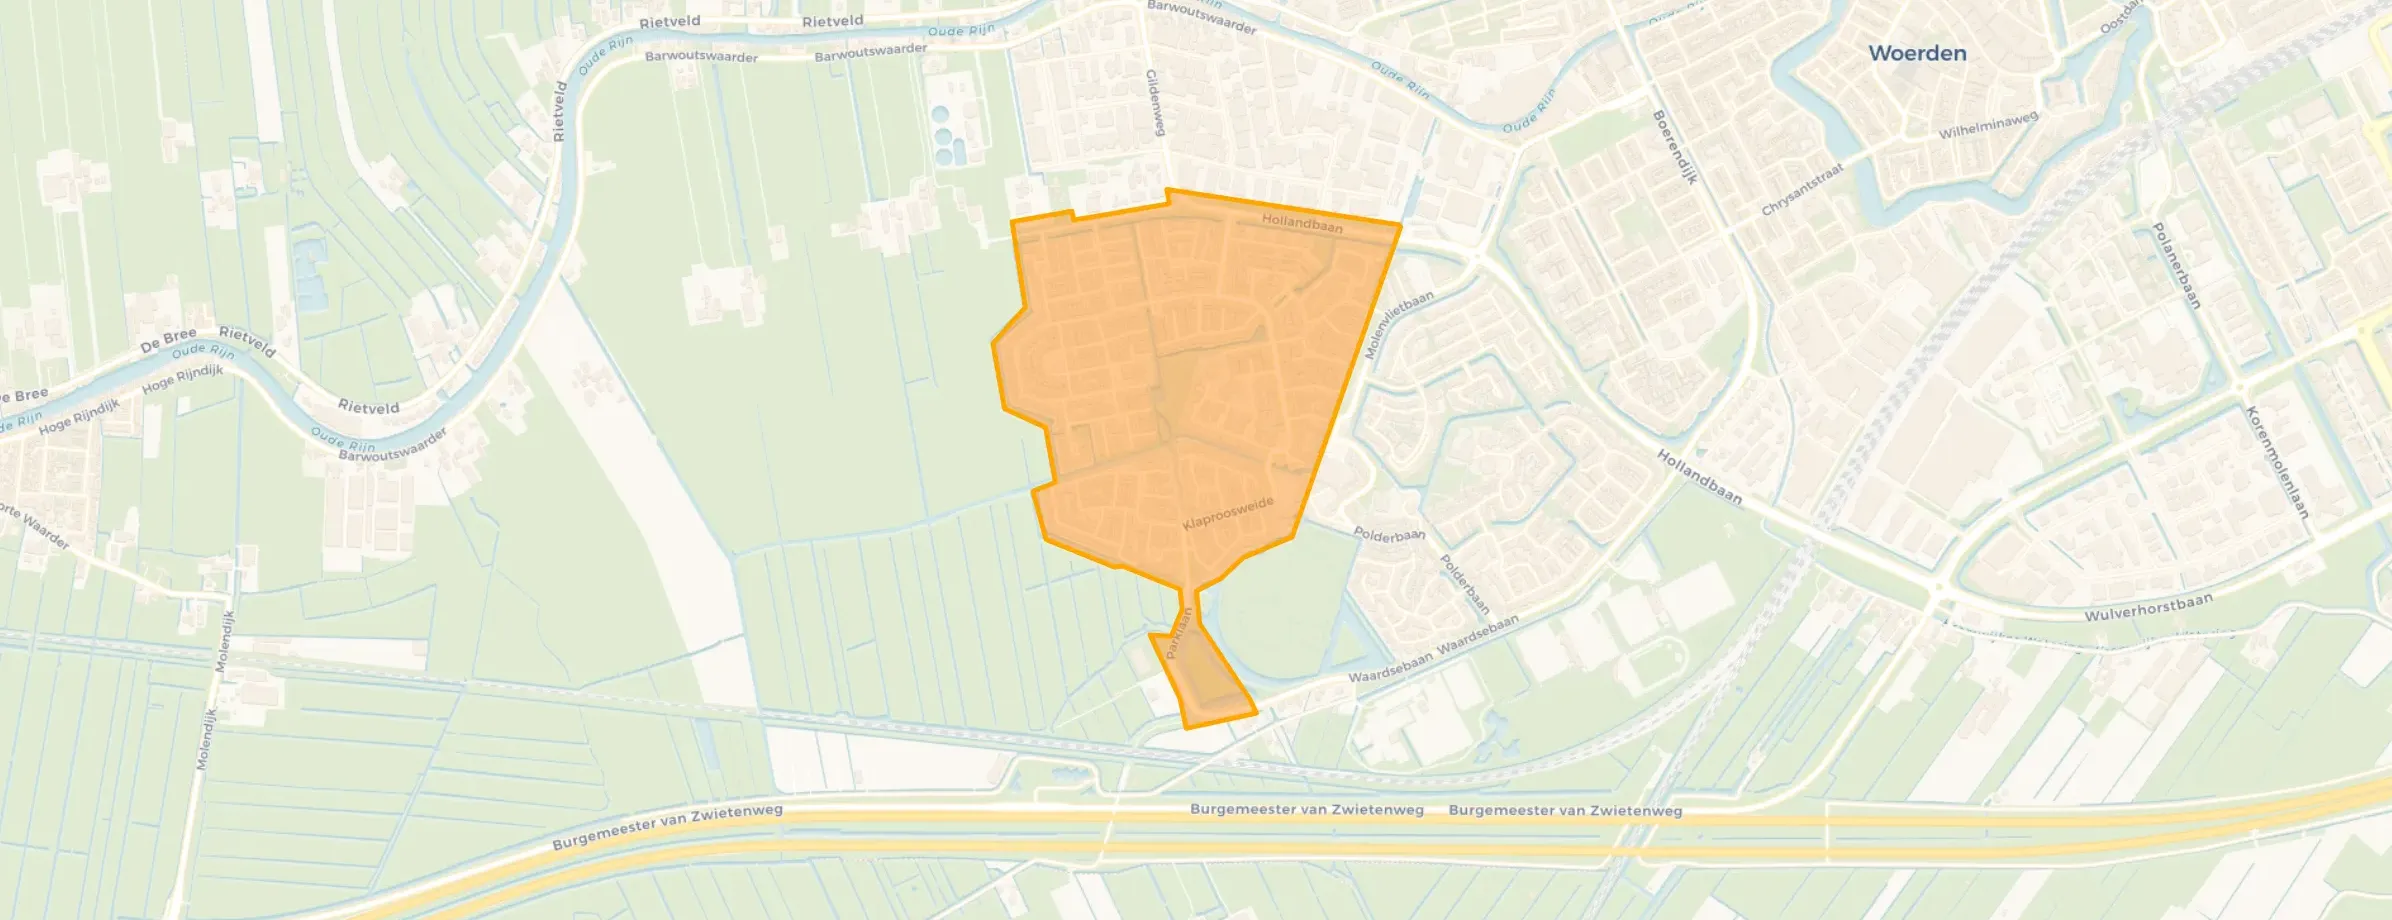
Molenvliet-West is located in the province of Utrecht, in the municipality of Woerden, in the district Woerden-West The neighbourhood has a total area of 65 hectares, of which 64 hectares are land and 1 hectares are water. The neighbourhood is coded as BU06320202. The postcode area is 3448EA-3448ZP.
Four residents rate the neighbourhood as good with a score of 7.5. They describe it as 'Large cauliflower district', 'Beautiful neighbourhood with all necessary amenities' and 'Quiet, cosy, mostly friendly neighbourhood'. Aspects such as education, safety, greenery are rated well in this neighbourhood, while community and accessibility score less well.
Molenvliet-West has 5.310 residents. Of these, 50,5% are men and 49,6% are women. Most residents are 45 to 65 years (27,8%). The other age groups are 26,2% for '25 to 45 years', 17,5% for '0 to 15 years', 15,7% for '65 years or older' and 12,7% for '15 to 25 years'. Of the residents, 51,4% is unmarried, 38,1% is married, 8,0% is divorced and 2,4% is widowed. 4.145 residents originate from the Netherlands, 250 come from Europe and 910 come from countries outside Europe.
There are 2.305 households in Molenvliet-West. 34,7% of these are single-person households, 26,5% households without children and 38,8% households with children. The average household size is 2,3 persons. The national average is 2,1 persons.
In Molenvliet-West there are 4.300 income recipients. The average income per income recipient is €42.900, which is €700 (2%) higher than the national average of €42.200. Per resident, the average income is €34.900, which is €0 (0%) lower than the national average of €34.900. Most residents of Molenvliet-West are educated to an intermediate level. 43,5% have an intermediate education (HAVO, VWO or MBO 2-4), 32,0% have a university or higher professional education (HBO/WO) and 24,5% have a lower education (VMBO or MBO 1).
Of the 5.310 residents, around 73% are in paid employment, which amounts to 3.876 people. This is 1% higher than the national average of 72%. The majority of workers are in salaried employment (88%), while 12% are self-employed. In Molenvliet-West, 22% of residents receive a benefit. The largest group is those receiving a state pension (AOW). 730 people receive this benefit.
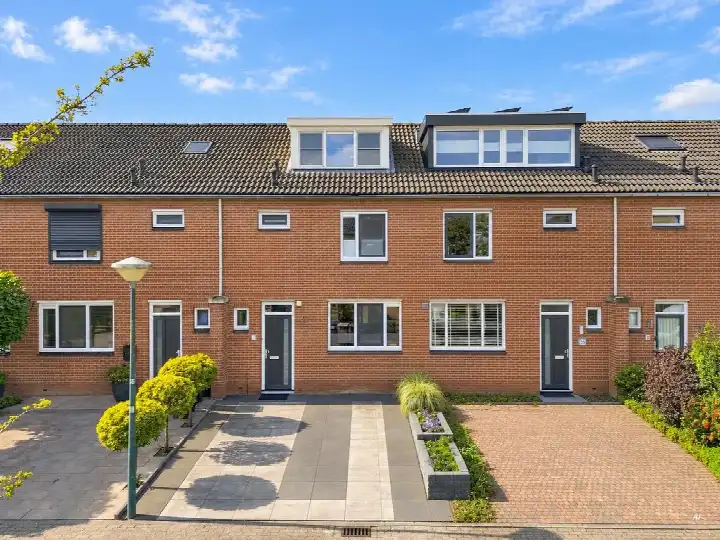
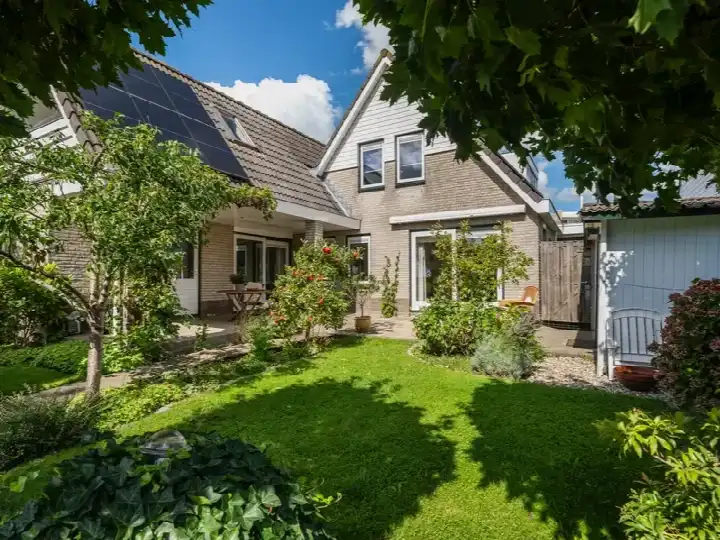
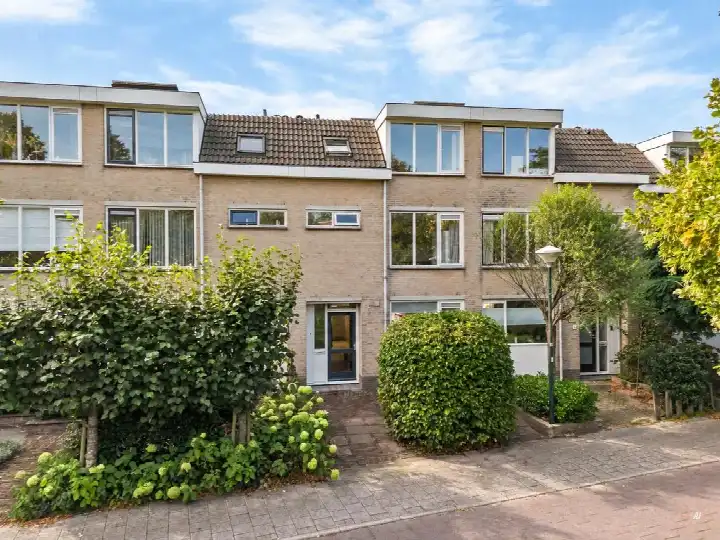
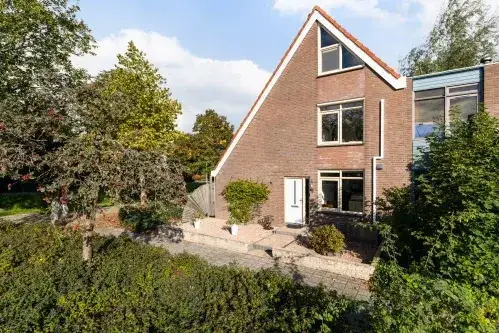
In Molenvliet-West there are 2.311 homes with an average assessed value (WOZ) of €369.000. Of these, around 97% are occupied and 3% unoccupied. Most homes are owner-occupied. This amounts to 40% rental homes and 60% owner-occupied homes. Of the homes, 60% privately owned, 33% owned by housing associations and 7% owned by other landlords. The most common construction periods in Molenvliet-West are 1980-1990 (84%) and 1990-2000 (16%).
There are currently 12 homes for sale in Molenvliet-West. The most recently listed home is Weegbreeweide 33 by geWOON Marcel. Over the past year, 125 homes were sold in Molenvliet-West. On average, a home was sold within 39 days.
The average asking price for a home for sale in Molenvliet-West over the past year was €484.351. This is 31% higher than the average assessed value (WOZ) of €369.000. The average asking price per m² of plot is €4.403.
There are currently no homes for rent in Molenvliet-West. The most recent home is Molenvlietbrink 269, offered by Beauvastgoed Beheer B.V. op Funda. Over the past year, 6 homes were let in Molenvliet-West. On average, a listing was let within 46 days.
No recent rental data available for Molenvliet-West.
In Molenvliet-West there are 1.461 addresses with a registered energy label. The most common labels are C (37%), B (32%) and A (26%). On average, an address in Molenvliet-West uses 2.300 kWh of electricity per year. This is 10% below the national average of 2.550 kWh. With an annual consumption of 730 m³ per address, natural gas consumption is 9% below the national average of 800 m³.
Safe neighbourhood, nice for families.
Auto-translated to English by AIA beautiful neighbourhood with few problems, near 2 primary schools and plenty of playgrounds. Nice nature along the Weidenpad and a cosy neighbourhood
Auto-translated to English by AIWhen I first moved here it felt like a holiday, getting to know the neighbours took a while but over the years I now fit in well, except for a few, but I don't take that too seriously because there are anonymous complainers who don't bother to get to know us either. I enjoy the peace and the surroundings and those who help me or whom I can help. It's nice to keep an eye on each other in a positive way and respect each other. The neighbourhood is well maintained and if something could be better, it's pointed out. There are quite a lot of schools nearby, children can entertain themselves reasonably well. If you like meadows and water, you'll live here quite nicely.
Auto-translated to English by AIThe neighbourhood is okay but not right, finding a new house in the neighbourhood will be difficult because of the refugees, and the bus line here doesn't run 9 out of 10 times, public transport is not okay
Auto-translated to English by AIThe housing stock is mainly post-war — 87% was built between 1945 and 1990. In addition, the most common type is terraced houses (46%).
Over the past year a home for sale in Molenvliet-West was listed for an average of €483,822 (€4,756 per m²).
Residents give Molenvliet-West a 7.5 out of 10 based on 4 reviews. The strongest score is for education (8.5), the weakest for accessibility (6.3).
Buurt Molenvliet-West has 5,310 residents. Many families: 39% of the households have children.
The housing supply in Molenvliet-West is remarkably efficient: 78% has an A, A+ or B label. The average natural gas consumption per household is 730 m³ per year.
From Molenvliet-West you can on average reach a supermarket at 1.9 km, a GP at 2.0 km, a railway station at 3.5 km, a primary school at 0.5 km (as the crow flies, source: CBS).
Right now you will find 15 homes for sale in Molenvliet-West.