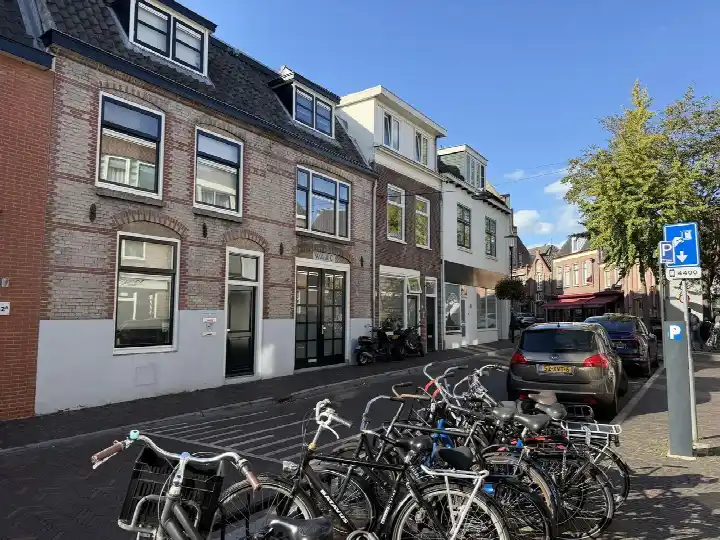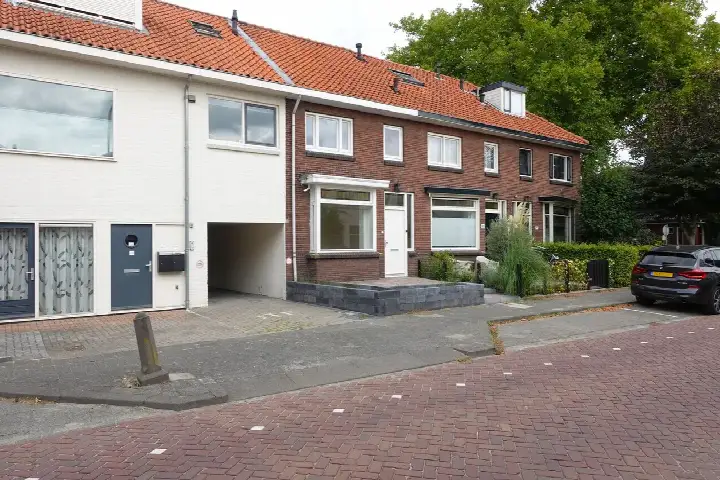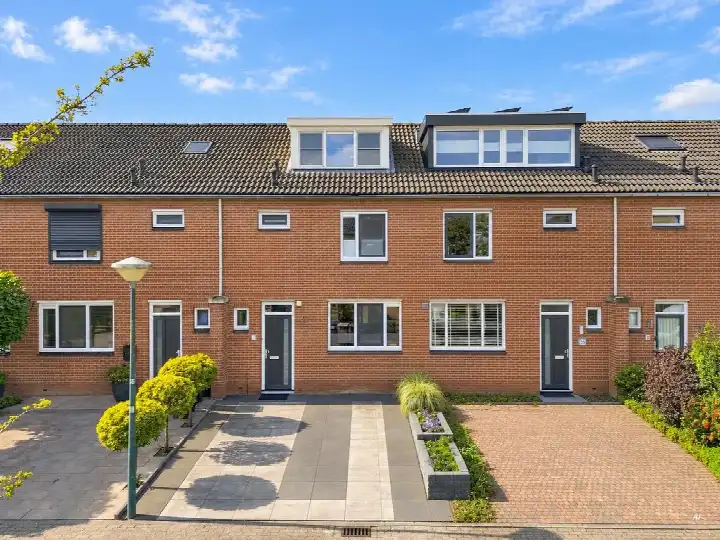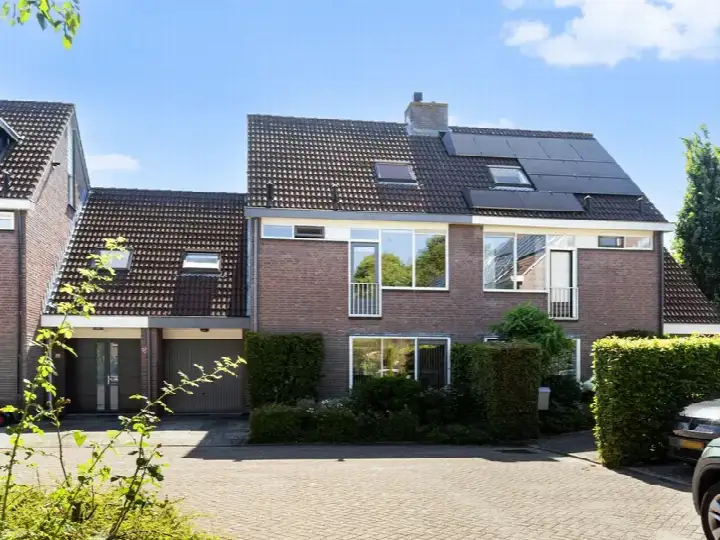
Municipality in Utrecht
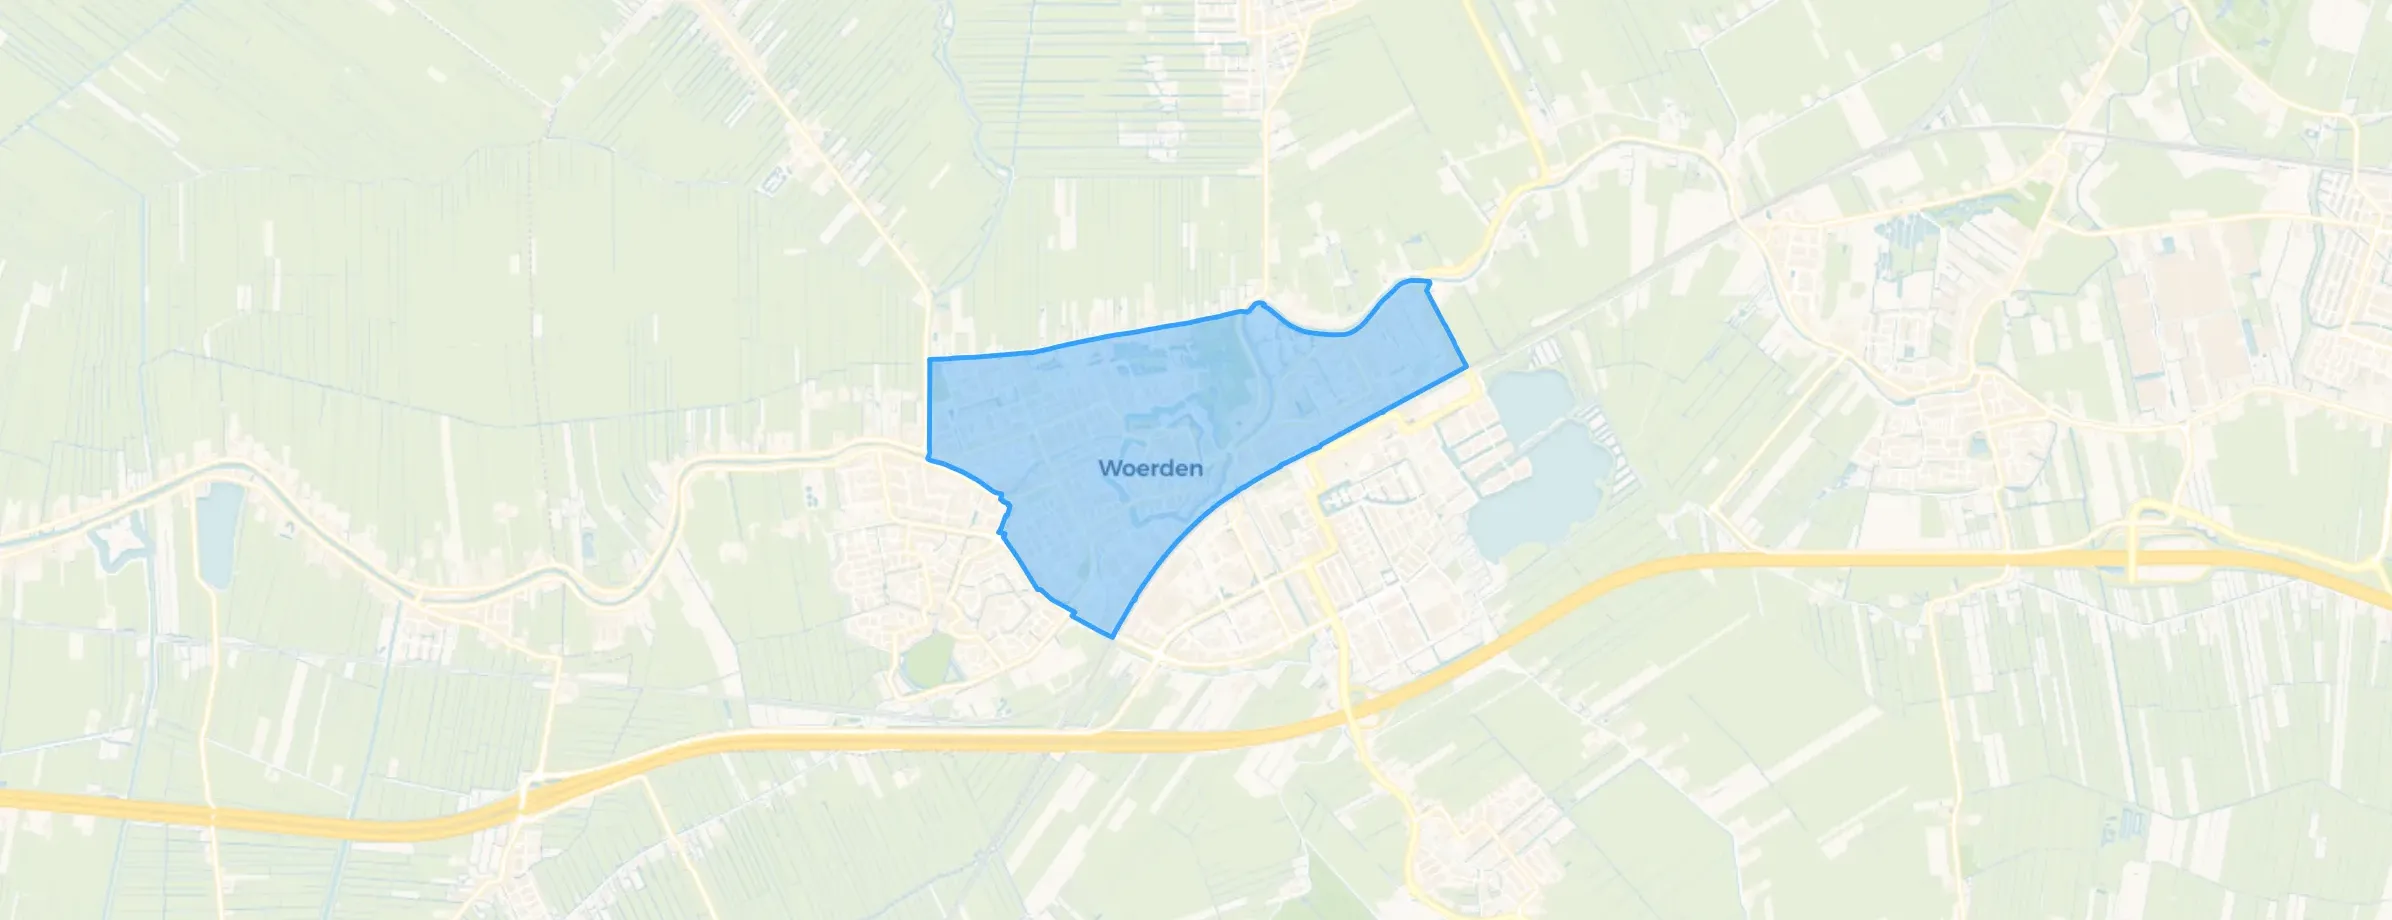
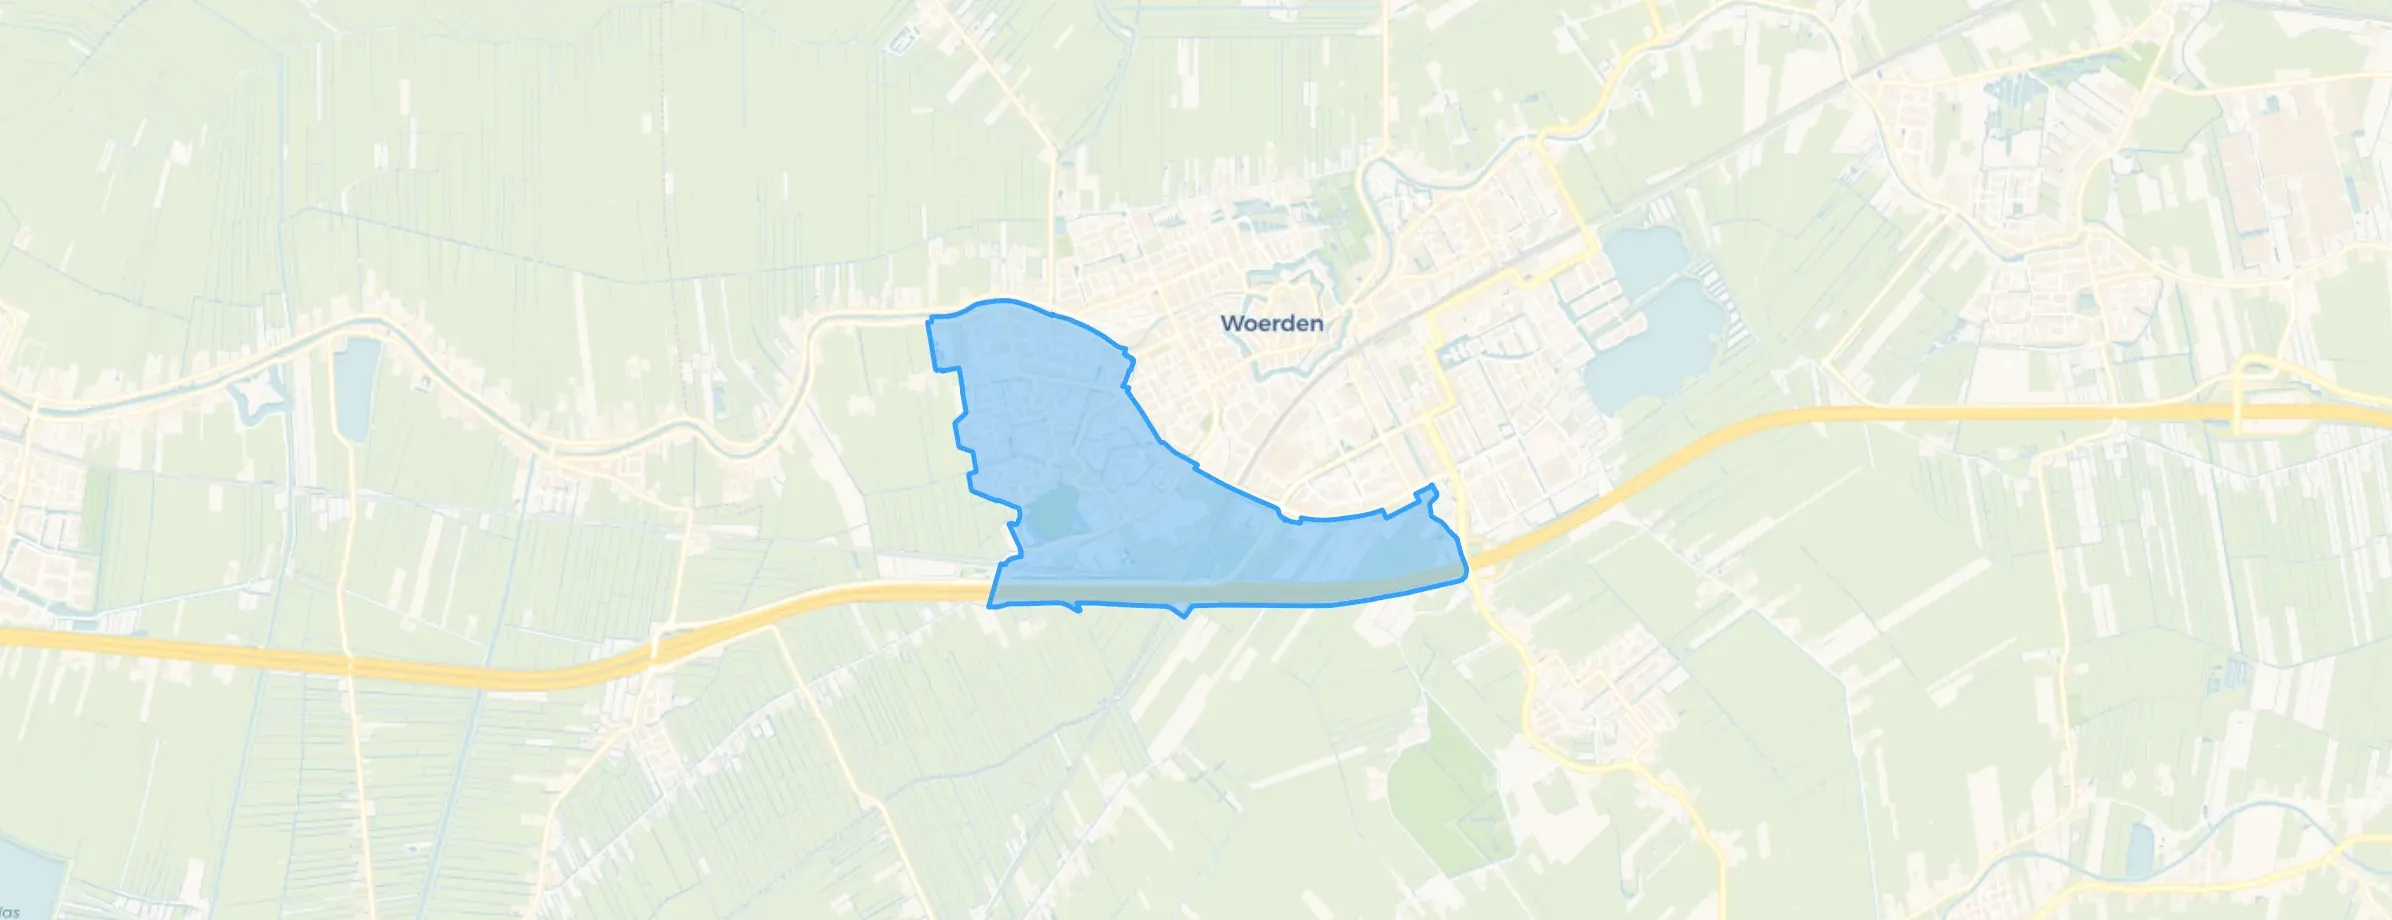
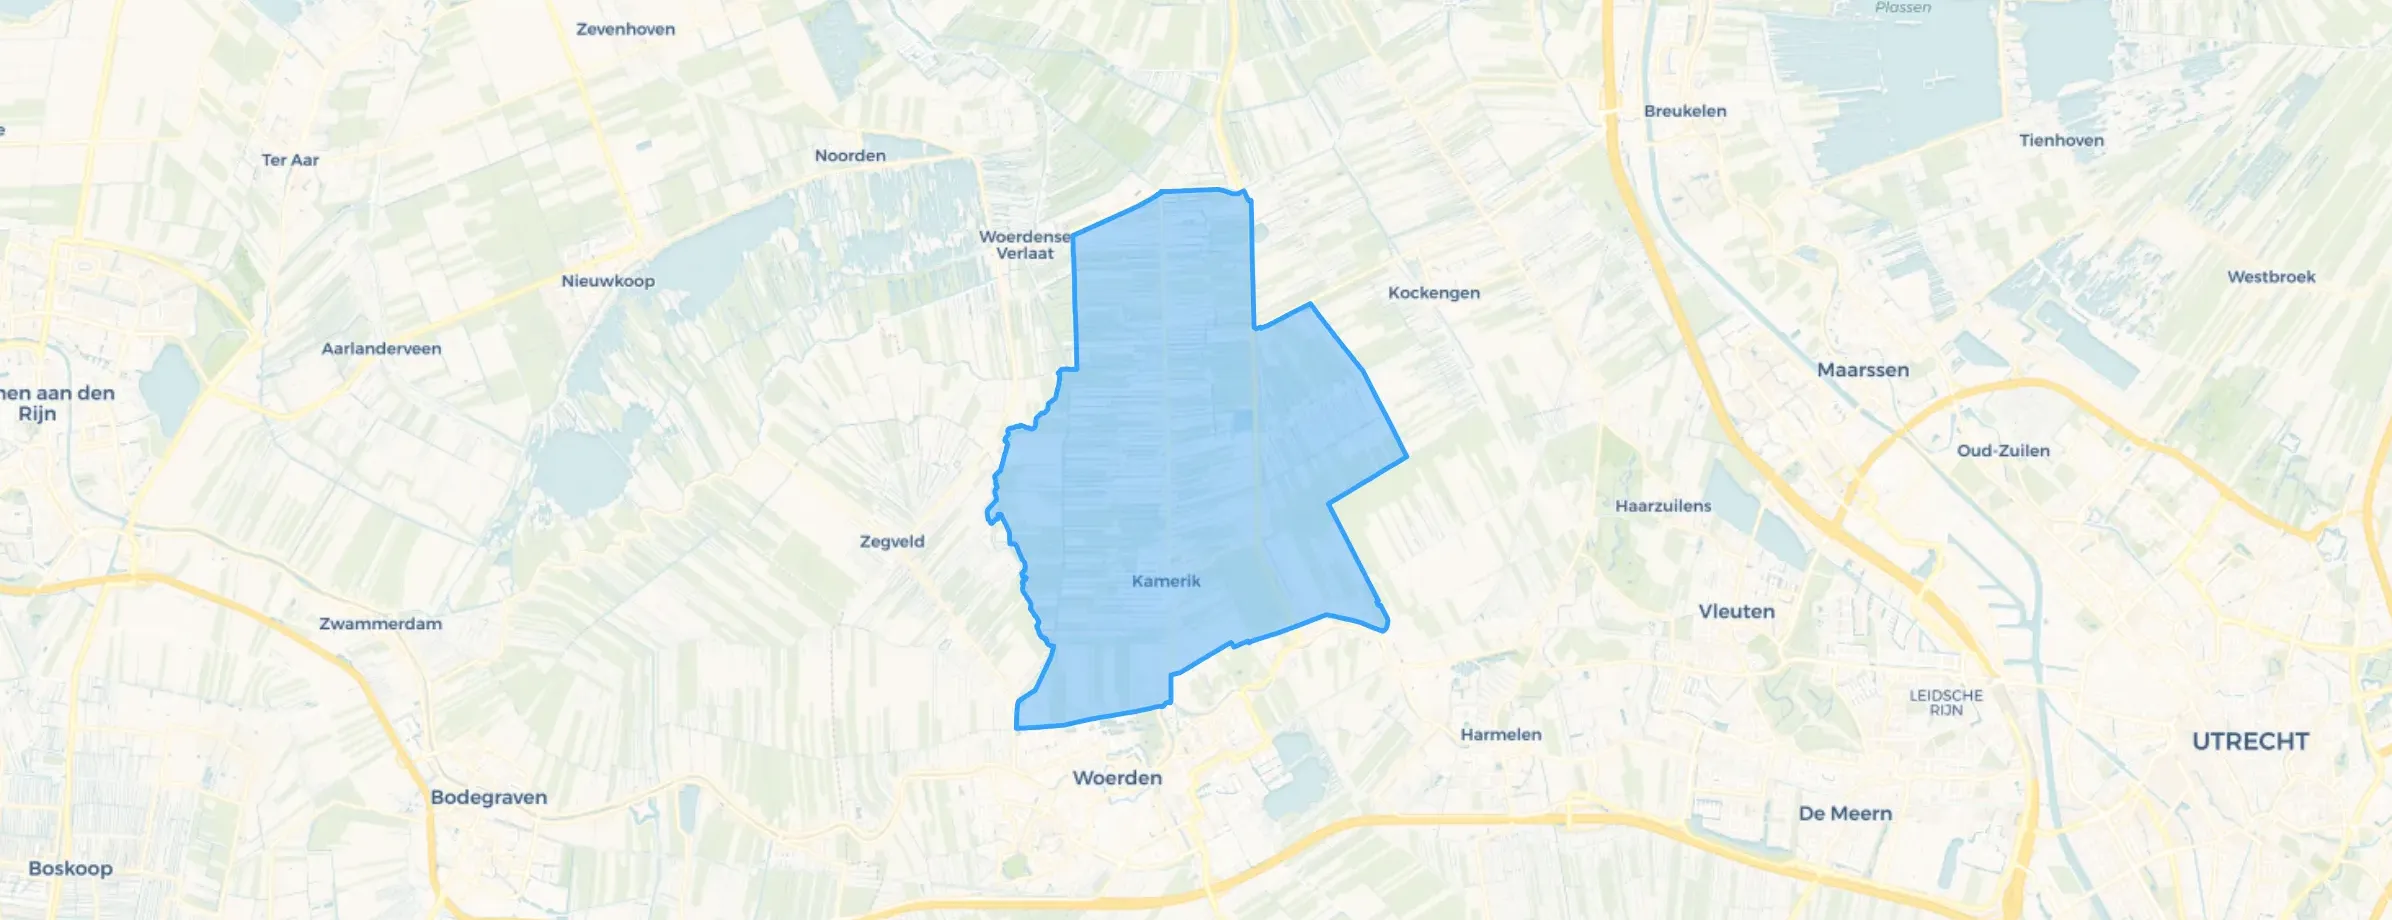
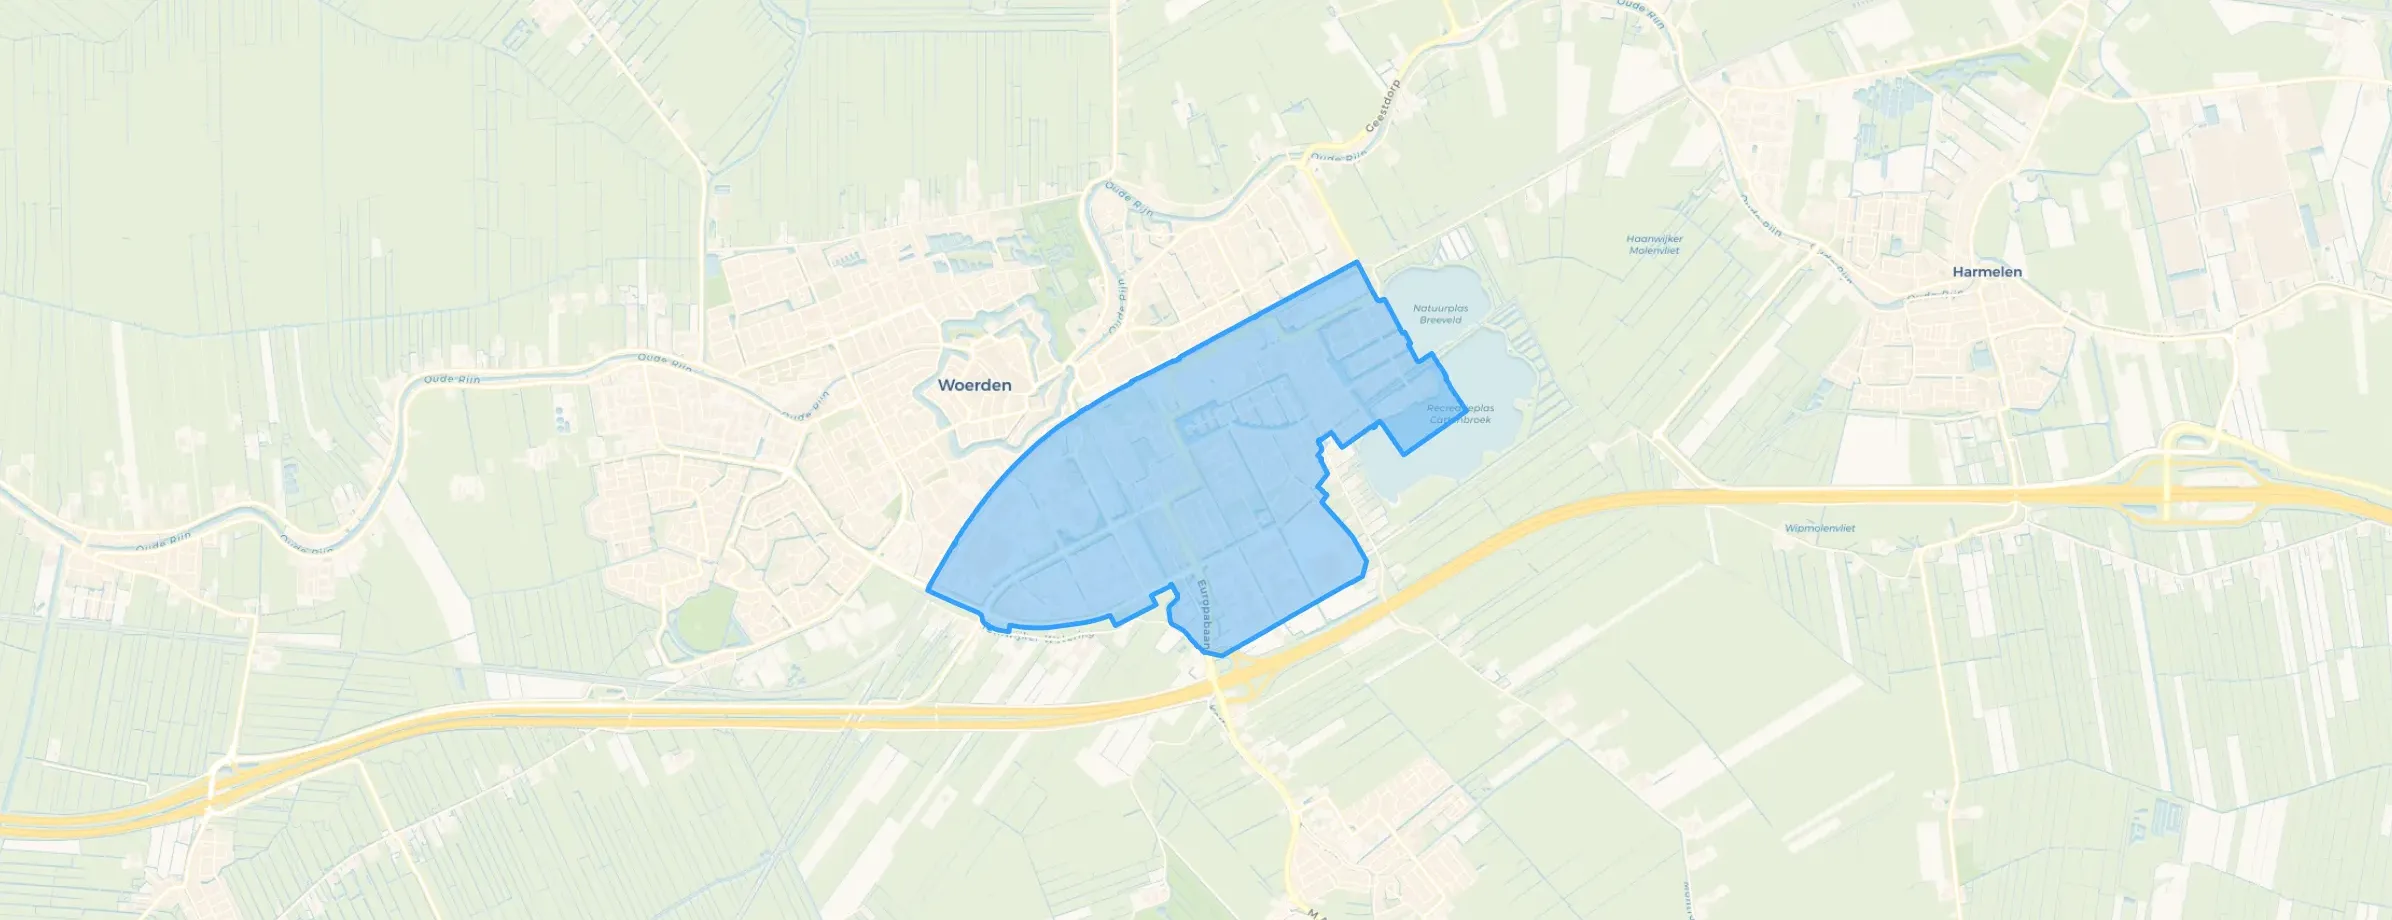
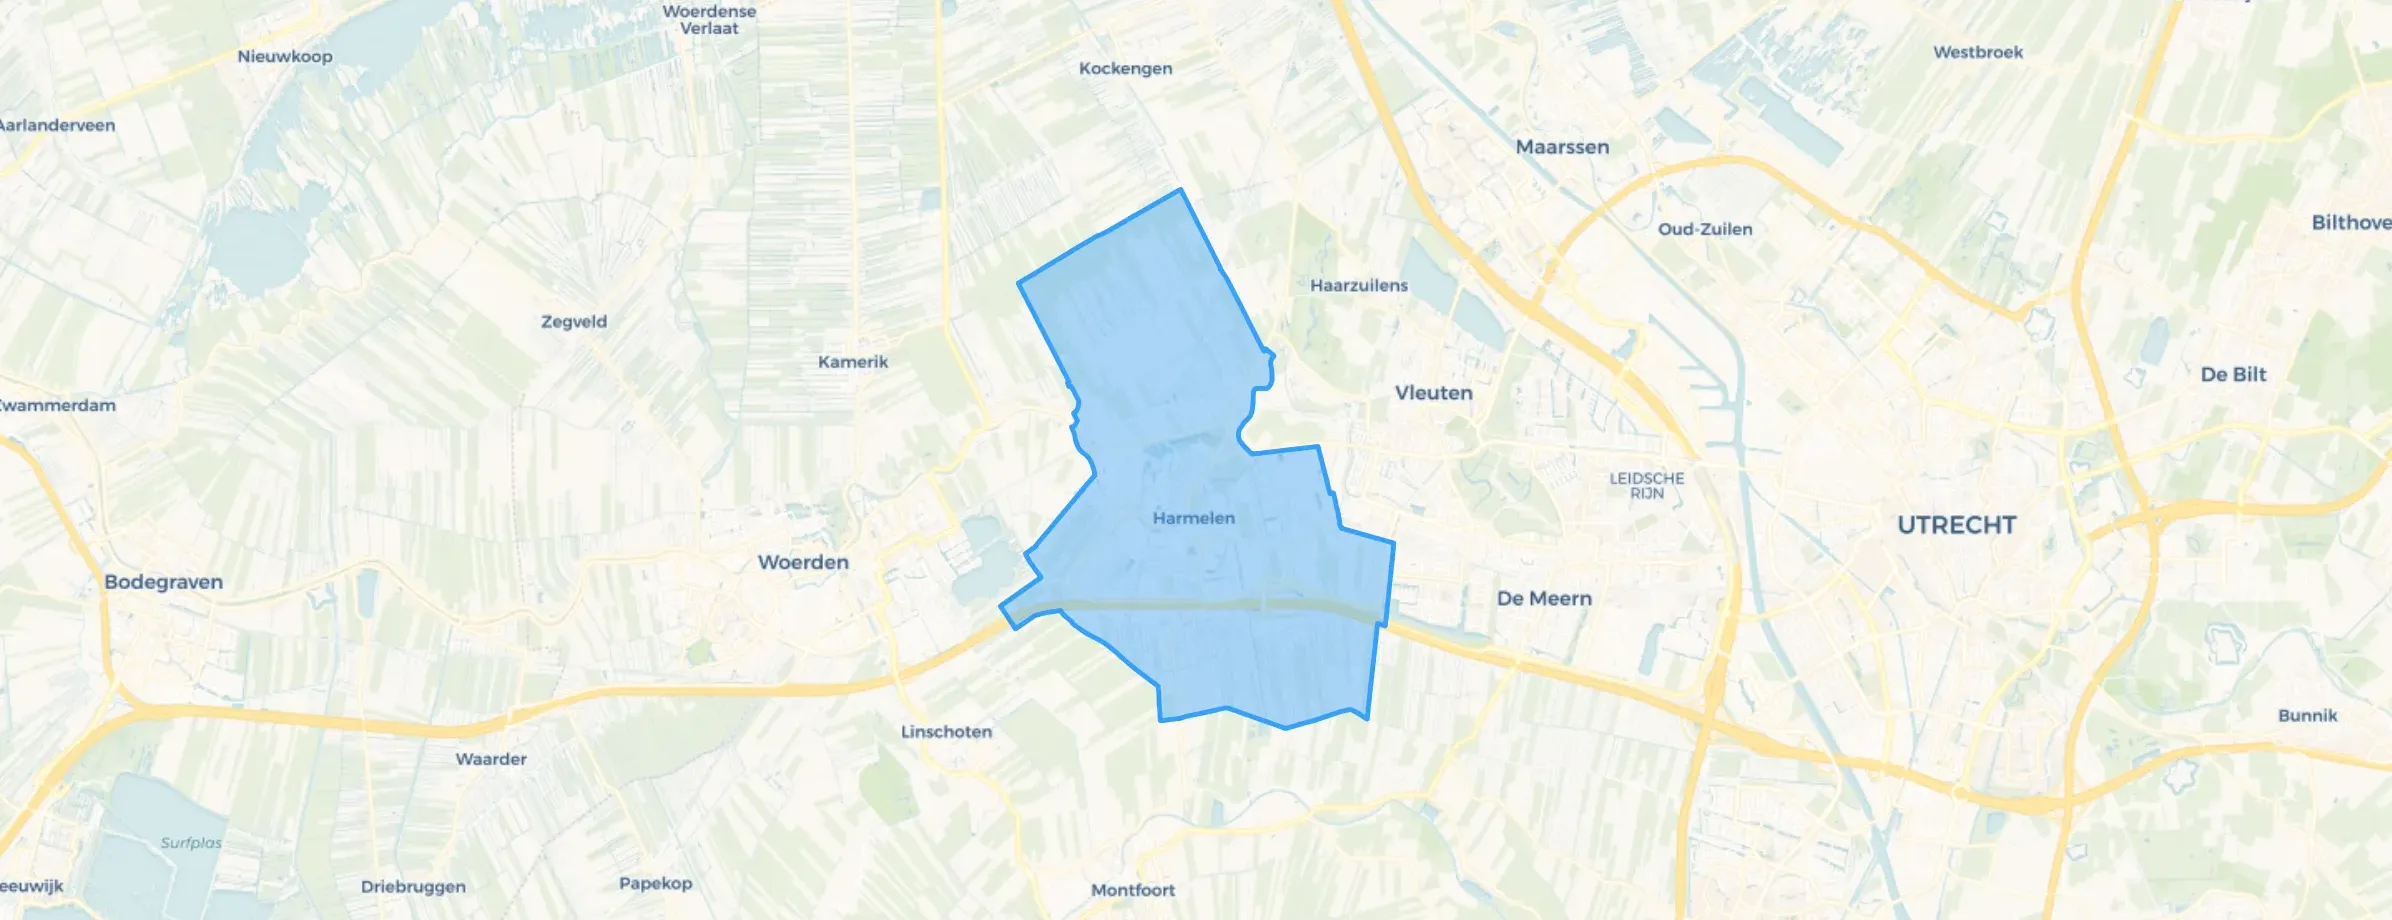
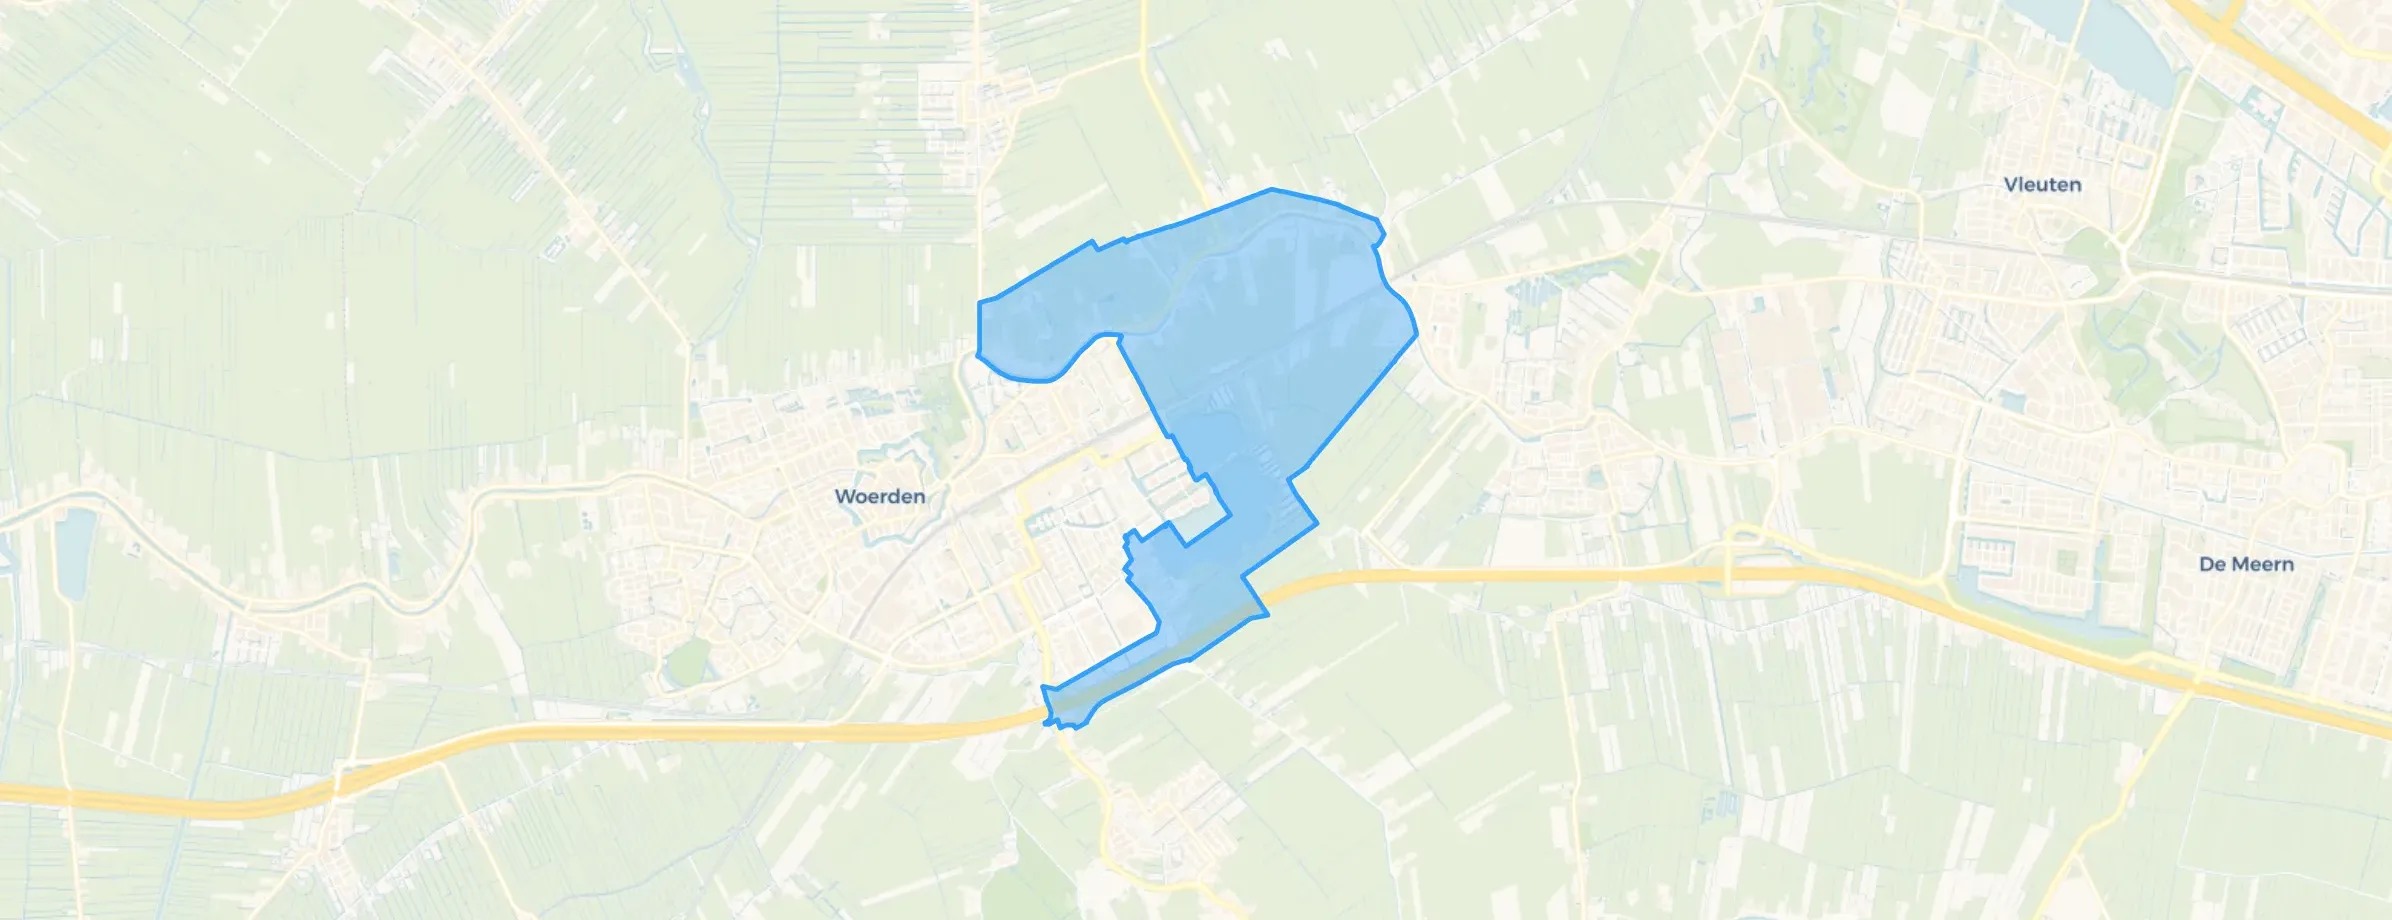
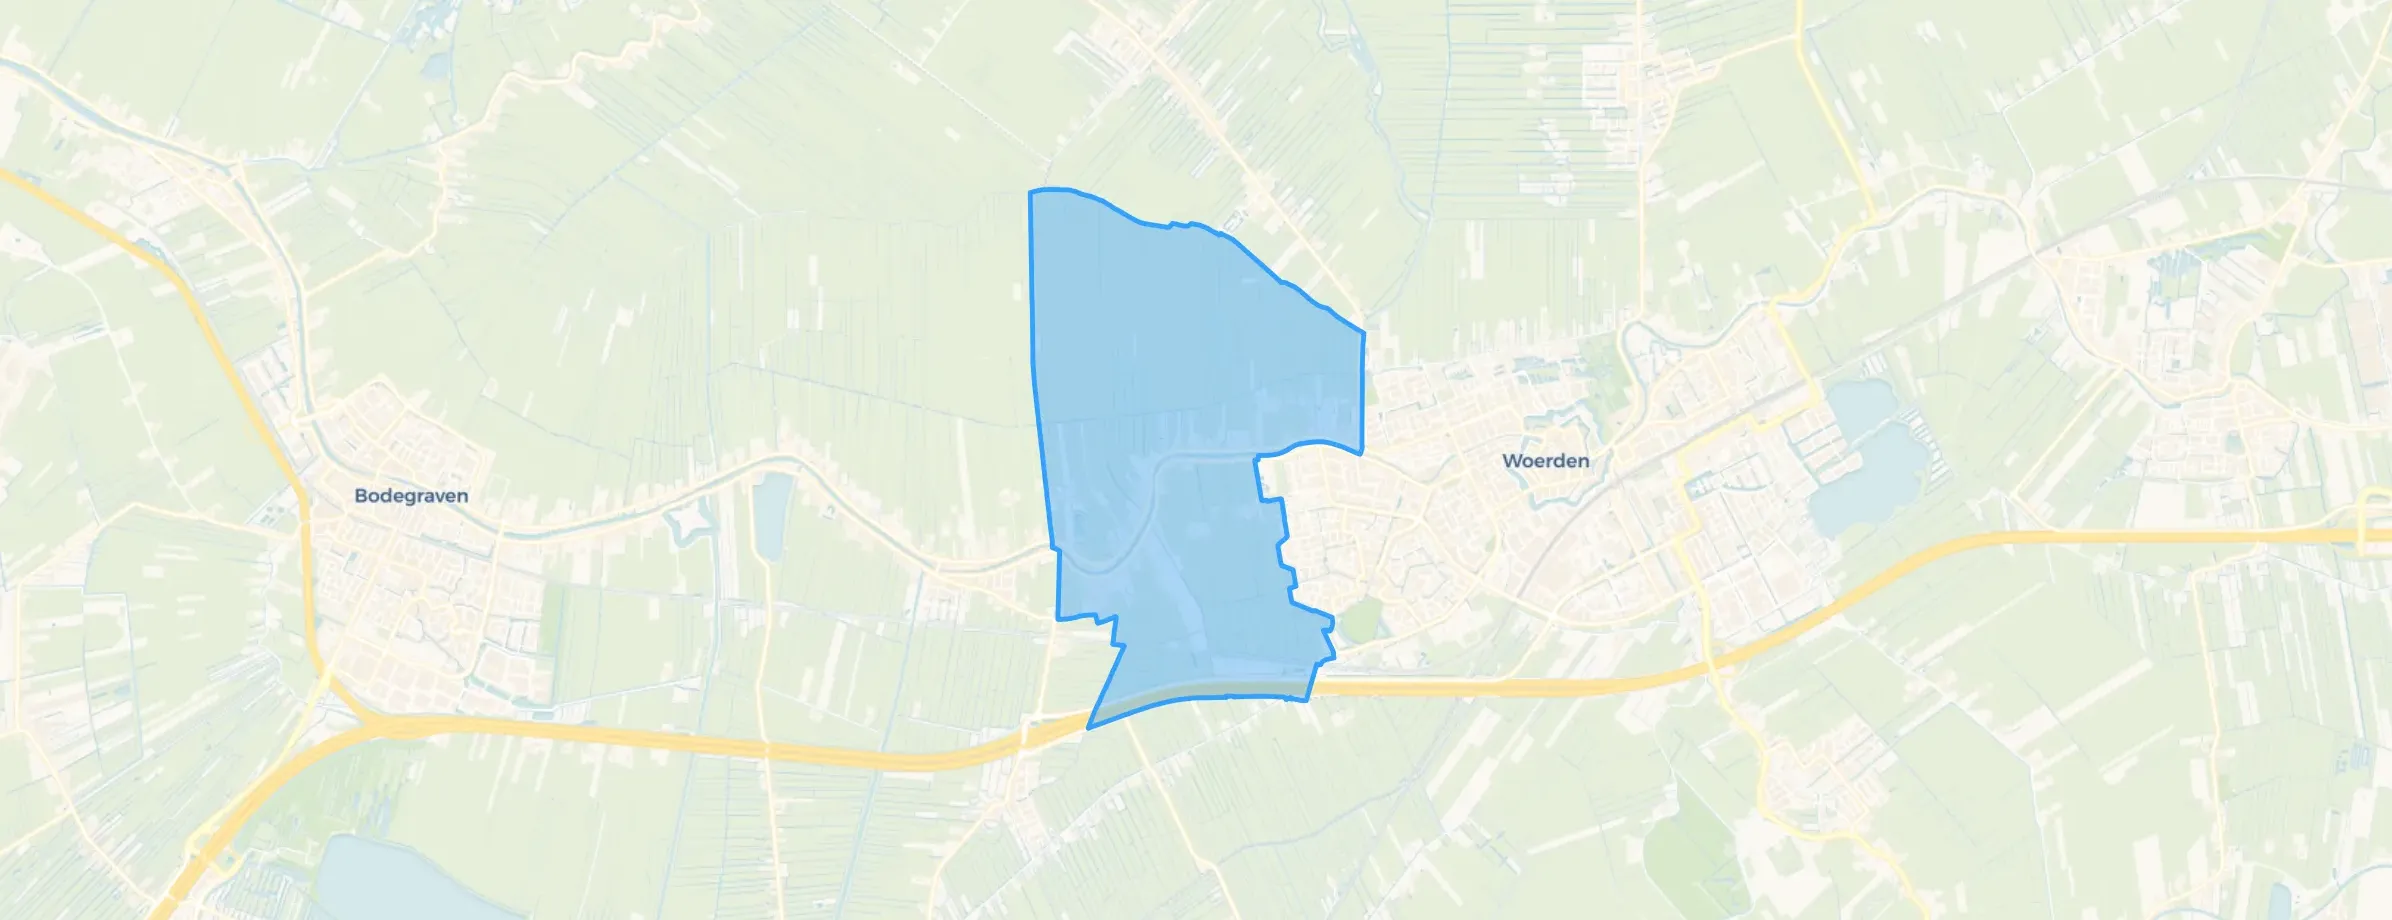
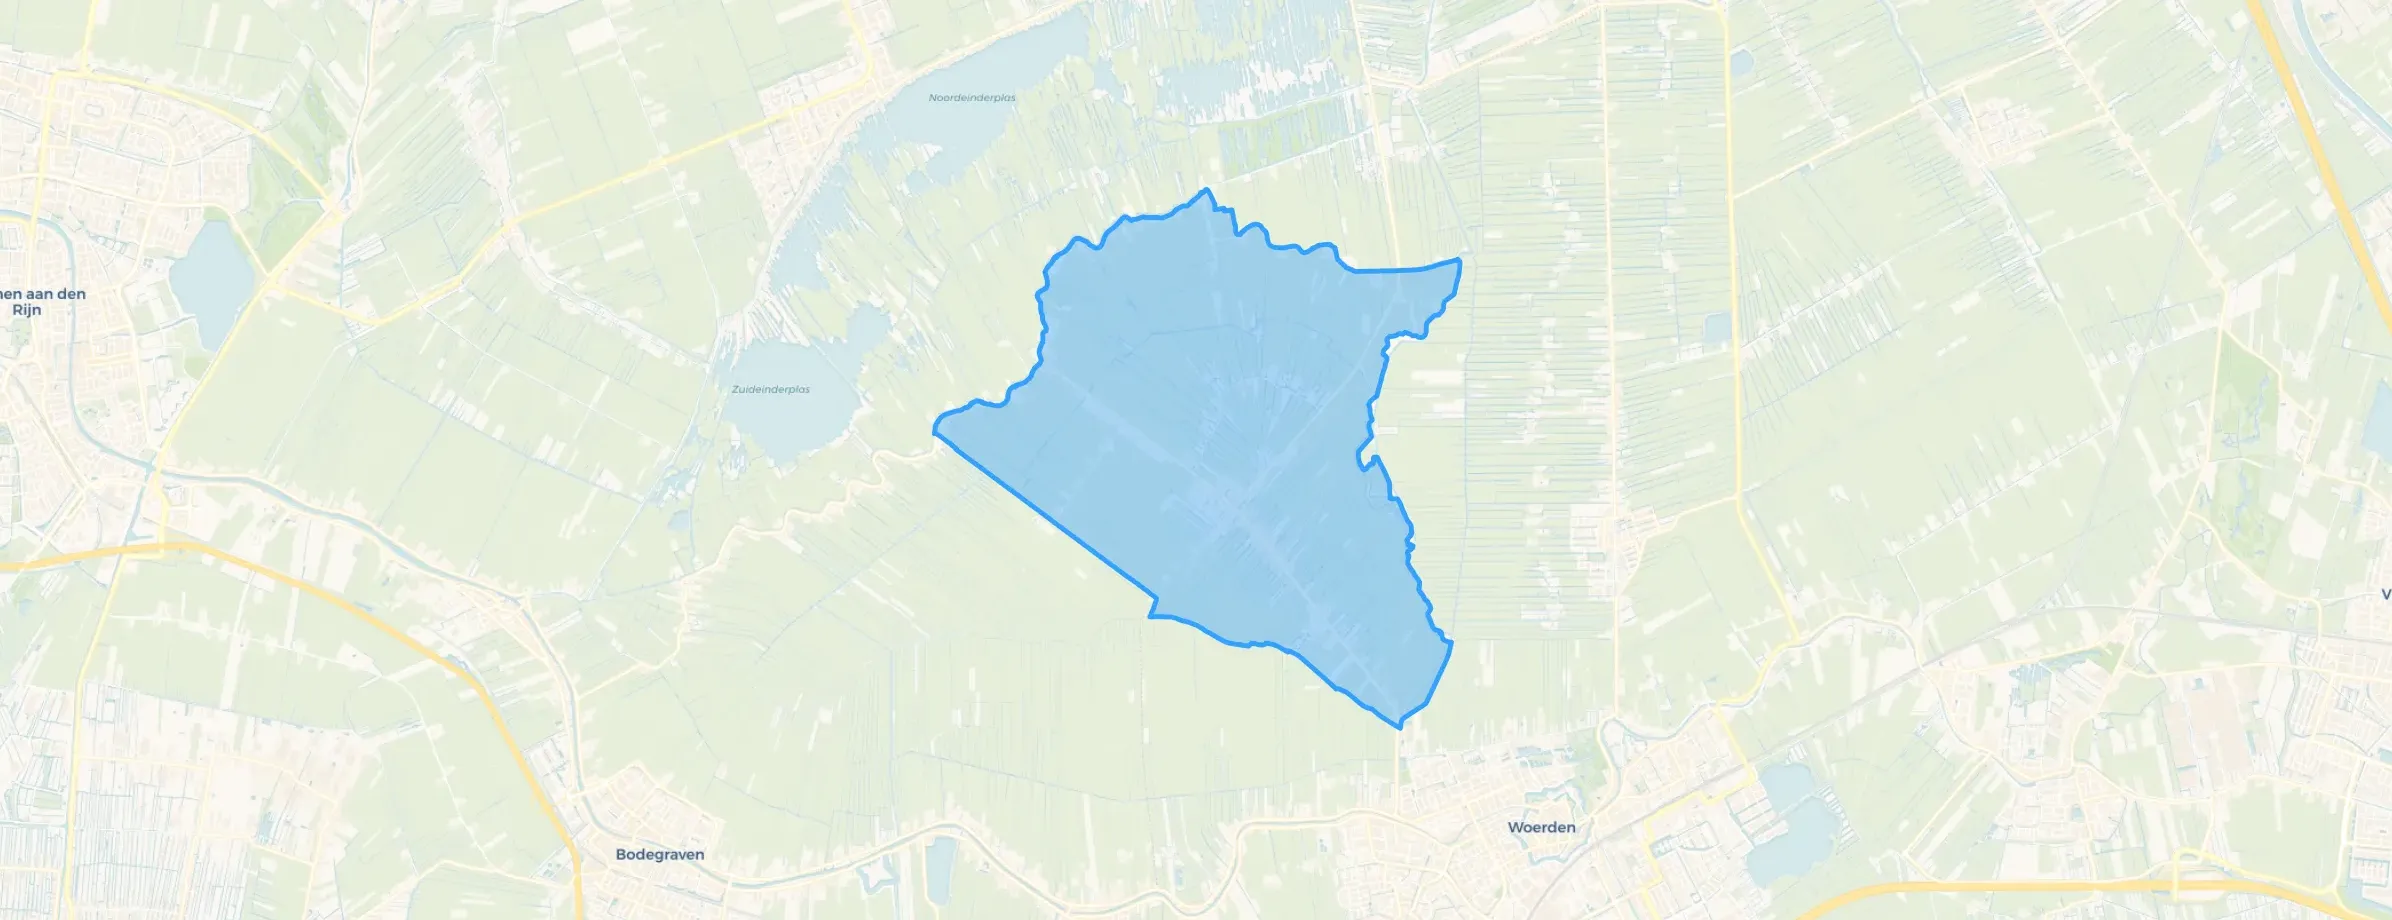
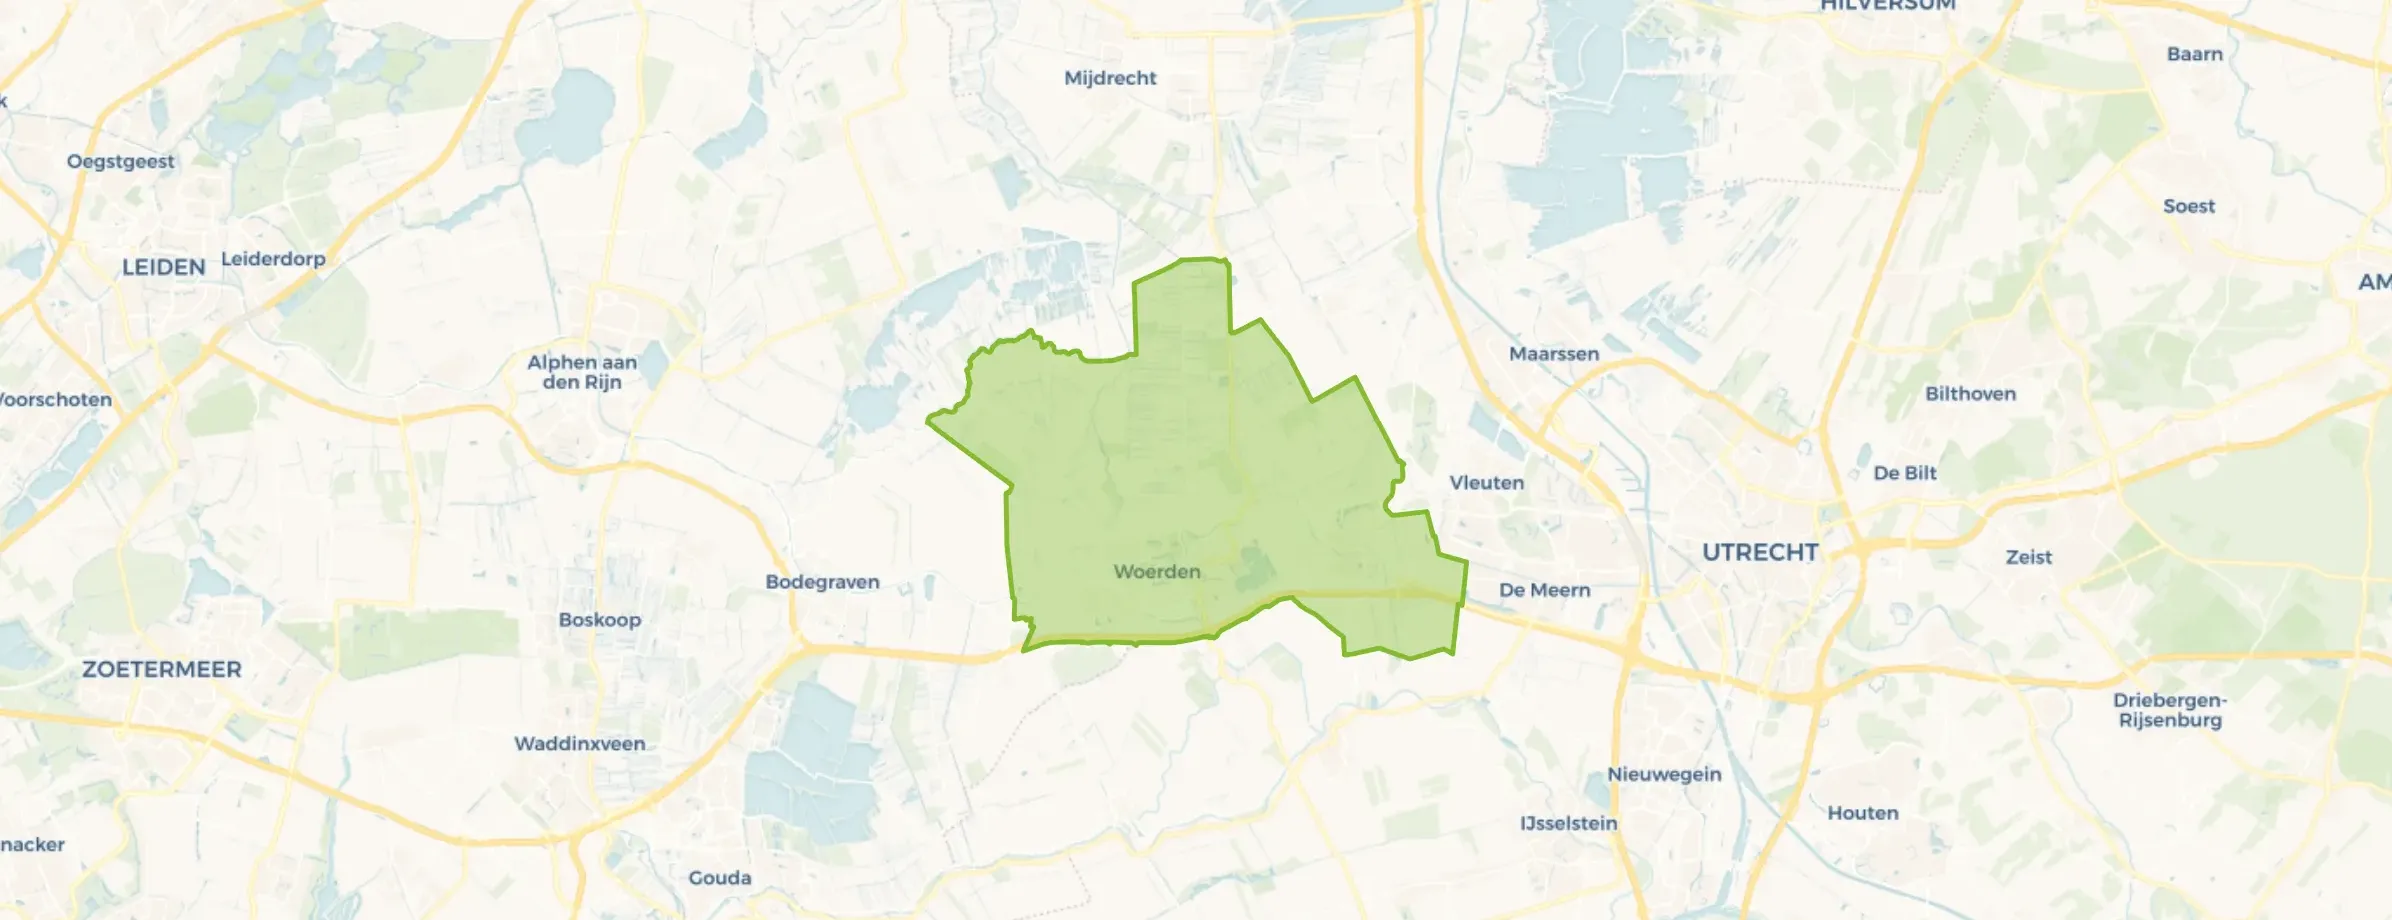
Woerden is located in the province of Utrecht The municipality has a total area of 9.292 hectares, of which 8.855 hectares are land and 437 hectares are water. The municipality is coded as GM0632. The postcode area is 3441AA-3481ZZ.
Woerden has 53.976 residents. Of these, 49,4% are men and 50,6% are women. Most residents are 45 to 65 years (27,2%). The other age groups are 23,7% for '25 to 45 years', 20,5% for '65 years or older', 16,5% for '0 to 15 years' and 12,1% for '15 to 25 years'. Of the residents, 48,9% is unmarried, 39,6% is married, 6,8% is divorced and 4,7% is widowed. 43.499 residents originate from the Netherlands, 2.931 come from Europe and 7.546 come from countries outside Europe.
There are 23.111 households in Woerden. 32,9% of these are single-person households, 30,1% households without children and 37,0% households with children. The average household size is 2,3 persons. The national average is 2,1 persons.
In Woerden there are 43.300 income recipients. The average income per income recipient is €45.800, which is €3.600 (9%) higher than the national average of €42.200. Per resident, the average income is €37.400, which is €2.500 (7%) higher than the national average of €34.900. Most residents of Woerden are educated to an intermediate level. 40,2% have an intermediate education (HAVO, VWO or MBO 2-4), 36,6% have a university or higher professional education (HBO/WO) and 23,2% have a lower education (VMBO or MBO 1).
Of the 53.976 residents, around 76% are in paid employment, which amounts to 41.022 people. This is 4% higher than the national average of 72%. The majority of workers are in salaried employment (83%), while 17% are self-employed. In Woerden, 24% of residents receive a benefit. The largest group is those receiving a state pension (AOW). 9.950 people receive this benefit.
In Woerden there are 23.206 homes with an average assessed value (WOZ) of €435.000. Of these, around 97% are occupied and 3% unoccupied. Most homes are owner-occupied. This amounts to 34% rental homes and 66% owner-occupied homes. Of the homes, 66% privately owned, 23% owned by housing associations and 11% owned by other landlords. The most common construction periods in Woerden are 1970-1980 (18%) and 1980-1990 (18%).
There are currently no homes for sale in Woerden. The most recently listed home is Weegbreeweide 33 by geWOON Marcel. No homes were sold in Woerden over the past year.
There are currently no homes for rent in Woerden. The most recent home is Havenstraat 16A, offered by Interhouse makelaars Utrecht op Funda. No homes were let in Woerden over the past year.
No recent rental data available for Woerden.
In Woerden there are 15.386 addresses with a registered energy label. The most common labels are A (35%), C (21%) and B (18%). On average, an address in Woerden uses 2.600 kWh of electricity per year. This is 2% above the national average of 2.550 kWh. Natural gas consumption, at 820 m³ per year, is 3% above the national average of 800 m³.
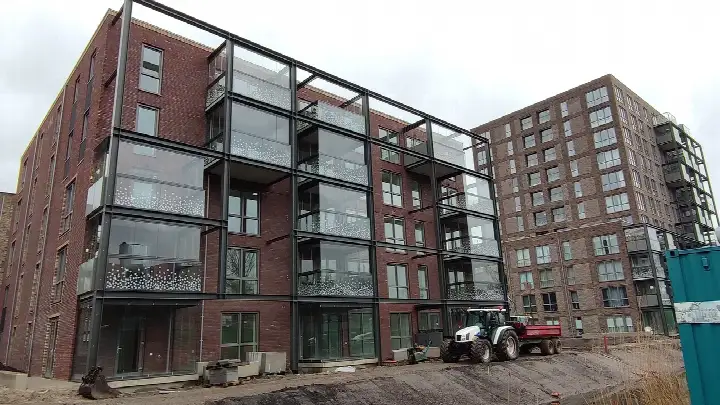
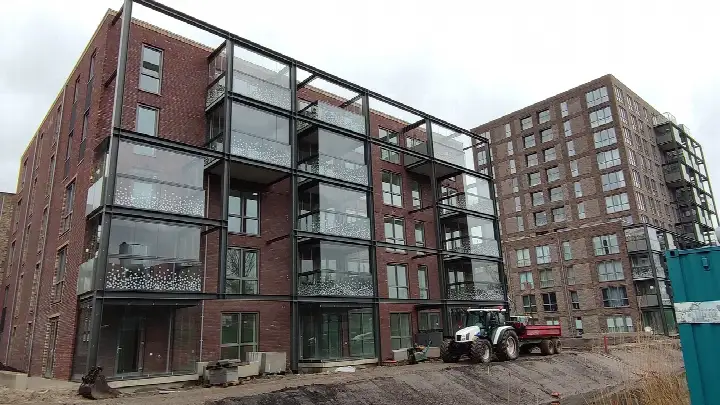
We have been living here with great pleasure for 20 years.
Auto-translated to English by AIGreat, but too few parking spaces in the neighbourhood
Auto-translated to English by AISafe neighbourhood, nice for families.
Auto-translated to English by AIHave lived here for years, everyone is nice and friendly.
Auto-translated to English by AIA cosy, spacious neighbourhood. With good amenities, except for decent shopping facilities. The neighbourhood is green and spacious, pleasant to live in.
Auto-translated to English by AIEveryone smiles at each other, but many small children are starting to arrive who make a racket.
Auto-translated to English by AIA nice neighbourhood to grow up in where everything is close by!
Auto-translated to English by AIThe neighbourhood is very cosy, but some people do cause nuisance. There are plenty of amenities. But I do miss a station. Luckily there is a bus stop.
Auto-translated to English by AIOver the past year a home for sale in Woerden was listed for an average of €587,729 (€4,988 per m²). That is 11% above the Dutch national average. Last quarter prices fell by 5%.
A rental home in Woerden cost an average of €1,652 per month (€17 per m²). That is 23% below the national average.
Residents give Woerden a 8.0 out of 10 based on 20 reviews. The strongest score is for safety (8.3), the weakest for accessibility (7.6).
Gemeente Woerden has 53,976 residents. Many families: 37% of the households have children.
The housing supply in Woerden is remarkably efficient: 67% has an A, A+ or B label. The average natural gas consumption per household is 820 m³ per year.
From Woerden you can on average reach a supermarket at 1.0 km, a GP at 1.1 km, a railway station at 3.0 km, a primary school at 0.7 km (as the crow flies, source: CBS).
Right now you will find 198 homes for sale and 27 homes for rent in Woerden.