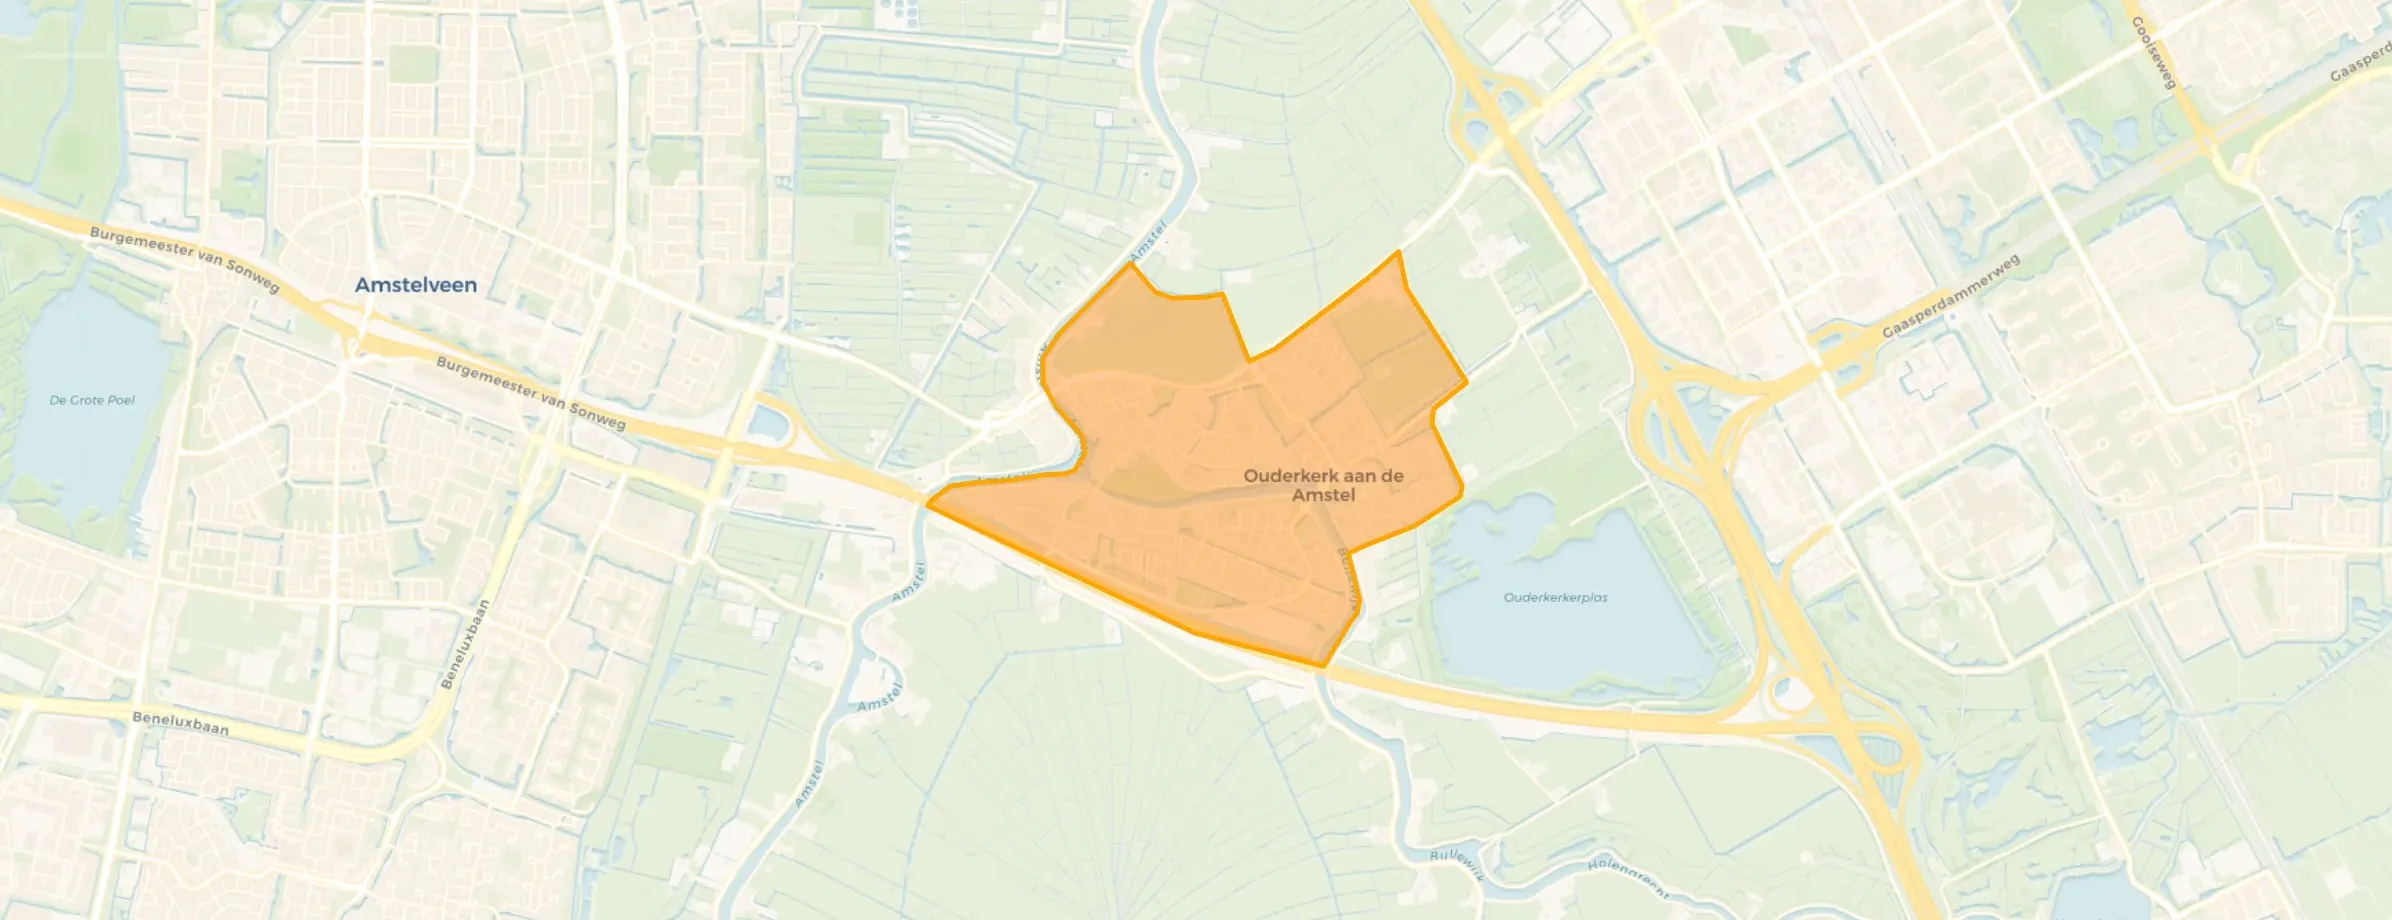
Neighbourhood in Ouder-Amstel
Ouderkerk aan de Amstel is located in the province of Noord-Holland, in the municipality of Ouder-Amstel, in the district Wijk 00 The neighbourhood has a total area of 221 hectares, of which 206 hectares are land and 16 hectares are water. The neighbourhood is coded as BU04370000. The postcode area is 1191AA-1191WM.
Eight residents rate the neighbourhood as good with a score of 7.8. They describe it as 'Small', '.' and 'Fun and always cosy'. Residents are positive about the neighbourhood: nearly all aspects score well. In particular, safety, education, cleanliness are seen as strong points.
Ouderkerk aan de Amstel has 8.245 residents. Of these, 48,4% are men and 51,5% are women. Most residents are 45 to 65 years (29,8%). The other age groups are 23,2% for '65 years or older', 18,5% for '25 to 45 years', 17,4% for '0 to 15 years' and 11,2% for '15 to 25 years'. Of the residents, 47,7% is unmarried, 40,5% is married, 6,5% is divorced and 5,3% is widowed. 6.015 residents originate from the Netherlands, 800 come from Europe and 1.430 come from countries outside Europe.
There are 3.445 households in Ouderkerk aan de Amstel. 29,9% of these are single-person households, 29,5% households without children and 40,6% households with children. The average household size is 2,4 persons.
In Ouderkerk aan de Amstel there are 6.500 income recipients. The average income per income recipient is €51.500, which is €15.700 (44%) higher than the national average of €35.800. Per resident, the average income is €41.300, which is €12.100 (41%) higher than the national average of €29.200. Most residents of Ouderkerk aan de Amstel are highly educated. 46,6% have a university or higher professional education (HBO/WO), 35,1% have an intermediate education (HAVO, VWO or MBO 2-4) and 18,4% have a lower education (VMBO or MBO 1).
Of the 8.245 residents, around 66% are in paid employment, which amounts to 5.442 people. This is 1% higher than the national average of 65%. The majority of workers are in salaried employment (79%), while 21% are self-employed. In Ouderkerk aan de Amstel, 25% of residents receive a benefit. The largest group is those receiving a state pension (AOW). 1.700 people receive this benefit.
In Ouderkerk aan de Amstel there are 3.502 homes with an average assessed value (WOZ) of €619.000. Of these, around 96% are occupied and 4% unoccupied. Most homes are owner-occupied. This amounts to 37% rental homes and 63% owner-occupied homes. Of the homes, 63% privately owned, 30% owned by housing associations and 7% owned by other landlords. The most common construction periods in Ouderkerk aan de Amstel are 1950-1970 (24%) and 1980-1990 (20%).
There are currently 28 homes for sale in Ouderkerk aan de Amstel. The most recently listed home is Prins Hendrikstraat 10 by B.V. Deltam Makelaardij o.g.. Over the past year, 65 homes were sold in Ouderkerk aan de Amstel. On average, a home was sold within 42 days.
The average asking price for a home for sale in Ouderkerk aan de Amstel over the past year was €960.785. This is 55% higher than the average assessed value (WOZ) of €619.000. The average asking price per m² of plot is €6.626.
There are 6 homes for rent in Ouderkerk aan de Amstel. The most recent home is Dorpsstraat 36A, offered by A1 Executive Estate op Funda. Over the past year, 66 homes were let in Ouderkerk aan de Amstel. On average, a listing was let within 30 days.
The average rent for a rental home in Ouderkerk aan de Amstel over the past year was €2.201 per month. Per m² of plot area that is €29 per month.
In Ouderkerk aan de Amstel there are 3.532 addresses with a registered energy label. The most common labels are C (33%), A (26%) and B (22%). On average, an address in Ouderkerk aan de Amstel uses 2.880 kWh of electricity per year. This is 2% above the national average of 2.810 kWh. With an annual consumption of 1.060 m³ per address, natural gas consumption is 17% below the national average of 1.280 m³.
Small neighbourhood. Different types of houses. Nice people living there. The community is not very large/good. In terms of safety, it could be improved by placing more lampposts. Accessibility is also minimal due to a shortage of parking spaces sometimes.
Auto-translated to English by AI.
Auto-translated to English by AIThat there are many children living here and it is always cosy and certainly very safe
Auto-translated to English by AII've lived there for a very long time and almost nothing strange has ever happened
Auto-translated to English by AIIt is a relatively new neighbourhood, about 10 years old. It is quiet and child-friendly, and there is a primary school within walking distance. Furthermore, there are allotment gardens nearby, which bring cosiness and nature. There is also a nursing home for the elderly and senior housing close by. Seniors generally do not cause any nuisance. There are not very many dog owners, and most of those who are there clean up the poop. There are underground waste containers, and organic waste is collected separately via wheelie bins. Also not far from here is the municipal waste depot where people can dispose of bulky waste, so that kind of rubbish is not found on the streets. A downside is that public transport is not nearby. An artisan bakery is close by, as well as two churches. Those churches can of course cause a bit of nuisance on Sundays, but it's only a quarter of an hour that the church bells ring.
Auto-translated to English by AIThe neighbourhood is quiet, child-friendly and safe. There is a primary school a stone's throw away. There are also allotment gardens nearby, which bring cosiness and nature. It is clean and the greenery is well maintained.
Auto-translated to English by AIAs a born and bred Amsterdammer, this is the place to live if you crave peace and quiet and also want to be close to the city. It offers many opportunities in terms of space, being able to park your car, public transport, and the sense of community of a village. Authentic and close to other villages such as Abcoude, Amstelveen and Buitenveldert.
Auto-translated to English by AI-nice and close to Amsterdam -but still a village just too many cyclists
Auto-translated to English by AIThe housing stock is relatively young — 58% dates from after 1990. In addition, the most common type is terraced houses (44%).
Over the past year a home for sale in Ouderkerk aan de Amstel was listed for an average of €880,130 (€5,956 per m²).
A rental home in Ouderkerk aan de Amstel cost an average of €2,524 per month (€27 per m²).
Residents give Ouderkerk aan de Amstel a 7.8 out of 10 based on 8 reviews. The strongest score is for safety (8.8), the weakest for amenities (7.1).
Buurt Ouderkerk aan de Amstel has 8,245 residents. The largest age group is 45 to 65 years (30%). Many families: 41% of the households have children.
The housing supply in Ouderkerk aan de Amstel is remarkably efficient: 75% has an A, A+ or B label. The average natural gas consumption per household is 1,060 m³ per year.
From Ouderkerk aan de Amstel you can on average reach a supermarket at 0.7 km, a GP at 1.0 km, a railway station at 4.2 km, a primary school at 0.6 km (as the crow flies, source: CBS).
Right now you will find 33 homes for sale and 6 homes for rent in Ouderkerk aan de Amstel.







