Neighbourhood in Goeree-Overflakkee
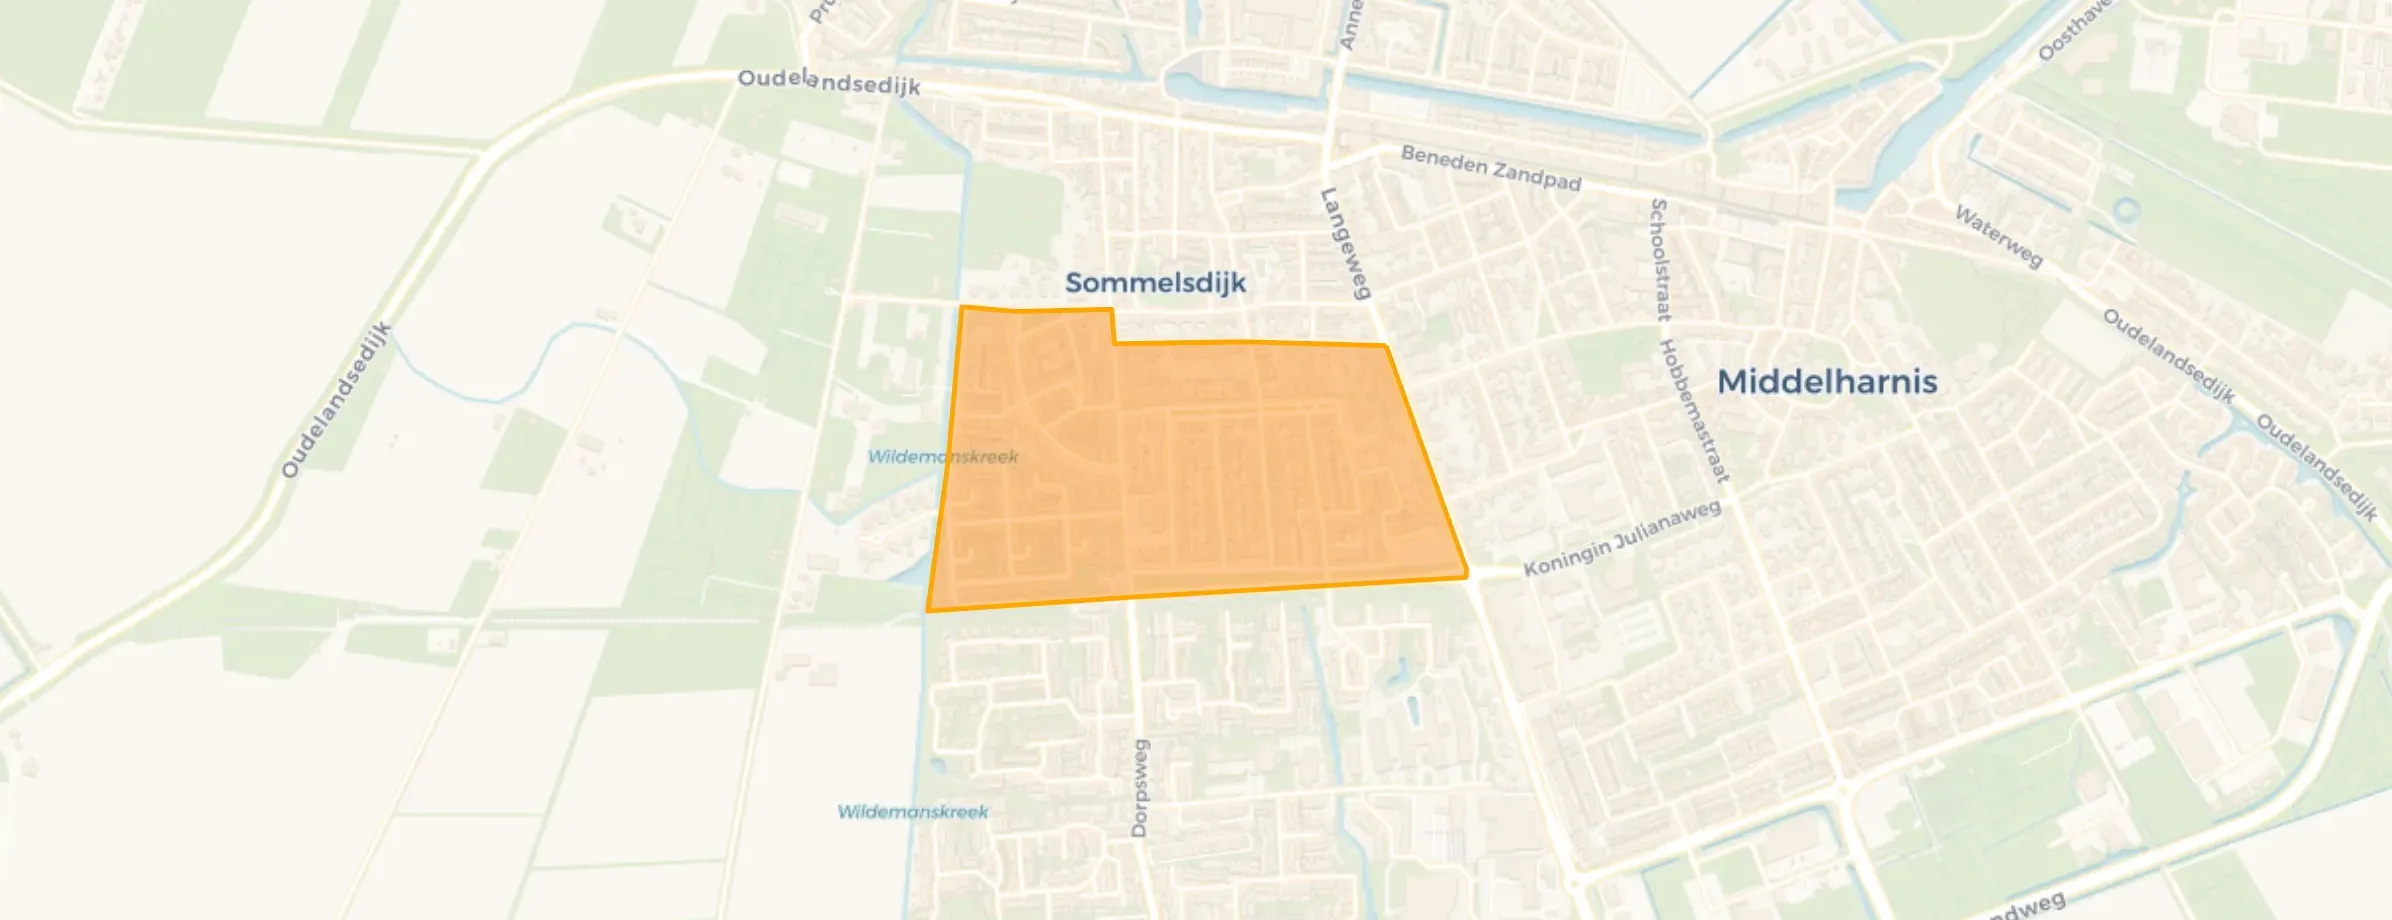
Sommelsdijk bloemenbuurt is located in the province of Zuid-Holland, in the municipality of Goeree-Overflakkee, in the district Sommelsdijk The neighbourhood has a total area of 28 hectares, of which 28 hectares are land and 0 hectares are water. The neighbourhood is coded as BU19241002. The postcode area is 3245BR-3245XX.
Three residents rate the neighbourhood as very good with a score of 8.7. They describe it as 'Pleasantly quiet', 'Pleasant quiet living' and 'Safe and familiar'. Residents are positive about the neighbourhood: nearly all aspects score well. In particular, safety, cleanliness, education are seen as strong points.
Sommelsdijk bloemenbuurt has 1.600 residents. Of these, 46,3% are men and 54,1% are women. Most residents are 65 years or older (28,1%). The other age groups are 25,0% for '25 to 45 years', 24,1% for '45 to 65 years', 13,4% for '0 to 15 years' and 9,7% for '15 to 25 years'. Of the residents, 40,0% is unmarried, 43,8% is married, 10,6% is divorced and 5,9% is widowed. 1.425 residents originate from the Netherlands, 40 come from Europe and 140 come from countries outside Europe.
There are 785 households in Sommelsdijk bloemenbuurt. 38,9% of these are single-person households, 35,0% households without children and 26,1% households with children. The average household size is 2,0 persons. The national average is 2,1 persons.
In Sommelsdijk bloemenbuurt there are 1.300 income recipients. The average income per income recipient is €34.800, which is €7.400 (18%) lower than the national average of €42.200. Per resident, the average income is €29.000, which is €5.900 (17%) lower than the national average of €34.900. Most residents of Sommelsdijk bloemenbuurt are educated to an intermediate level. 50,0% have an intermediate education (HAVO, VWO or MBO 2-4), 31,4% have a lower education (VMBO or MBO 1) and 18,6% have a university or higher professional education (HBO/WO).
Of the 1.600 residents, around 67% are in paid employment, which amounts to 1.072 people. This is 5% lower than the national average of 72%. The majority of workers are in salaried employment (88%), while 12% are self-employed. In Sommelsdijk bloemenbuurt, 33% of residents receive a benefit. The largest group is those receiving a state pension (AOW). 410 people receive this benefit.
In Sommelsdijk bloemenbuurt there are 834 homes with an average assessed value (WOZ) of €291.000. Of these, around 97% are occupied and 3% unoccupied. Most homes are rental properties. This amounts to 63% rental homes and 37% owner-occupied homes. Of the homes, 37% privately owned, 60% owned by housing associations and 3% owned by other landlords. The most common construction periods in Sommelsdijk bloemenbuurt are 1950-1970 (41%) and 1970-1980 (18%).
There are currently 5 homes for sale in Sommelsdijk bloemenbuurt. The most recently listed home is Kortewegje 40 by Tanis & Akershoek Makelaardij. Over the past year, 23 homes were sold in Sommelsdijk bloemenbuurt. On average, a home was sold within 79 days.
The average asking price for a home for sale in Sommelsdijk bloemenbuurt over the past year was €491.457. This is 69% higher than the average assessed value (WOZ) of €291.000. The average asking price per m² of plot is €4.095.
There are currently no homes for rent in Sommelsdijk bloemenbuurt. The most recent home is Groene Zoom 46, offered by Oost West Wonen. Over the past year, 1 homes were let in Sommelsdijk bloemenbuurt. On average, a listing was let within 7 days.
No recent rental data available for Sommelsdijk bloemenbuurt.
In Sommelsdijk bloemenbuurt there are 618 addresses with a registered energy label. The most common labels are C (30%), D (14%) and A+ (13%). On average, an address in Sommelsdijk bloemenbuurt uses 2.370 kWh of electricity per year. This is 7% below the national average of 2.550 kWh. With an annual consumption of 750 m³ per address, natural gas consumption is 6% below the national average of 800 m³.
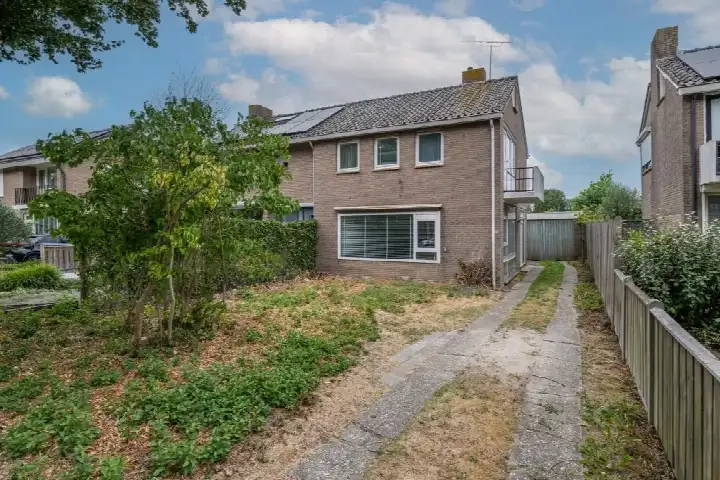
Wonderfully free and quiet living, although the neighbourhood is deteriorating a bit due to the upkeep of the gardens. This is because fellow countrymen come to live here and they find jungles beautiful.
Auto-translated to English by AILovely neighbourhood, nice and quiet
Auto-translated to English by AINice and quiet to live, street recently renovated only the parking spaces are bad. Addressed the municipality, they are dangerous, you sprain your legs. Otherwise fine living here.
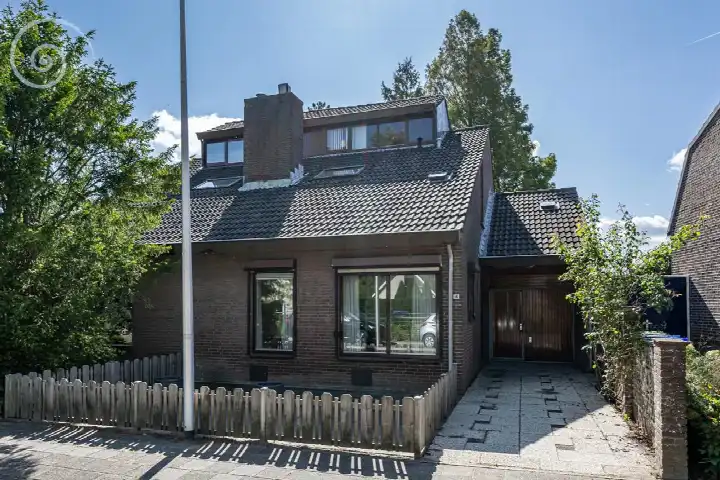
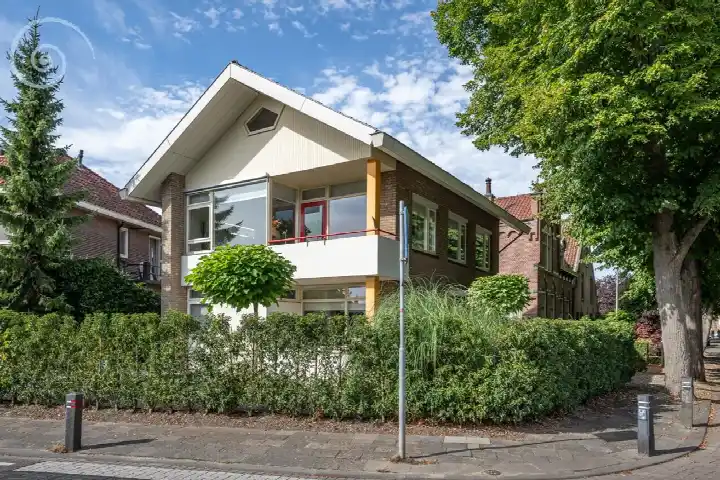
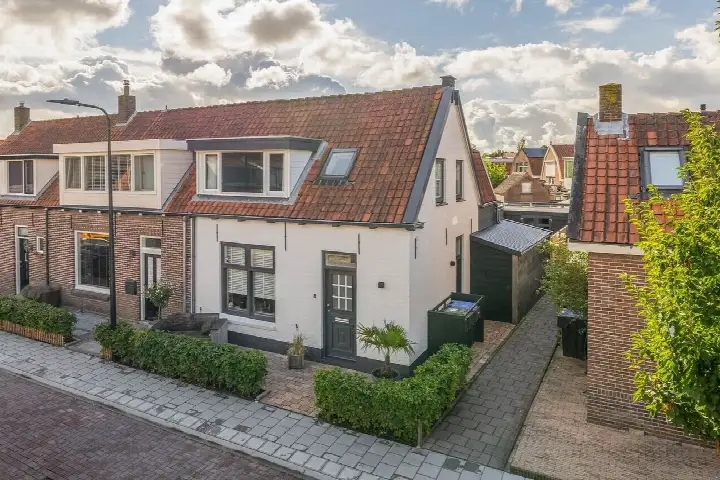
Auto-translated to English by AIThe housing stock is mainly post-war — 64% was built between 1945 and 1990. In addition, the most common type is terraced houses (46%).
Over the past year a home for sale in Sommelsdijk bloemenbuurt was listed for an average of €486,595 (€3,699 per m²).
Residents give Sommelsdijk bloemenbuurt a 8.7 out of 10 based on 3 reviews. Safety stands out with a 9.3; community lags behind with a 8.0.
A considerable share of the supply in Sommelsdijk bloemenbuurt is less efficient: 32% has an E, F or G label. The average natural gas consumption per household is 750 m³ per year.
From Sommelsdijk bloemenbuurt you can on average reach a supermarket at 0.3 km, a GP at 0.7 km, a railway station at 39.1 km, a primary school at 0.4 km (as the crow flies, source: CBS).