District in Baarn
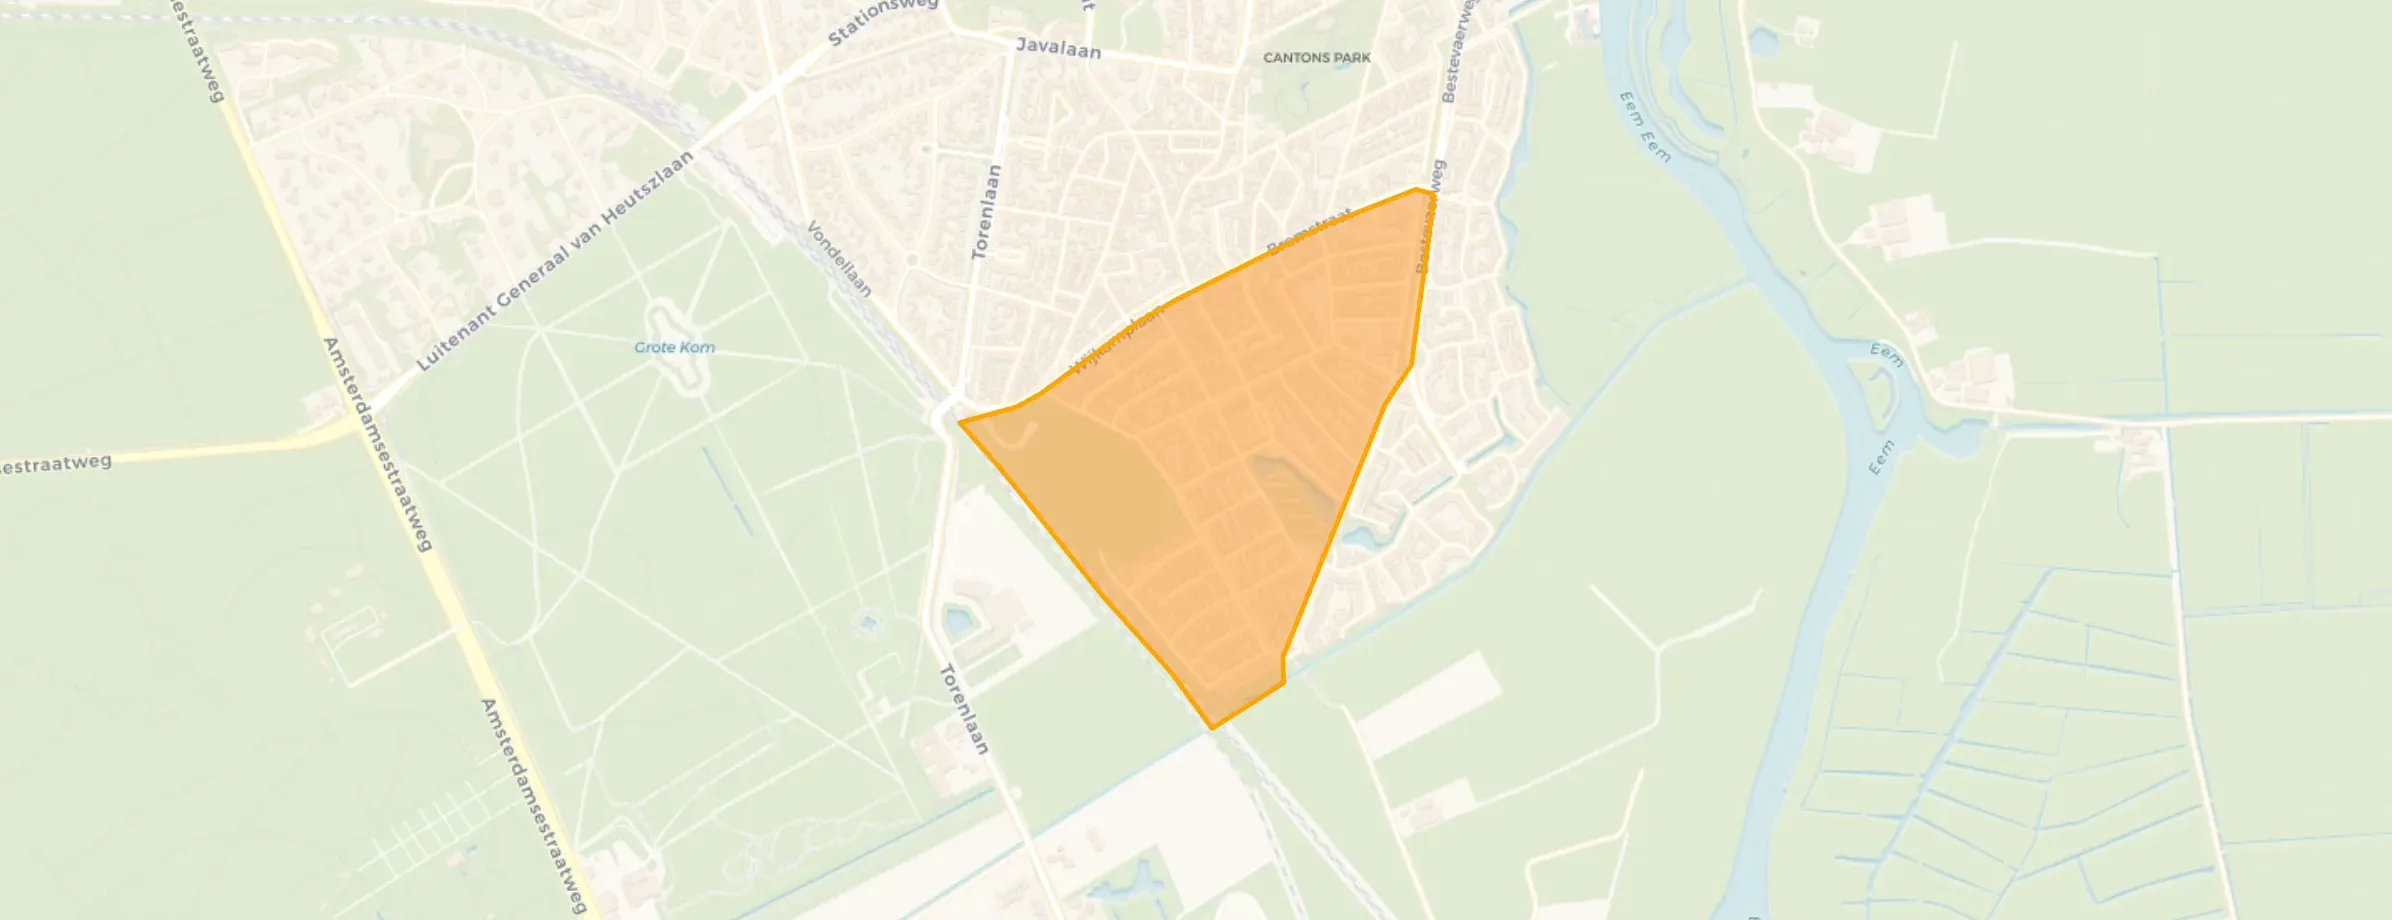
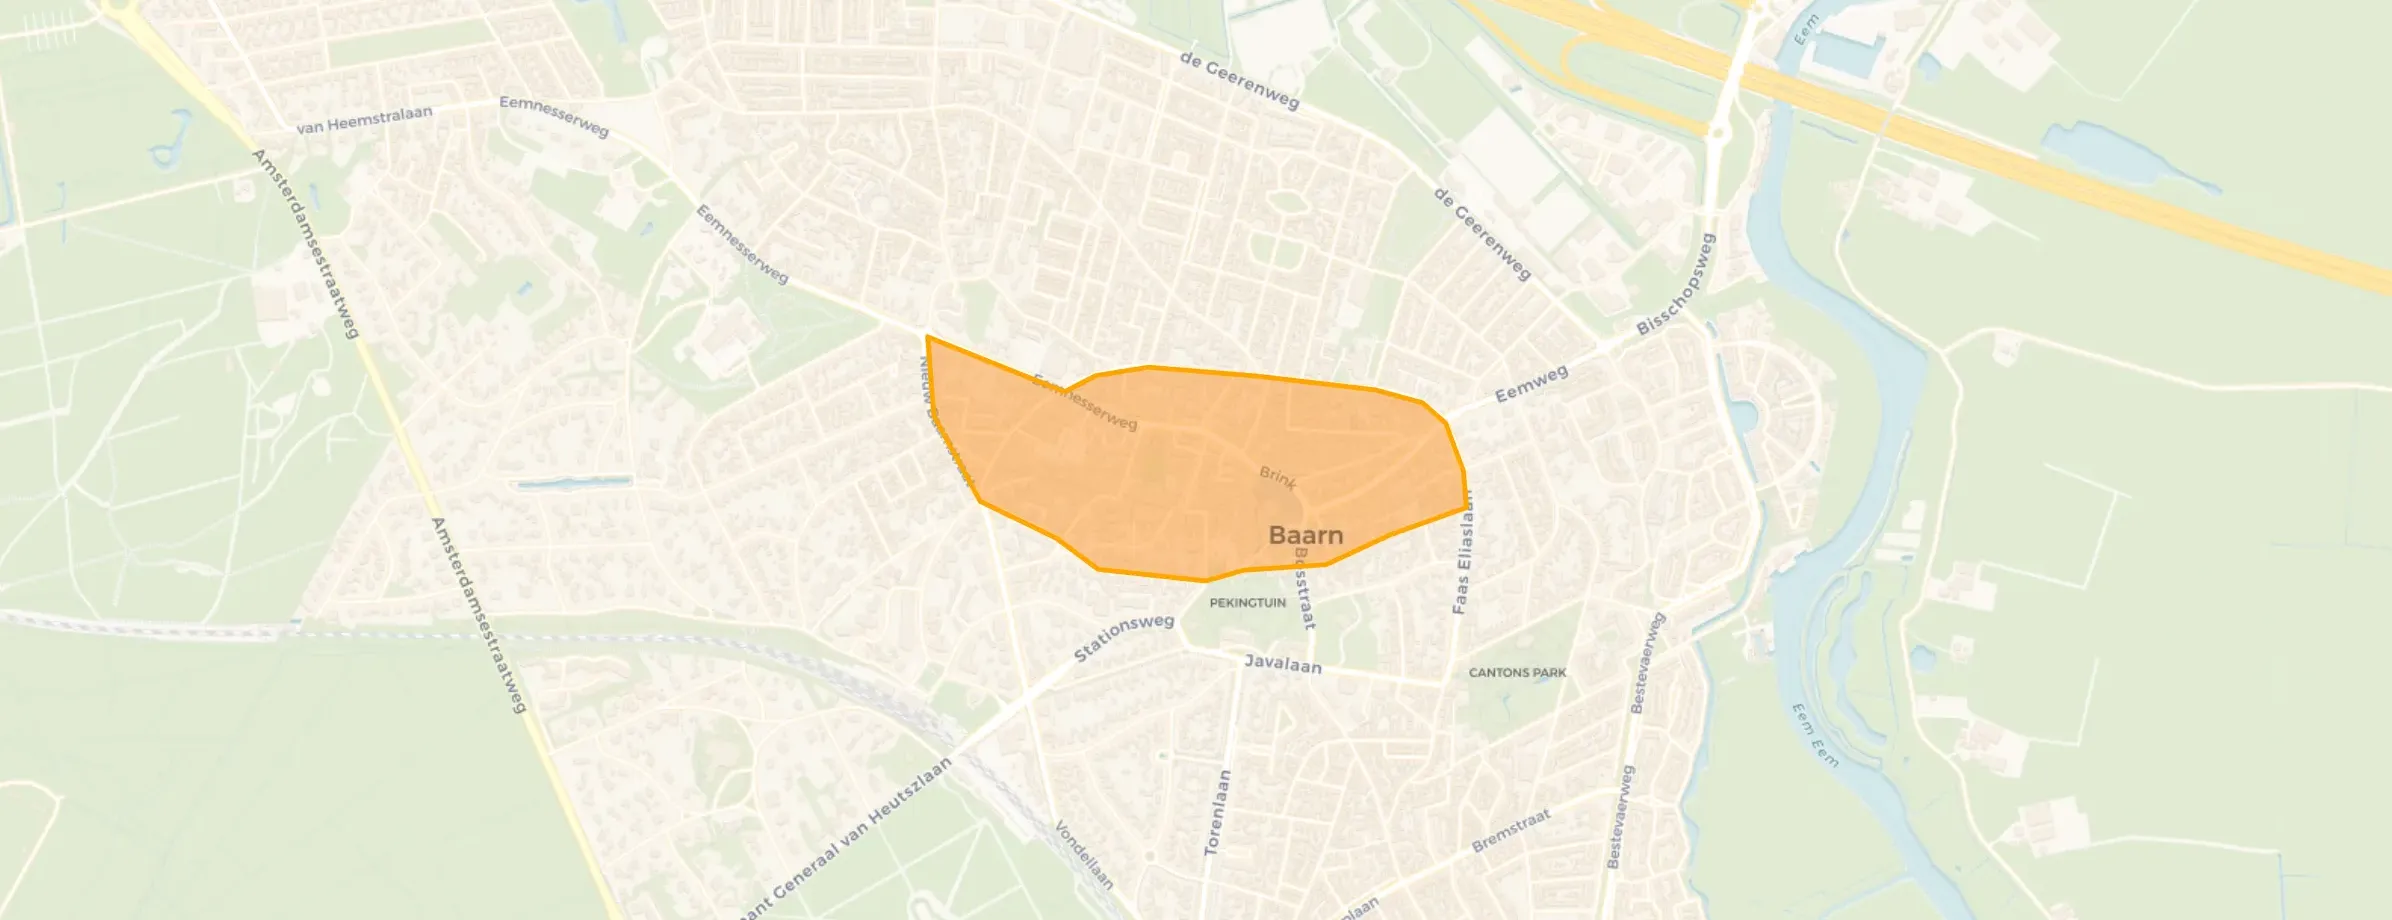
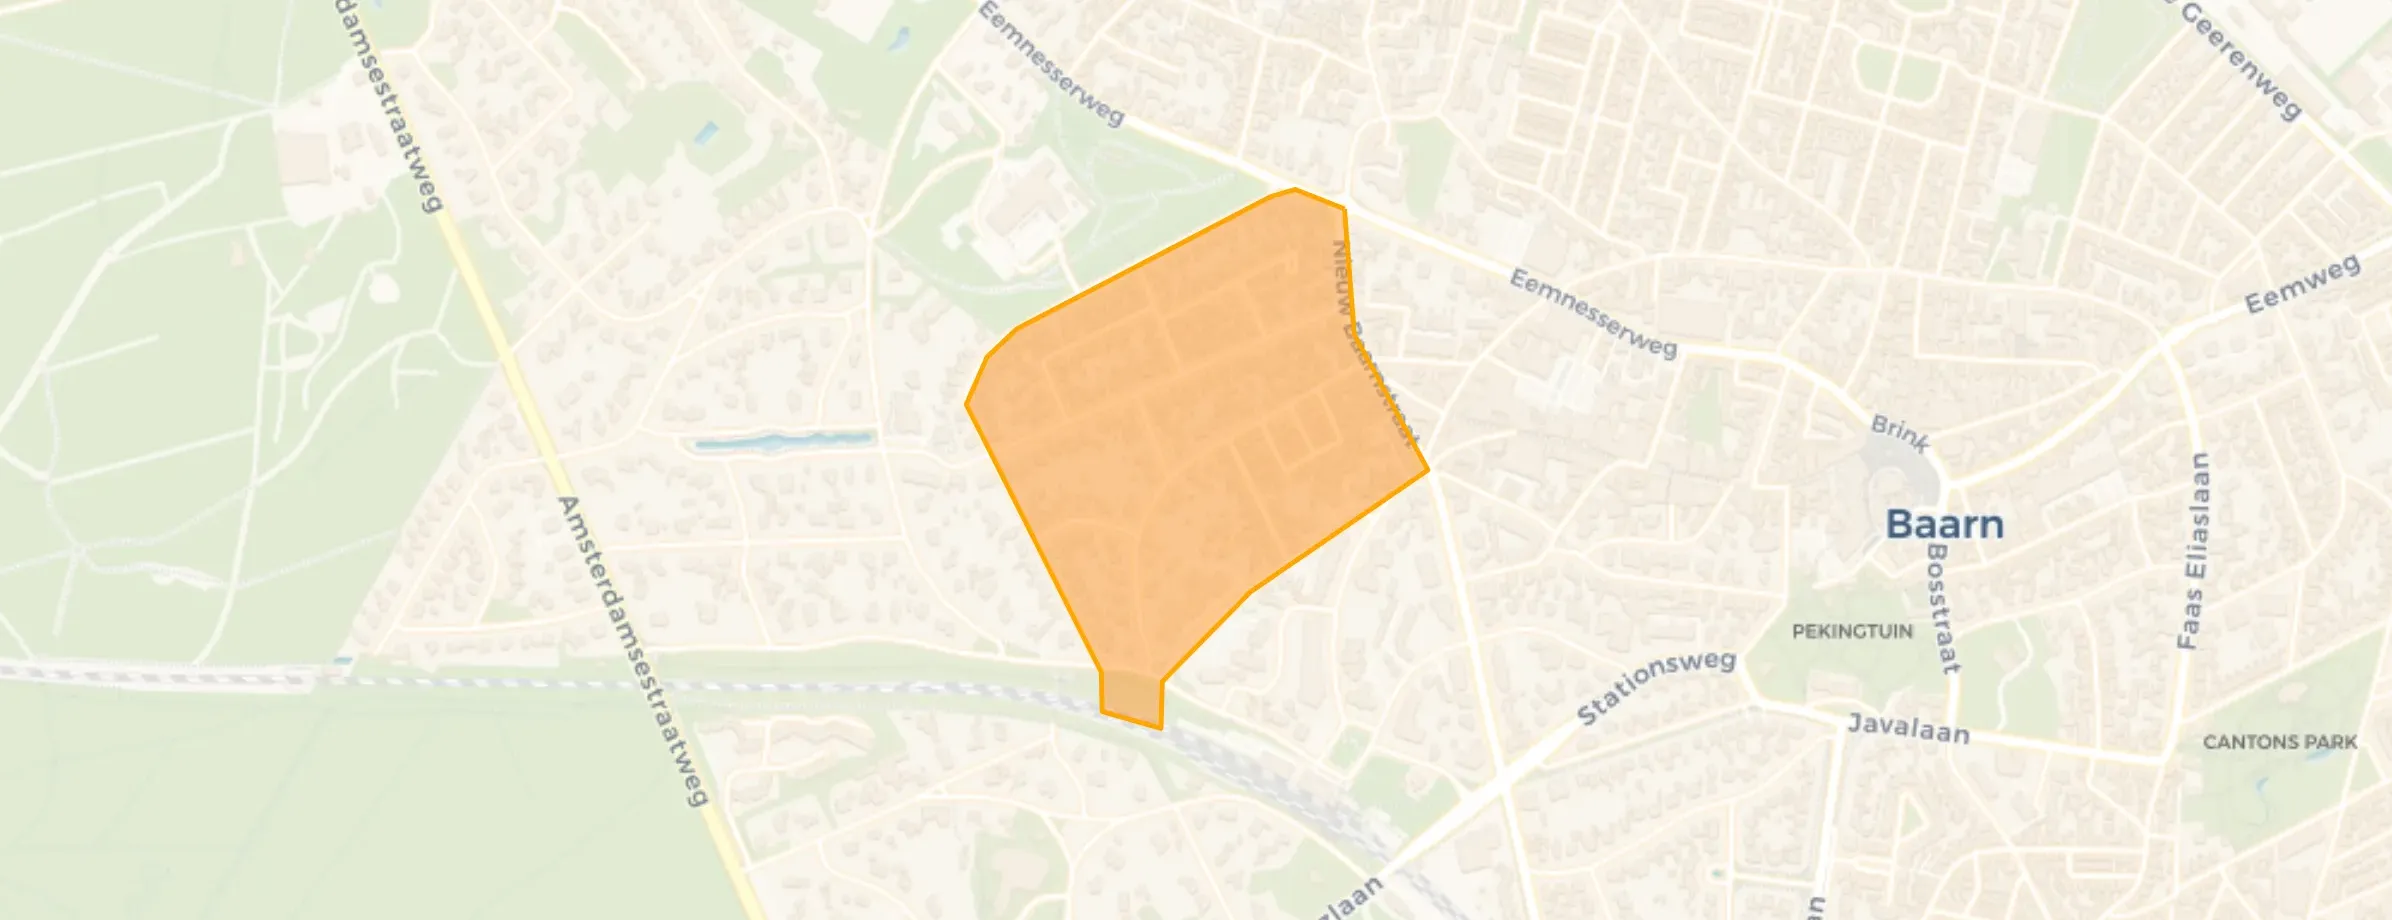
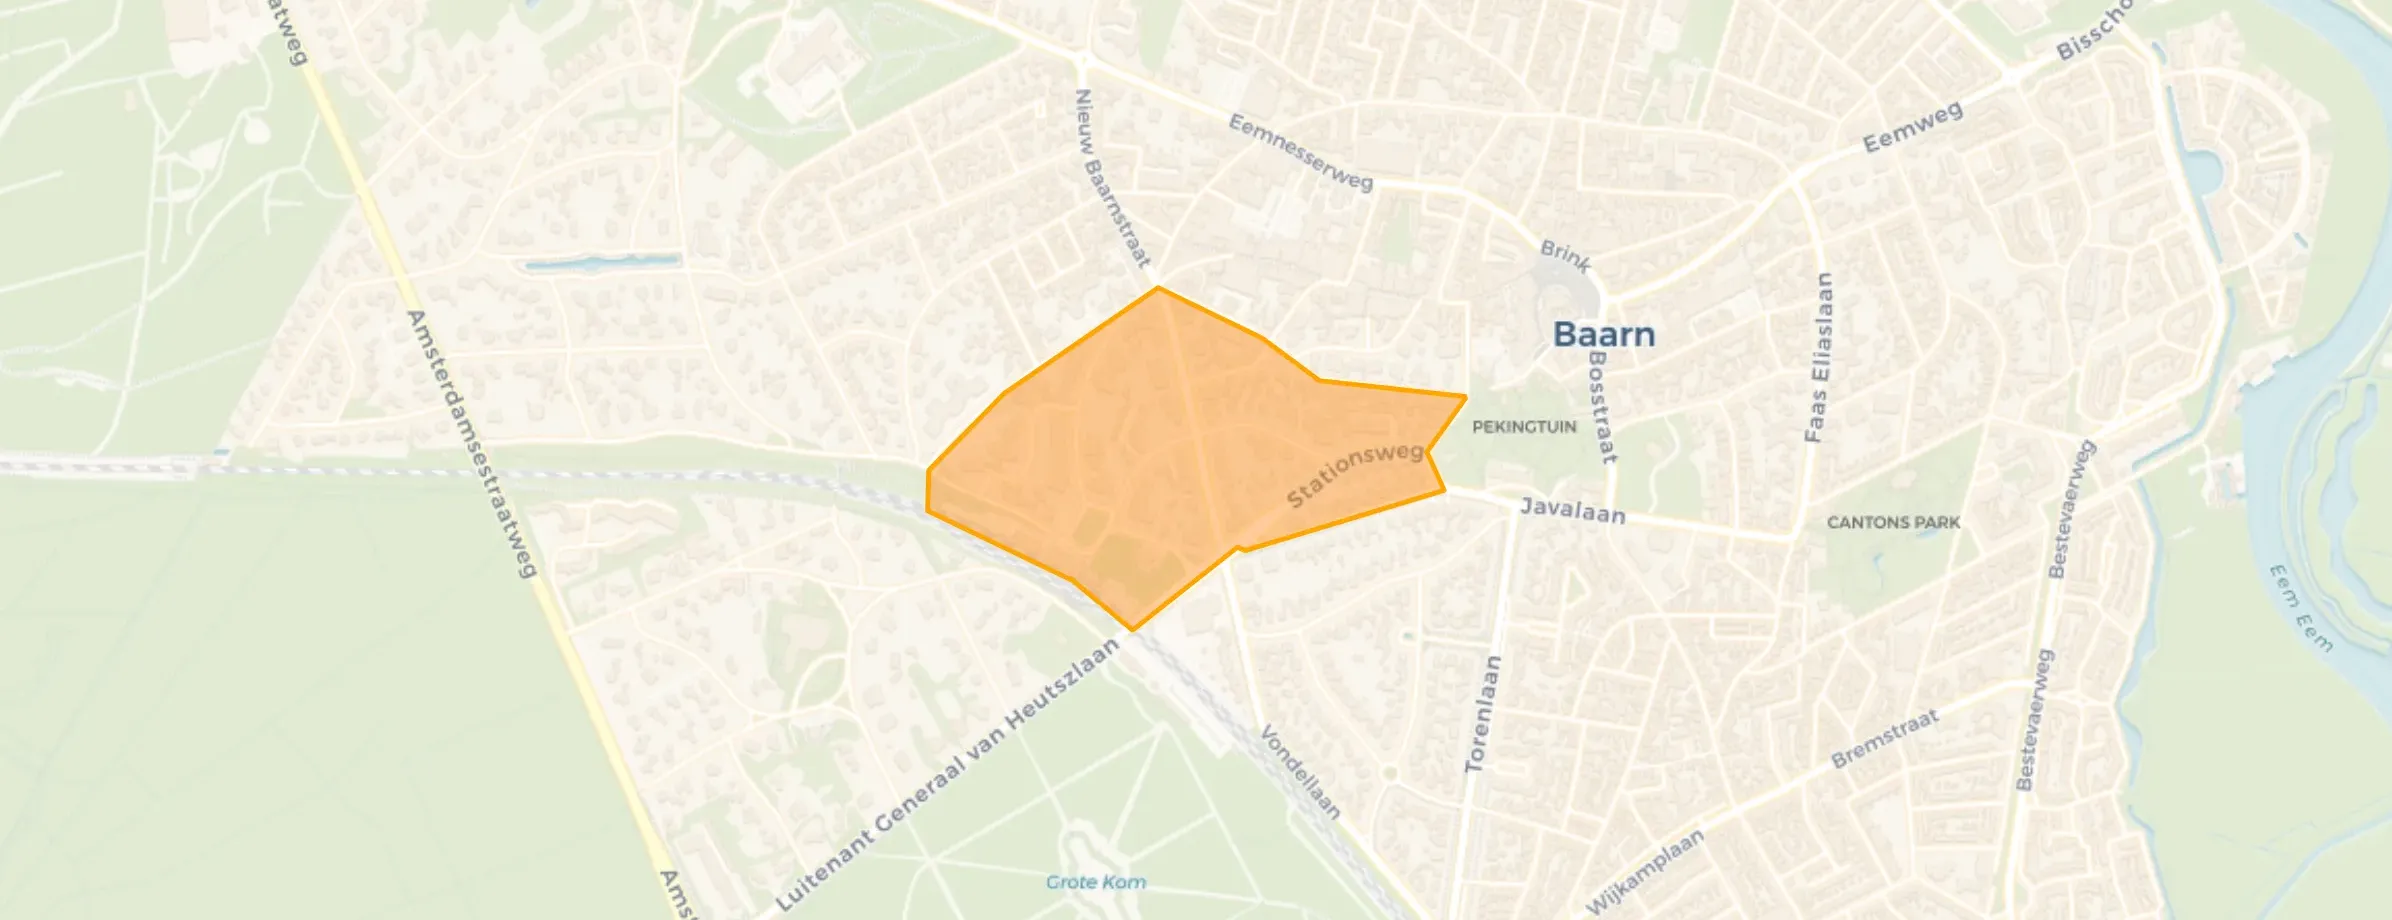
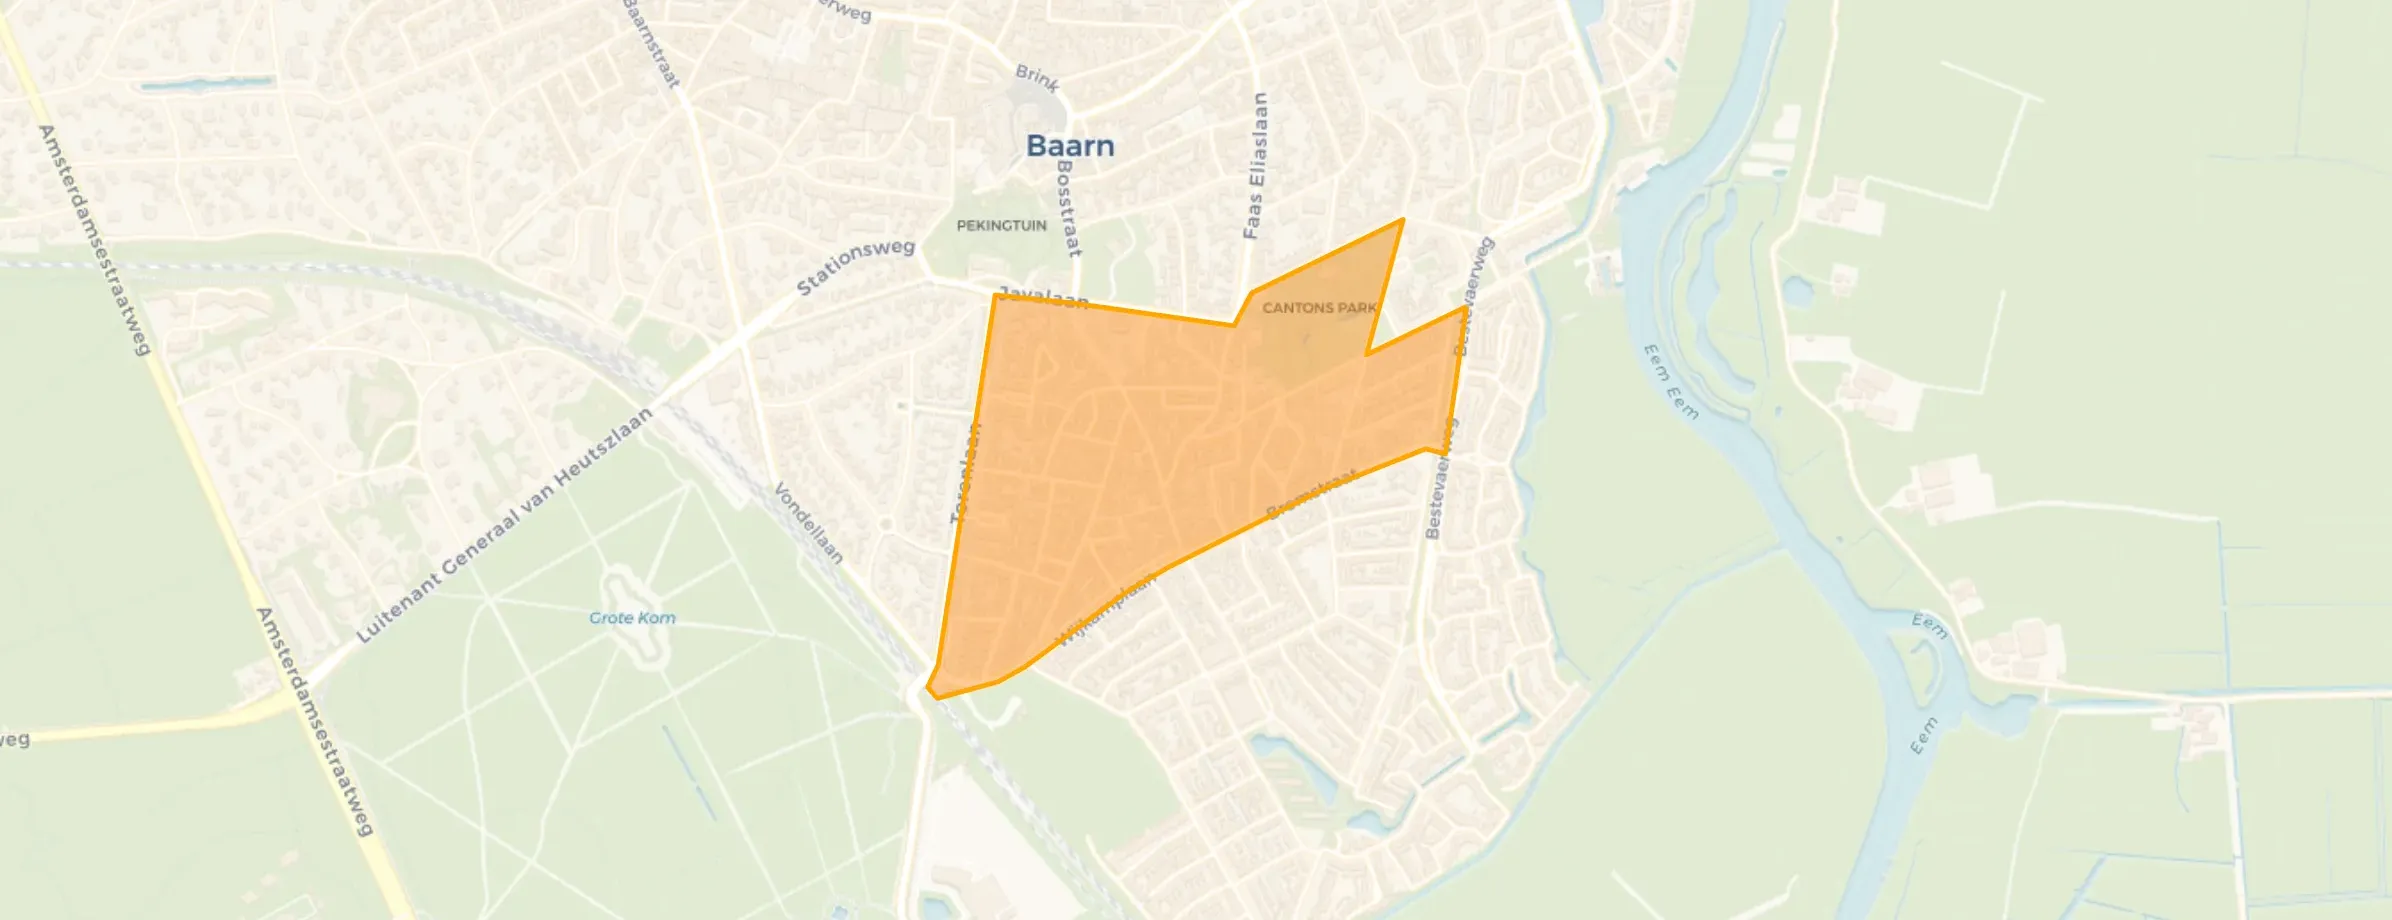
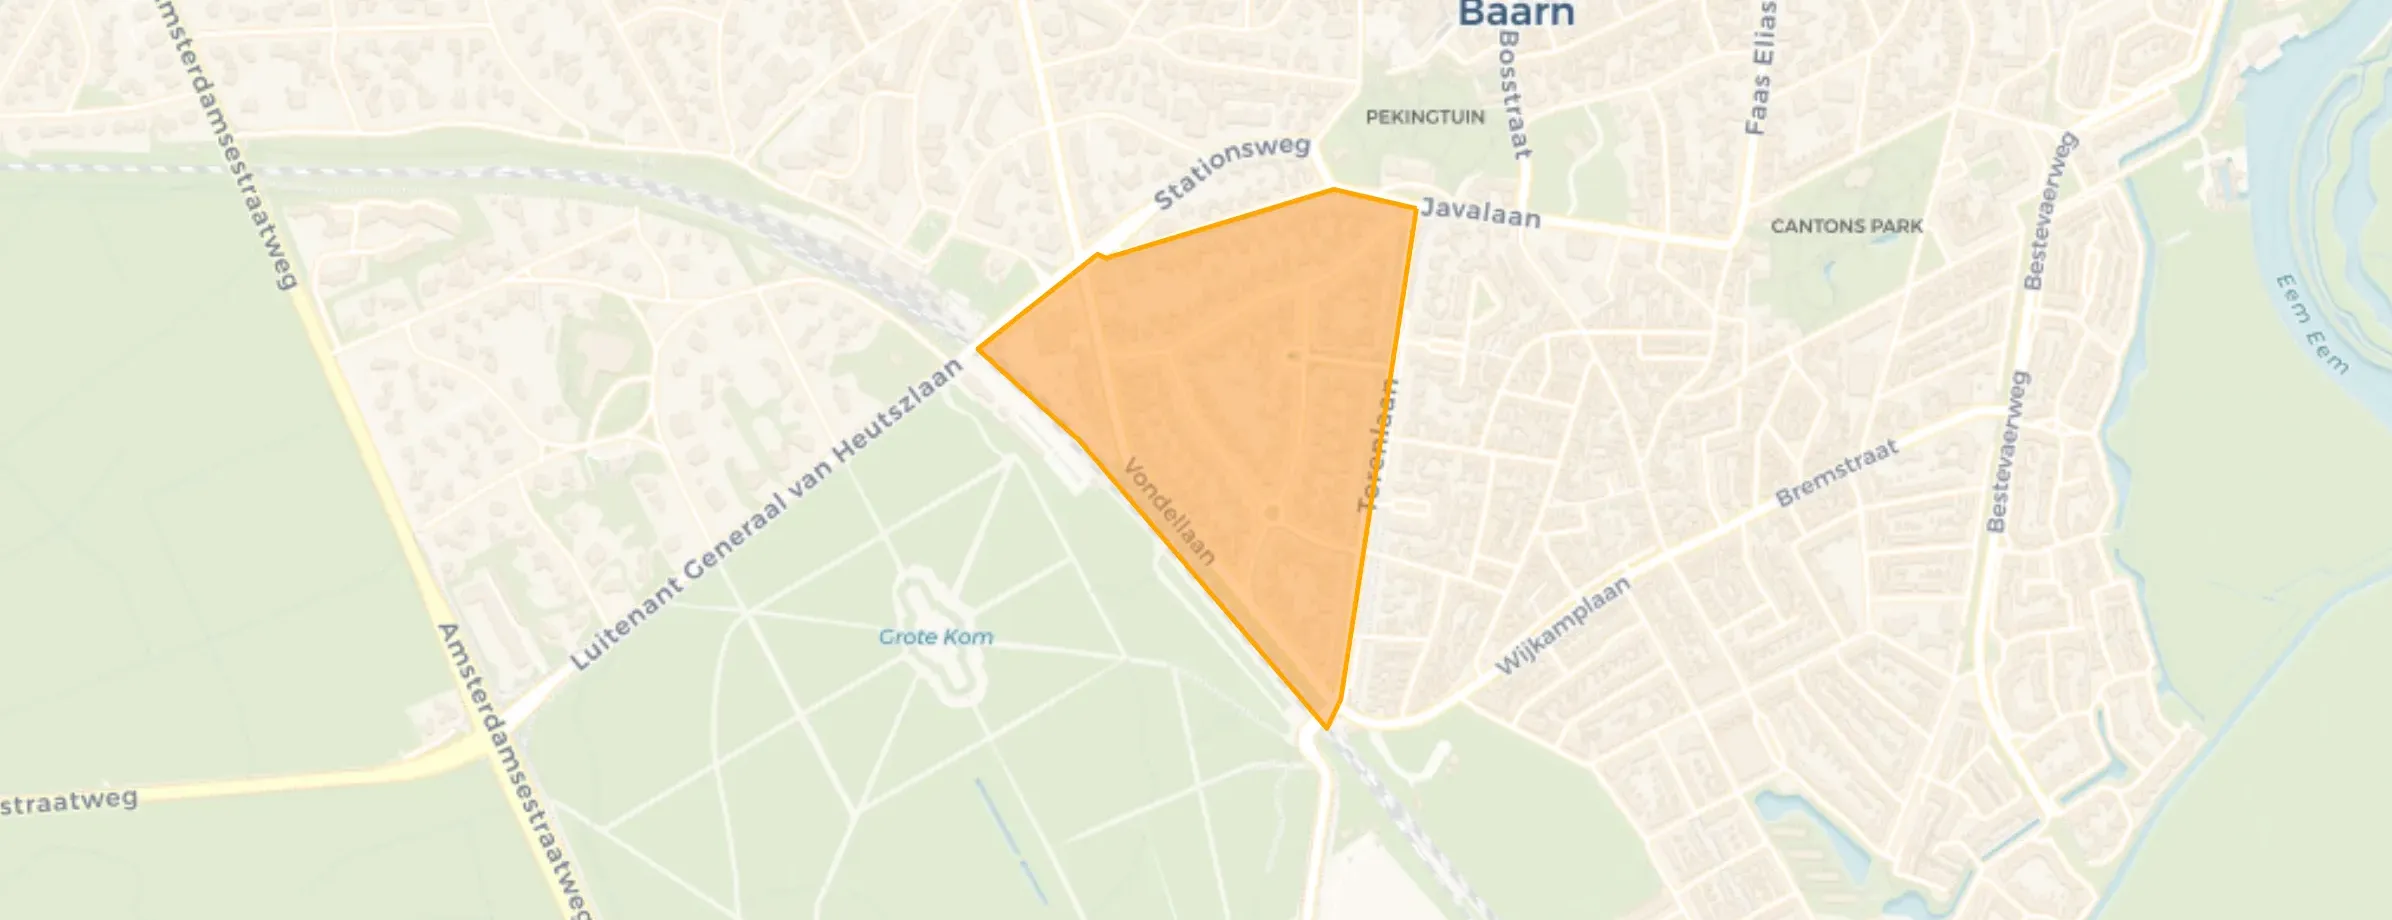
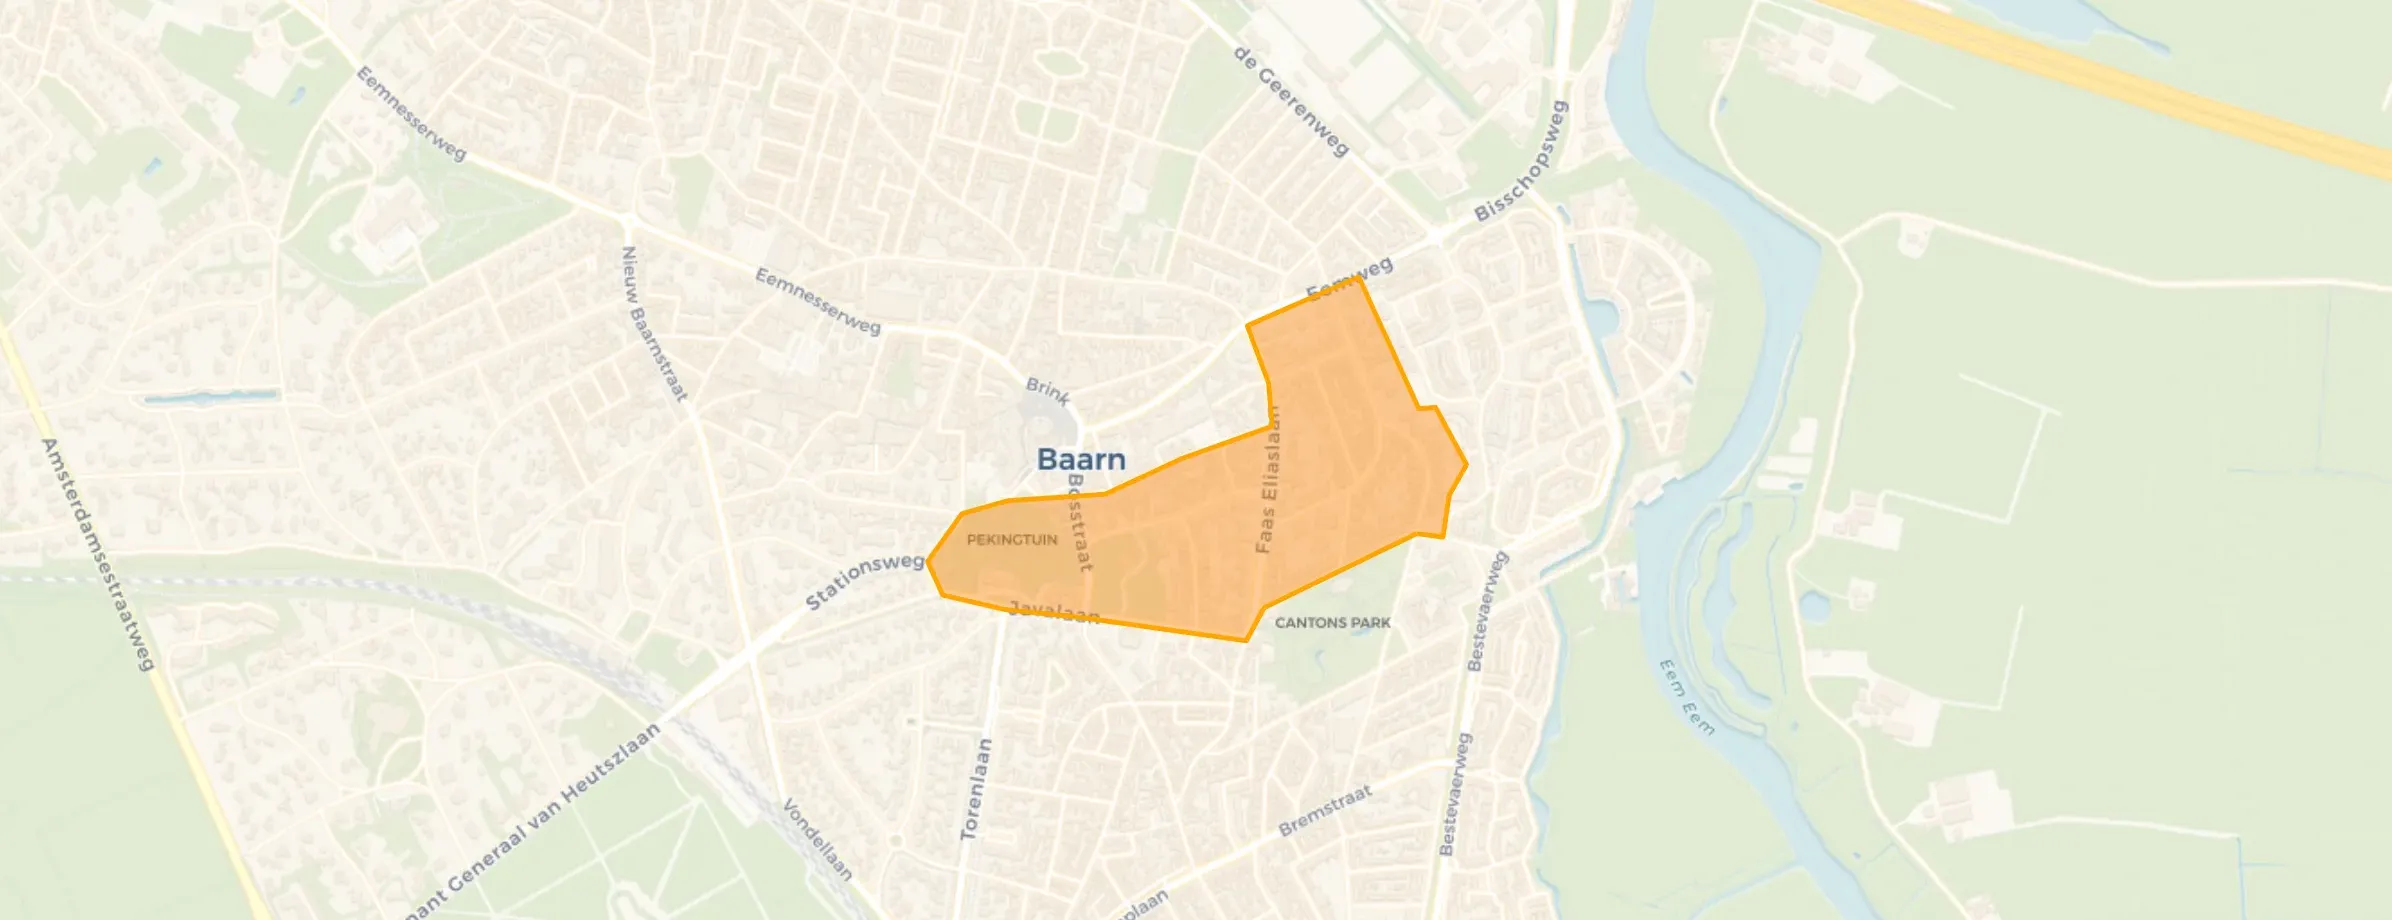
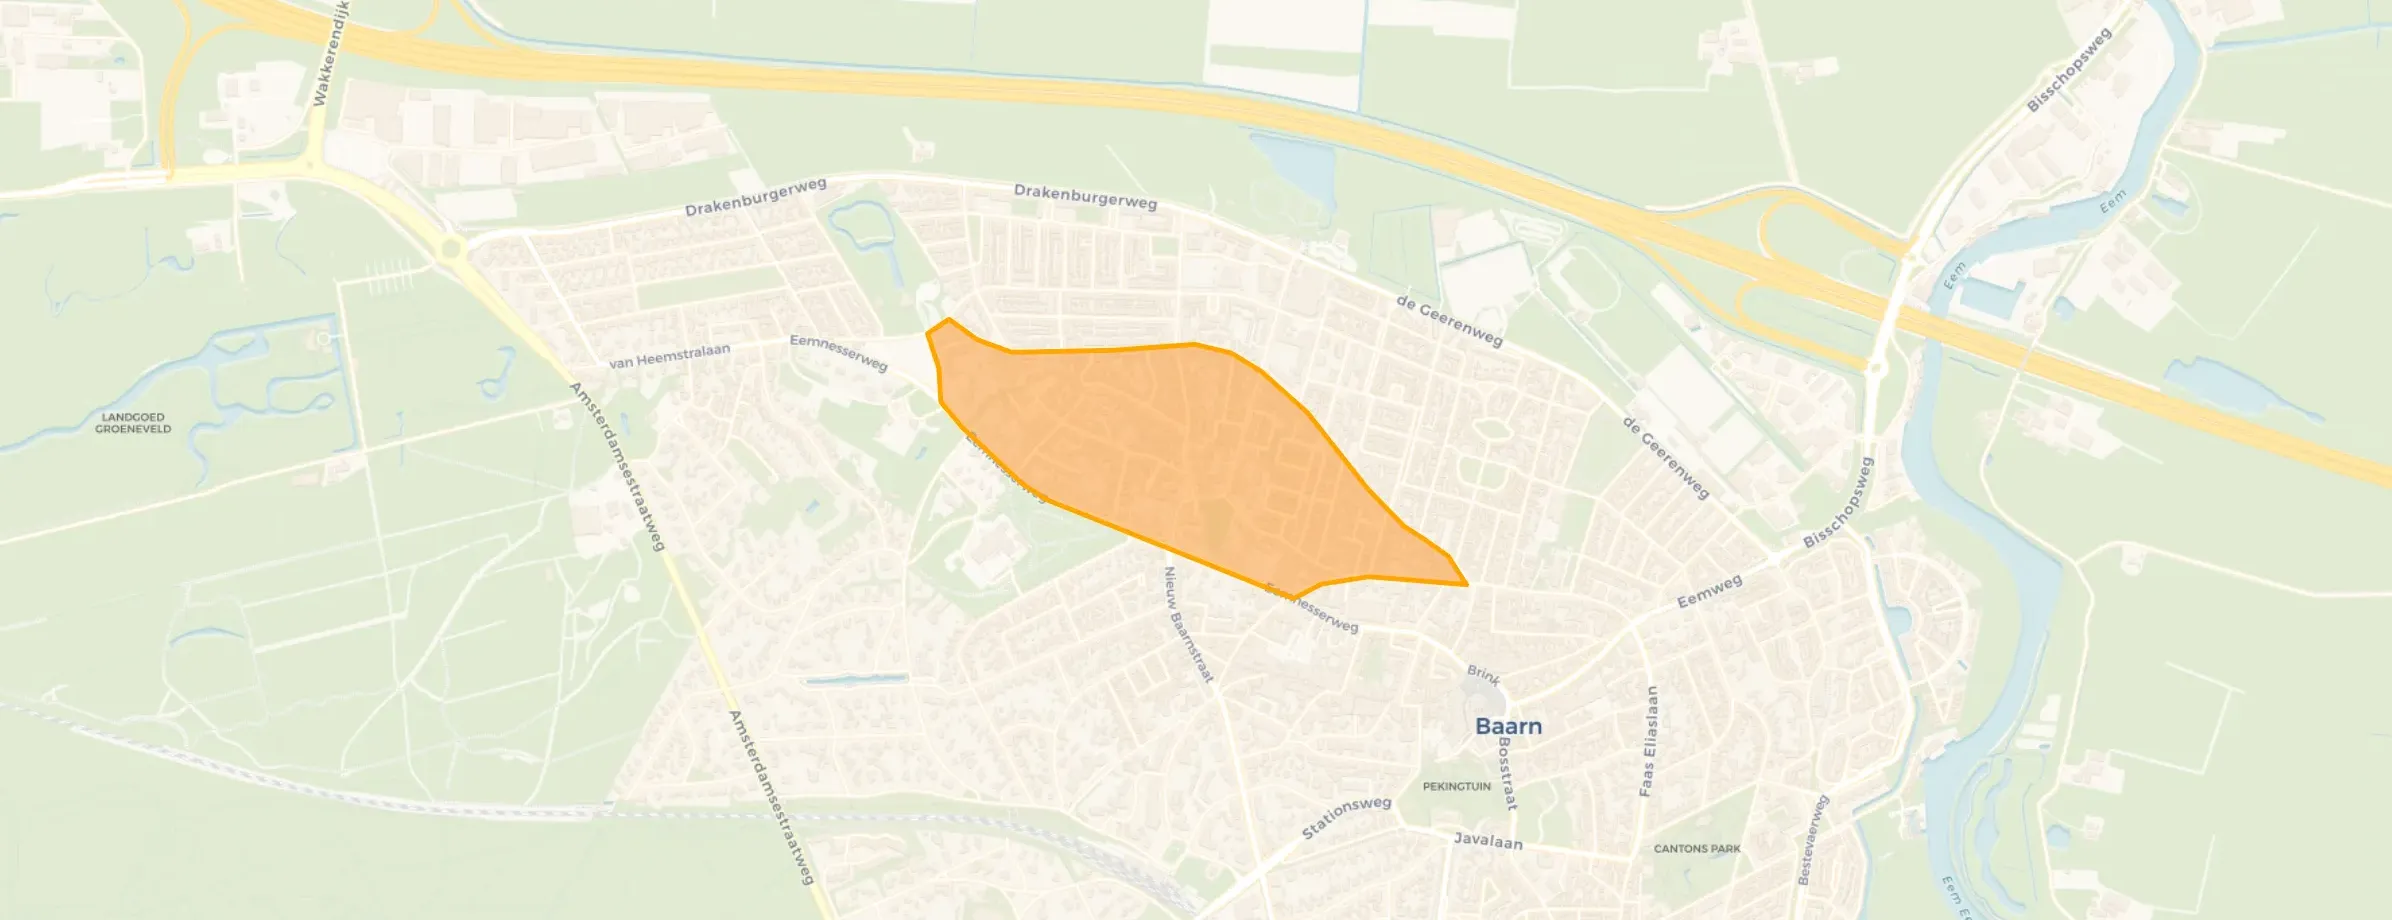
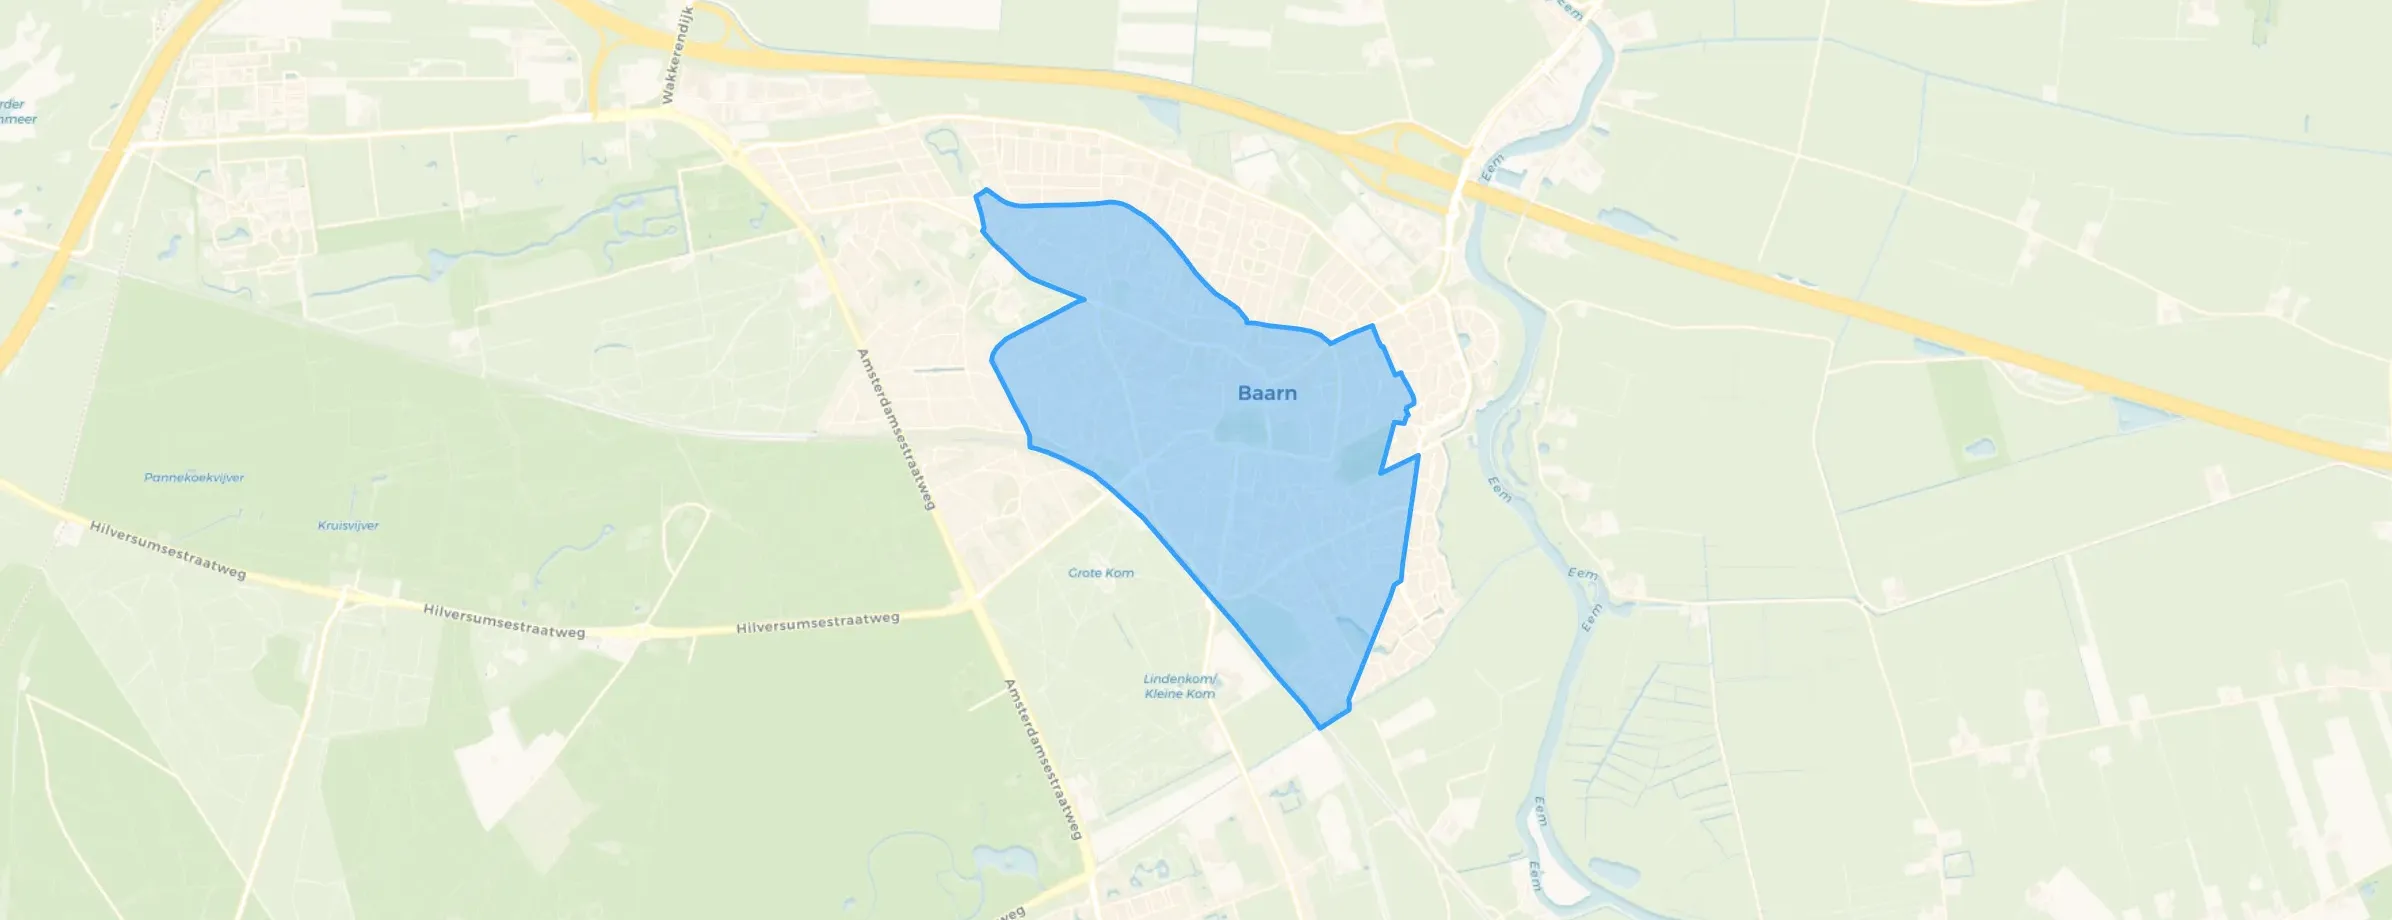
Baarn is located in the province of Utrecht, in the municipality of Baarn The district has a total area of 223 hectares, of which 223 hectares are land and 0 hectares are water. The district is coded as WK030800. The postcode area is 3741AB-3743KT.
Baarn has 12.000 residents. Of these, 48,3% are men and 51,8% are women. Most residents are 45 to 65 years (28,4%). The other age groups are 24,9% for '65 years or older', 21,8% for '25 to 45 years', 15,5% for '0 to 15 years' and 9,3% for '15 to 25 years'. Of the residents, 46,6% is unmarried, 37,9% is married, 9,5% is divorced and 6,0% is widowed. 9.375 residents originate from the Netherlands, 890 come from Europe and 1.740 come from countries outside Europe.
There are 5.725 households in Baarn. 41,3% of these are single-person households, 28,8% households without children and 29,9% households with children. The average household size is 2,1 persons. The national average is 2,1 persons.
In Baarn there are 9.600 income recipients. The average income per income recipient is €51.700, which is €9.500 (23%) higher than the national average of €42.200. Per resident, the average income is €42.400, which is €7.500 (21%) higher than the national average of €34.900. Most residents of Baarn are highly educated. 42,6% have a university or higher professional education (HBO/WO), 36,7% have an intermediate education (HAVO, VWO or MBO 2-4) and 20,7% have a lower education (VMBO or MBO 1).
Of the 12.000 residents, around 73% are in paid employment, which amounts to 8.760 people. This is 1% higher than the national average of 72%. The majority of workers are in salaried employment (77%), while 23% are self-employed. In Baarn, 29% of residents receive a benefit. The largest group is those receiving a state pension (AOW). 2.710 people receive this benefit.
In Baarn there are 5.863 homes with an average assessed value (WOZ) of €514.000. Of these, around 95% are occupied and 5% unoccupied. Most homes are owner-occupied. This amounts to 36% rental homes and 64% owner-occupied homes. Of the homes, 64% privately owned, 23% owned by housing associations and 13% owned by other landlords. The most common construction periods in Baarn are 1950-1970 (23%) and 1900-1925 (19%).
There are currently no homes for sale in Baarn. The most recently listed home is Hoofdstraat 36 by Rigter Makelaars | Qualis Eemland op Funda. No homes were sold in Baarn over the past year.
There are currently no homes for rent in Baarn. The most recent home is Nieuwstraat 25A, offered by Rotsvast. No homes were let in Baarn over the past year.
No recent rental data available for Baarn.
In Baarn there are 4.260 addresses with a registered energy label. The most common labels are A (23%), C (23%) and B (13%). On average, an address in Baarn uses 2.600 kWh of electricity per year. This is 2% above the national average of 2.550 kWh. Natural gas consumption, at 1.000 m³ per year, is 25% above the national average of 800 m³.
Better stay away, then you don't have to witness or experience the dull misery. Nobody misses anything!
Auto-translated to English by AIApart from the occasional unsafety in this little village, I couldn't have wished for a better place on earth to live. Villages are always so cosy, and this one is no exception. Everything is accessible and everyone is well provided for. Baarn is beautiful!
Auto-translated to English by AIBorn and raised in this neighbourhood where many cultural people and churches come together. Schools and childcare also a large playground.. for children. Community centre and associations also present. Supermarket within walking distance. Also a nice park that is closed at night. And yes also a cemetery and a funeral home in the neighbourhood. Medical centre also there with pharmacy, physio and dentist and GPs. Accessible for everyone. From young to old lives here. People know each other, or not, but that is usually what the person wants themselves. Parking is a bit of an issue, but there is usually a spot. Most houses were built just after the war. Grew quickly until 1980. After that time buildings were replaced or renovated. 3 emergency homes for refugees since this year. This neighbourhood is absolutely not boring or quiet... 24 hours there is movement... I wouldn't want to leave here soon. Public transport unfortunately gone, but maybe that will come back a bit. All in all you can be born here and die. Only downside is that there are hardly any things for young people aged 14 to 21. They then look further than the neighbourhood. But complain about this neighbourhood no I cannot do that. A few more bins and a better mentality in cleaning up could sometimes use a lesson here, but that is more for the municipality.... Also the preservation and protection of greenery could be better from the municipality.
Auto-translated to English by AIIt's a fine neighbourhood, not very special or very good, but certainly not bad
Auto-translated to English by AIOver the past year a home for sale in Baarn was listed for an average of €699,283 (€5,999 per m²). That is 32% above the Dutch national average. Last quarter prices rose by 29%.
A rental home in Baarn cost an average of €1,869 per month (€19 per m²). That is 13% below the national average.
Residents give Baarn a 6.5 out of 10 based on 4 reviews. The strongest score is for accessibility (8.3), the weakest for housing (4.3).
A considerable share of the supply in Baarn is less efficient: 27% has an E, F or G label. The average natural gas consumption per household is 1,000 m³ per year.
From Baarn you can on average reach a supermarket at 0.4 km, a GP at 0.5 km, a railway station at 1.2 km, a primary school at 0.5 km (as the crow flies, source: CBS).
Right now you will find 81 homes for sale and 7 homes for rent in Baarn.