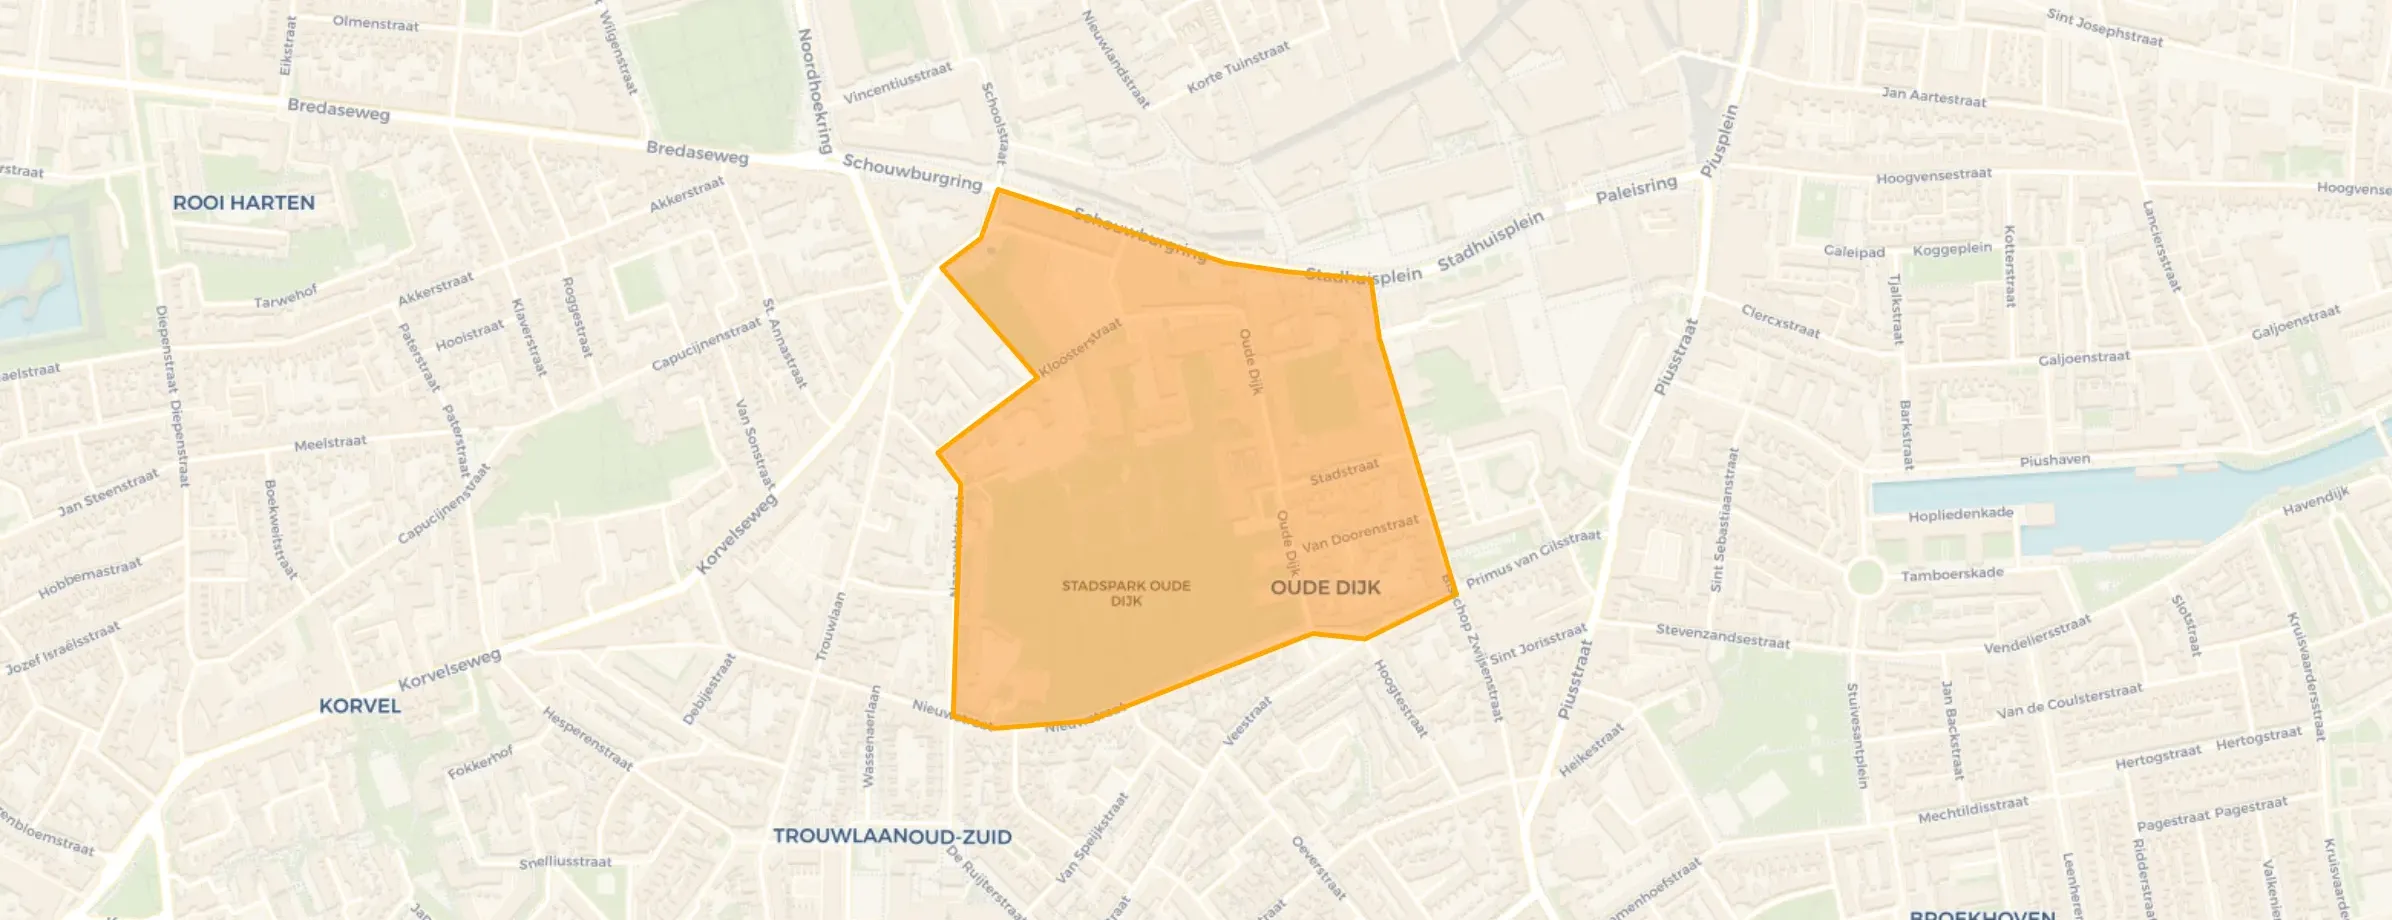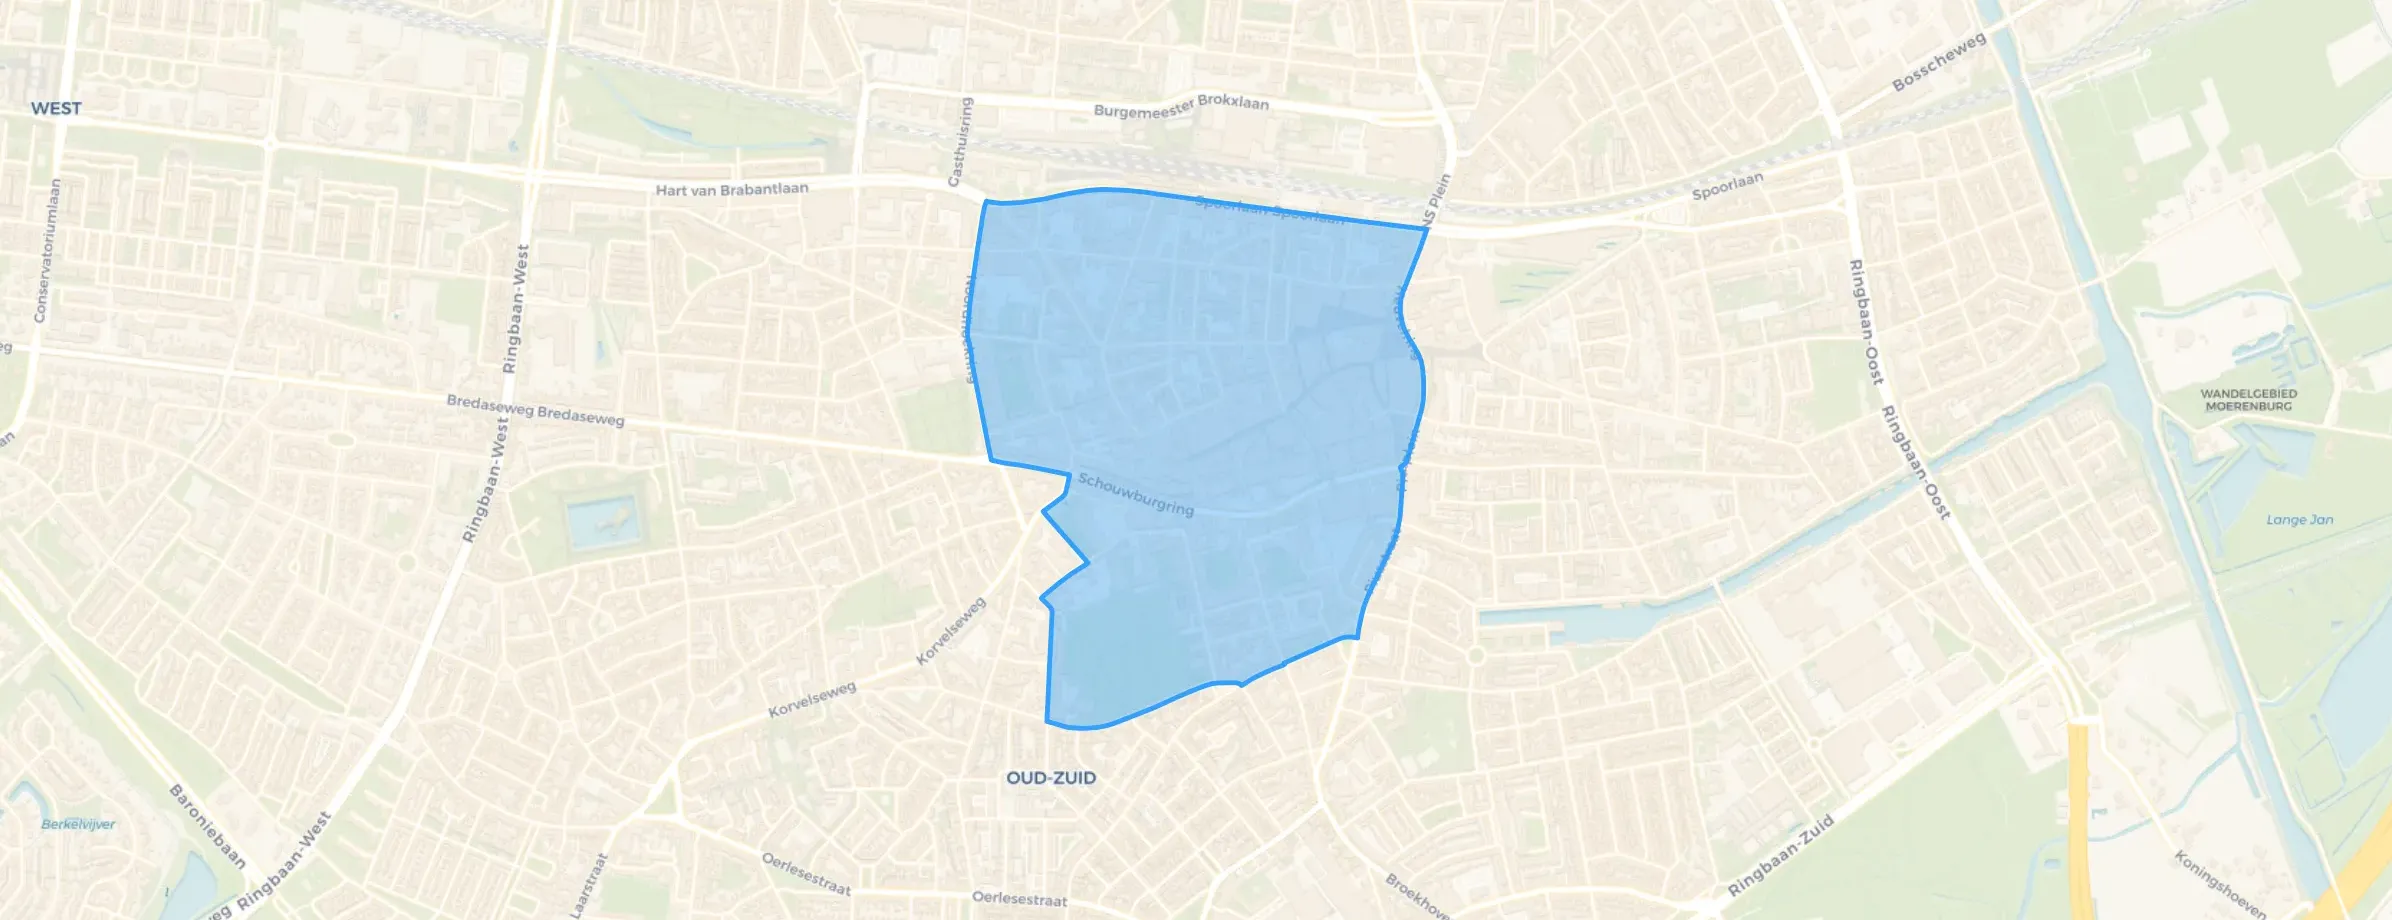
District in Tilburg
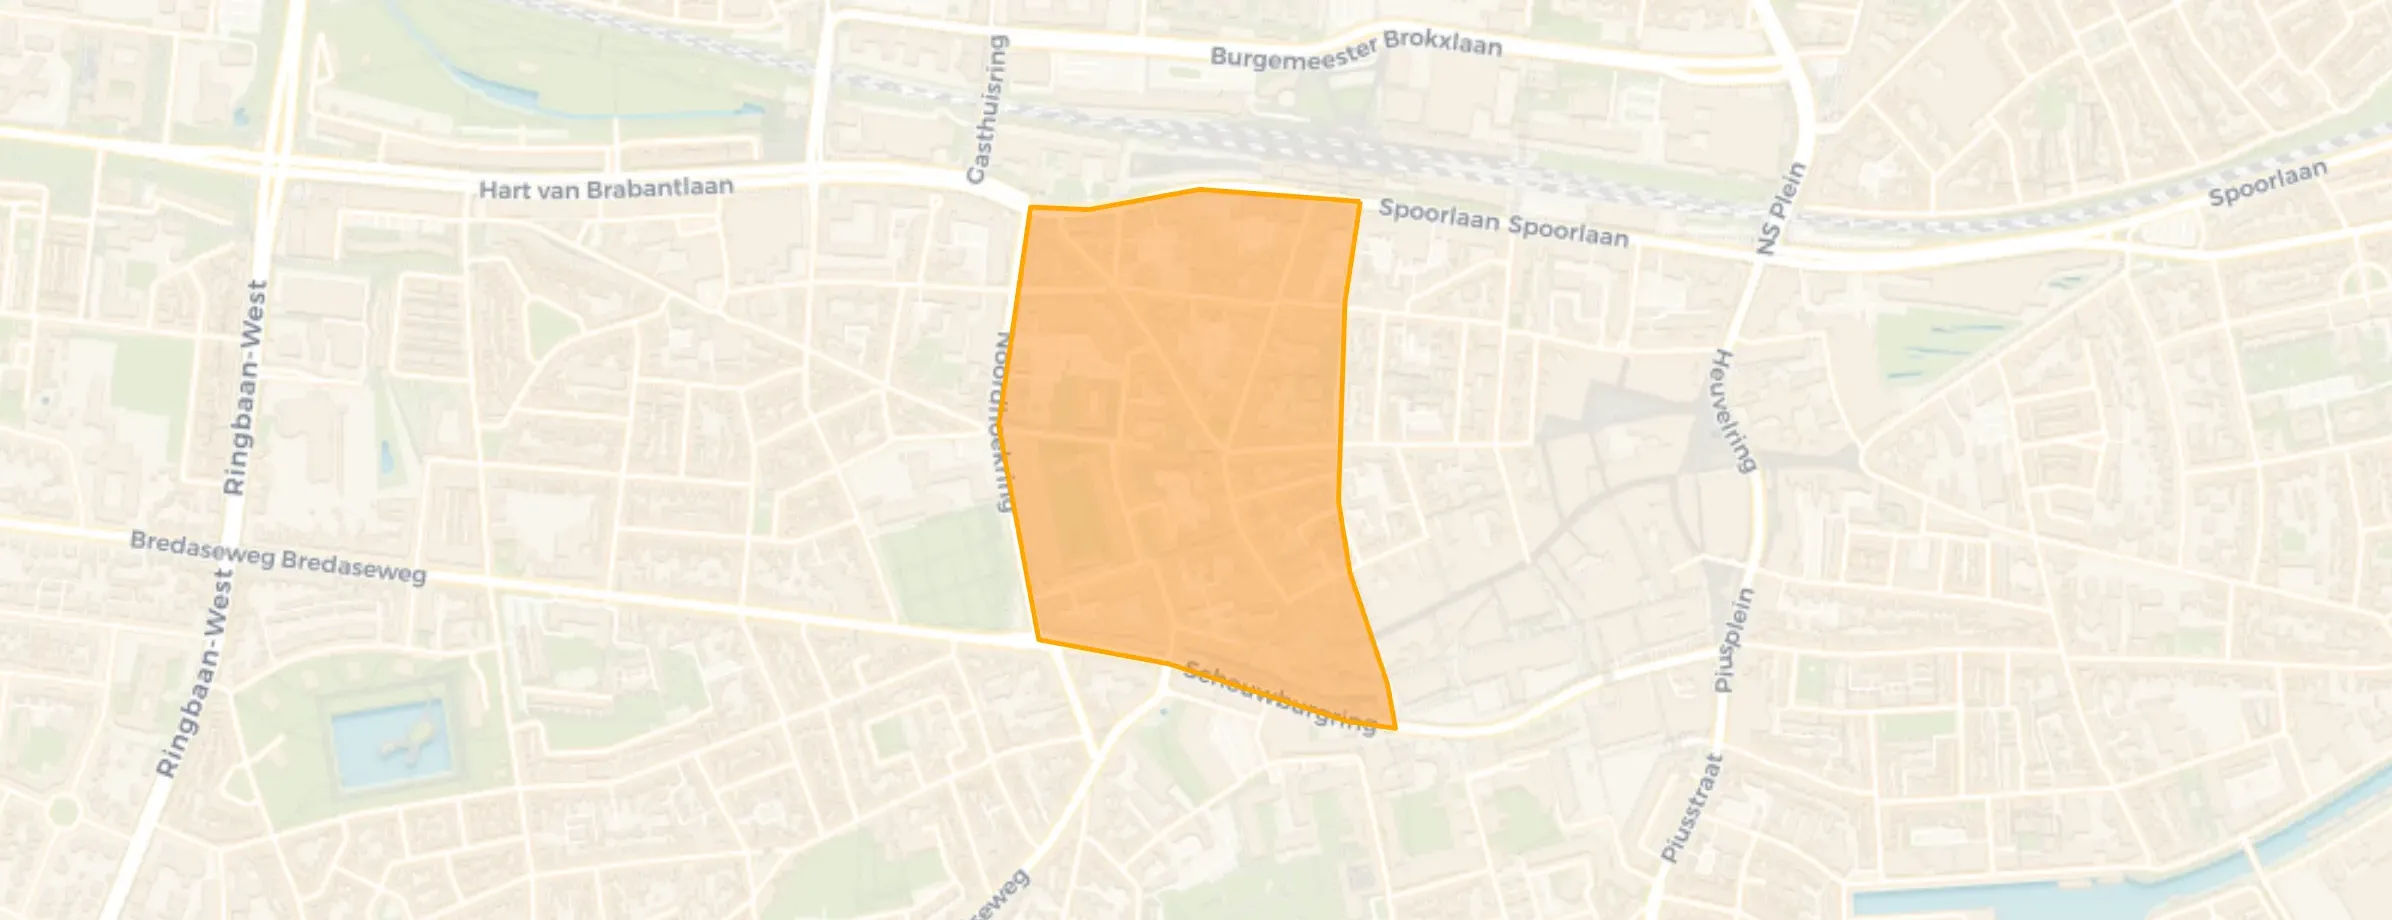
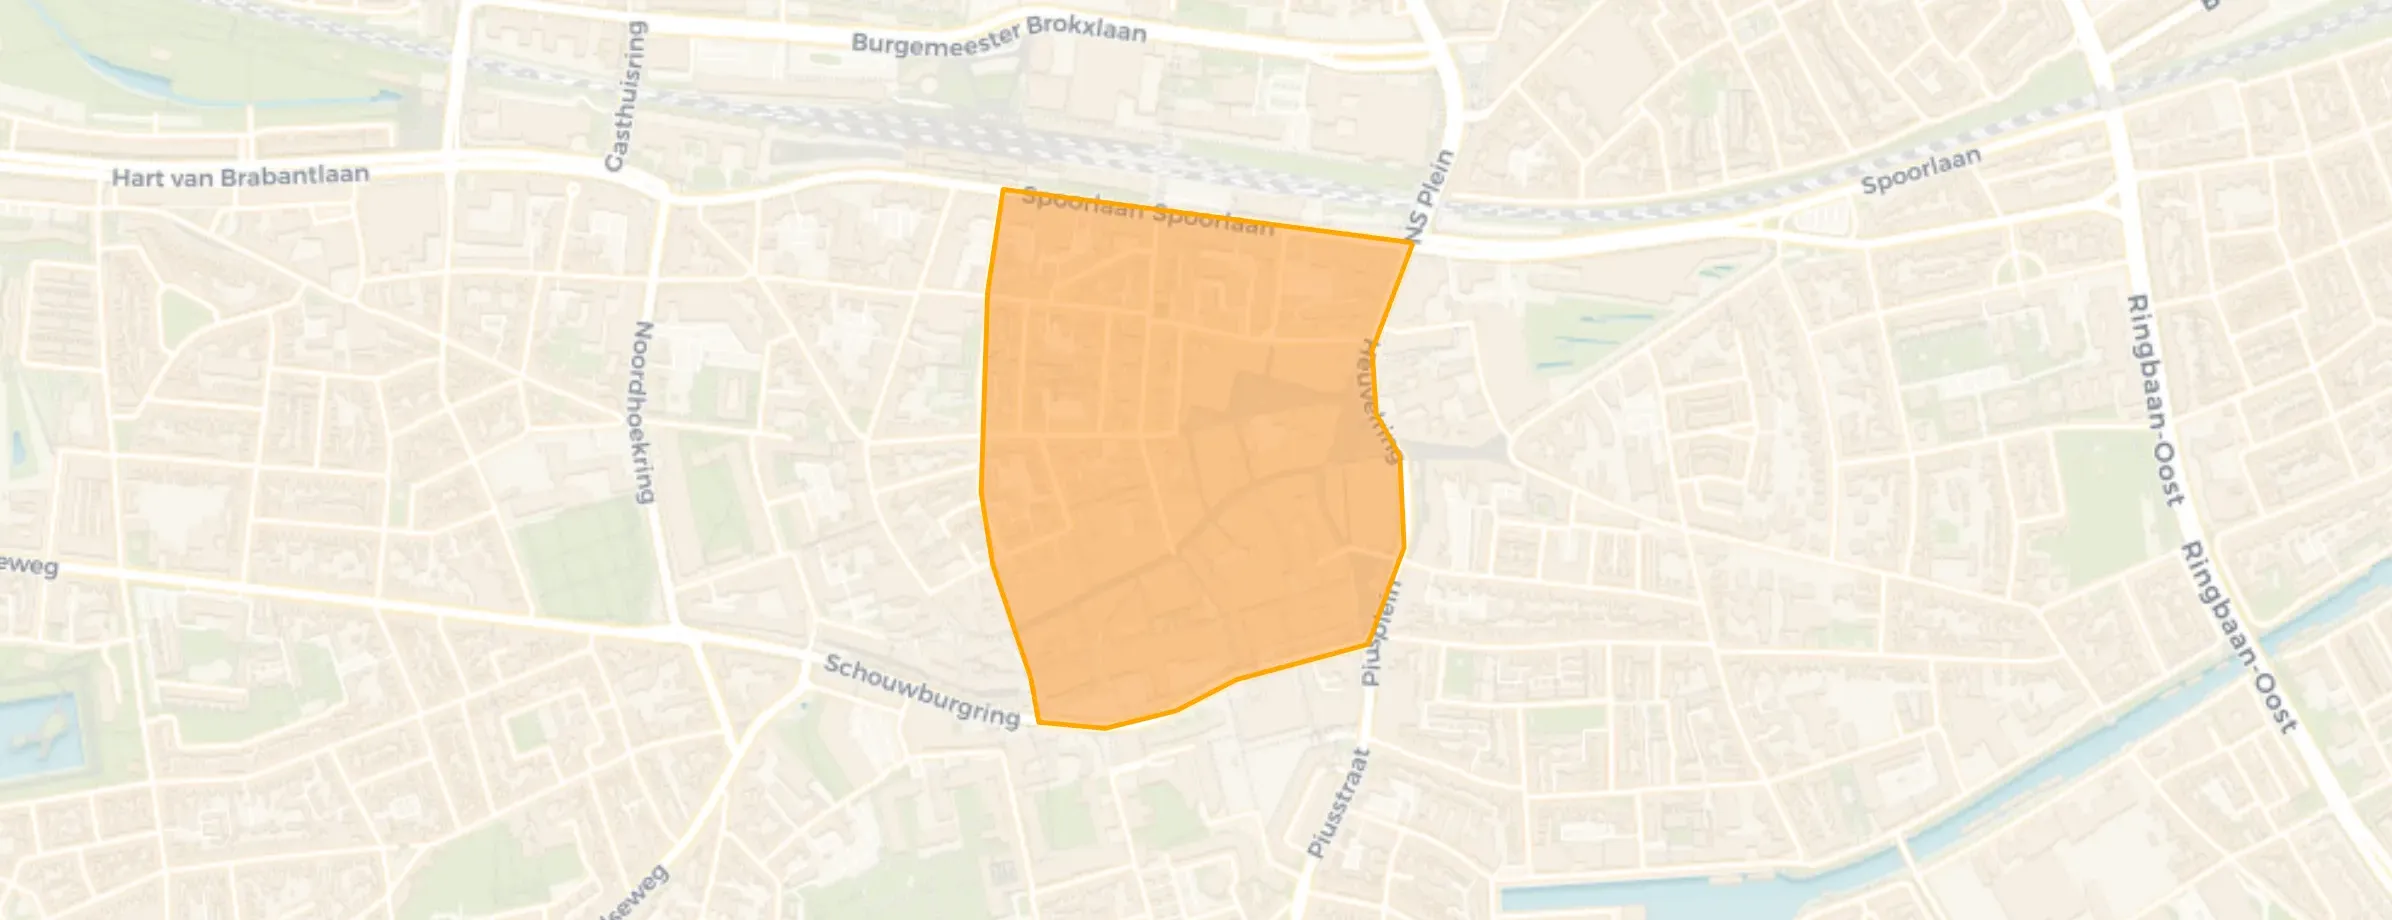
Binnenstad is located in the province of Noord-Brabant, in the municipality of Tilburg The district has a total area of 80 hectares, of which 80 hectares are land and 0 hectares are water. The district is coded as WK085510. The postcode area is 5021VX-5038XZ.
Binnenstad has 8.080 residents. Of these, 50,7% are men and 49,3% are women. Most residents are 25 to 45 years (41,5%). The other age groups are 21,7% for '15 to 25 years', 17,0% for '65 years or older', 16,6% for '45 to 65 years' and 3,2% for '0 to 15 years'. Of the residents, 72,3% is unmarried, 17,2% is married, 7,1% is divorced and 3,4% is widowed. 5.465 residents originate from the Netherlands, 1.160 come from Europe and 1.455 come from countries outside Europe.
There are 5.660 households in Binnenstad. 70,1% of these are single-person households, 24,1% households without children and 5,8% households with children. The average household size is 1,4 persons. The national average is 2,1 persons.
In Binnenstad there are 7.300 income recipients. The average income per income recipient is €37.600, which is €4.600 (11%) lower than the national average of €42.200. Per resident, the average income is €35.900, which is €1.000 (3%) higher than the national average of €34.900. Most residents of Binnenstad are highly educated. 46,4% have a university or higher professional education (HBO/WO), 39,9% have an intermediate education (HAVO, VWO or MBO 2-4) and 13,7% have a lower education (VMBO or MBO 1).
Of the 8.080 residents, around 75% are in paid employment, which amounts to 6.060 people. This is 3% higher than the national average of 72%. The majority of workers are in salaried employment (87%), while 13% are self-employed. In Binnenstad, 23% of residents receive a benefit. The largest group is those receiving a state pension (AOW). 1.250 people receive this benefit.
In Binnenstad there are 5.059 homes with an average assessed value (WOZ) of €300.000. Of these, around 91% are occupied and 9% unoccupied. Most homes are rental properties. This amounts to 81% rental homes and 19% owner-occupied homes. Of the homes, 19% privately owned, 23% owned by housing associations and 58% owned by other landlords. The most common construction periods in Binnenstad are 1980-1990 (19%) and 1900-1925 (18%).
There are currently no homes for sale in Binnenstad. The most recently listed home is Pieter Vreedeplein 38 by De Huizenbemiddelaar c.s.. No homes were sold in Binnenstad over the past year.
There are currently no homes for rent in Binnenstad. The most recent home is Frederikstraat 252, offered by NMG vastgoed kantoor Eindhoven op Funda. No homes were let in Binnenstad over the past year.
No recent rental data available for Binnenstad.
In Binnenstad there are 4.720 addresses with a registered energy label. The most common labels are A (37%), C (18%) and B (12%). On average, an address in Binnenstad uses 1.900 kWh of electricity per year. This is 25% below the national average of 2.550 kWh. With an annual consumption of 620 m³ per address, natural gas consumption is 23% below the national average of 800 m³.
Nice living environment. People look out for each other
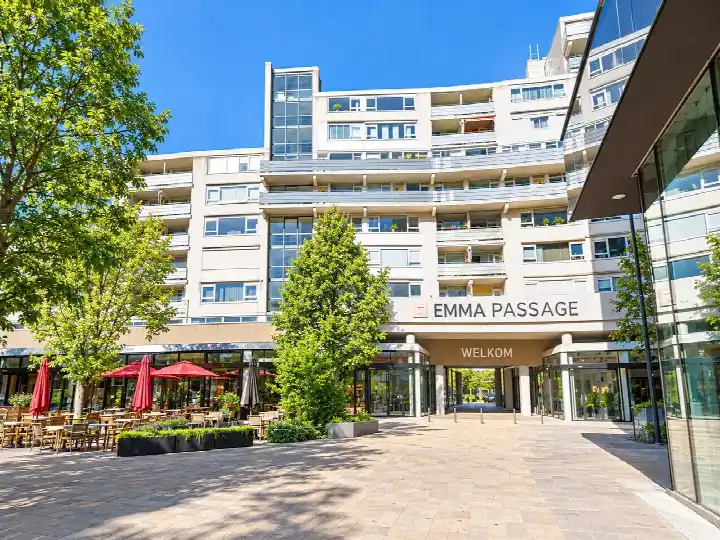
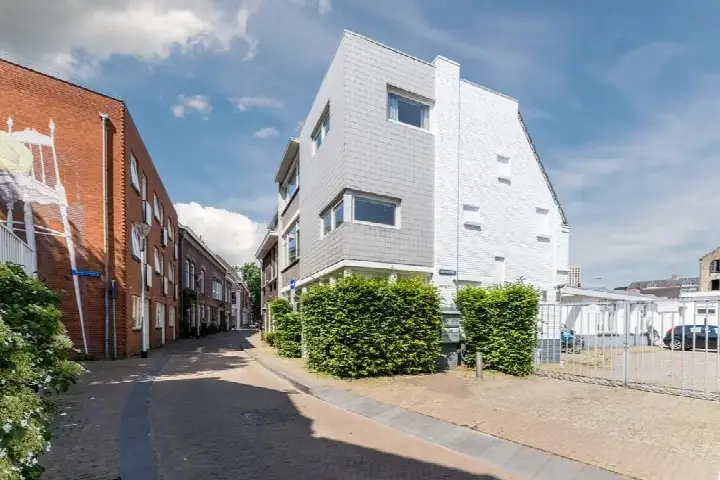
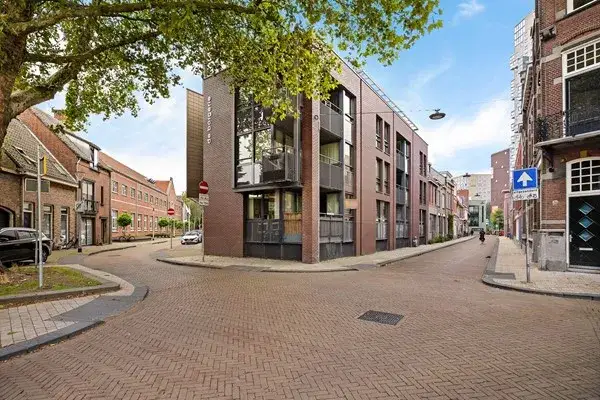
Auto-translated to English by AINice little park in the centre. Living around Harmoniepark is really pleasant. It's in the middle of the city, yet it doesn't feel busy or rushed. The streets still have those old Tilburg houses with beautiful facades and slightly crooked pavements, which actually makes it cosy. You can easily walk into the park, where there's always someone reading or walking their dog. The atmosphere is a bit village-like — people still greet each other, children from the CulTuur after-school care play outside, and there's often something creative in the air, as if there's always something going on with music or art. And if you fancy a coffee or something to eat, you can be in a nice little place within five minutes. It's just a neighbourhood with character, warm and lively without being too crowded.
Auto-translated to English by AIWe live in the middle of the city, in a nice apartment complex; when we step out the front door, we're in the bustling city within 5 minutes. And my balcony overlooks a beautiful green walking park. The neighbourhood is often found here, especially to walk our dogs. The area is kept tidy by people working through an organisation that employs workers with a social distance, always exchanging a friendly word. There is a secondary school around the corner; the students regularly walk back and forth to the nearest supermarket. Behind it is the fire station, which very occasionally comes by in the middle of the night with a lot of noise. Within 10 minutes you're at the train and bus station; actually, everything is wonderfully accessible on foot or by bike. I love the hustle and bustle of our city❤️
Auto-translated to English by AICompared to my previous place of residence Breda, very little greenery, poor parking facilities, and a lot of (unnecessary) one-way traffic
Auto-translated to English by AIEverything close by neglected vegetation schoolchildren pollute the environment food on the street packaging on the street
Auto-translated to English by AIThe housing stock is relatively young — 53% dates from after 1990. In addition, the most common type is flats (89%).
Over the past year a home for sale in Binnenstad was listed for an average of €401,859 (€5,353 per m²). That is 24% below the Dutch national average. Last quarter prices fell by 12%.
A rental home in Binnenstad cost an average of €1,367 per month (€17 per m²). That is 37% below the national average.
Residents give Binnenstad a 7.6 out of 10 based on 5 reviews. Especially amenities (9.5) scores well; nature and greenery (4.4) receives the lowest rating.
Wijk Binnenstad has 8,080 residents. The largest age group is 25 to 45 years (42%). Notably, 70% of the households are single-person households.
The housing supply in Binnenstad is remarkably efficient: 61% has an A, A+ or B label. The average natural gas consumption per household is 620 m³ per year.
From Binnenstad you can on average reach a supermarket at 0.6 km, a GP at 0.5 km, a railway station at 1.7 km, a primary school at 1.1 km (as the crow flies, source: CBS).
Right now you will find 59 homes for sale and 43 homes for rent in Binnenstad.