District in Utrecht
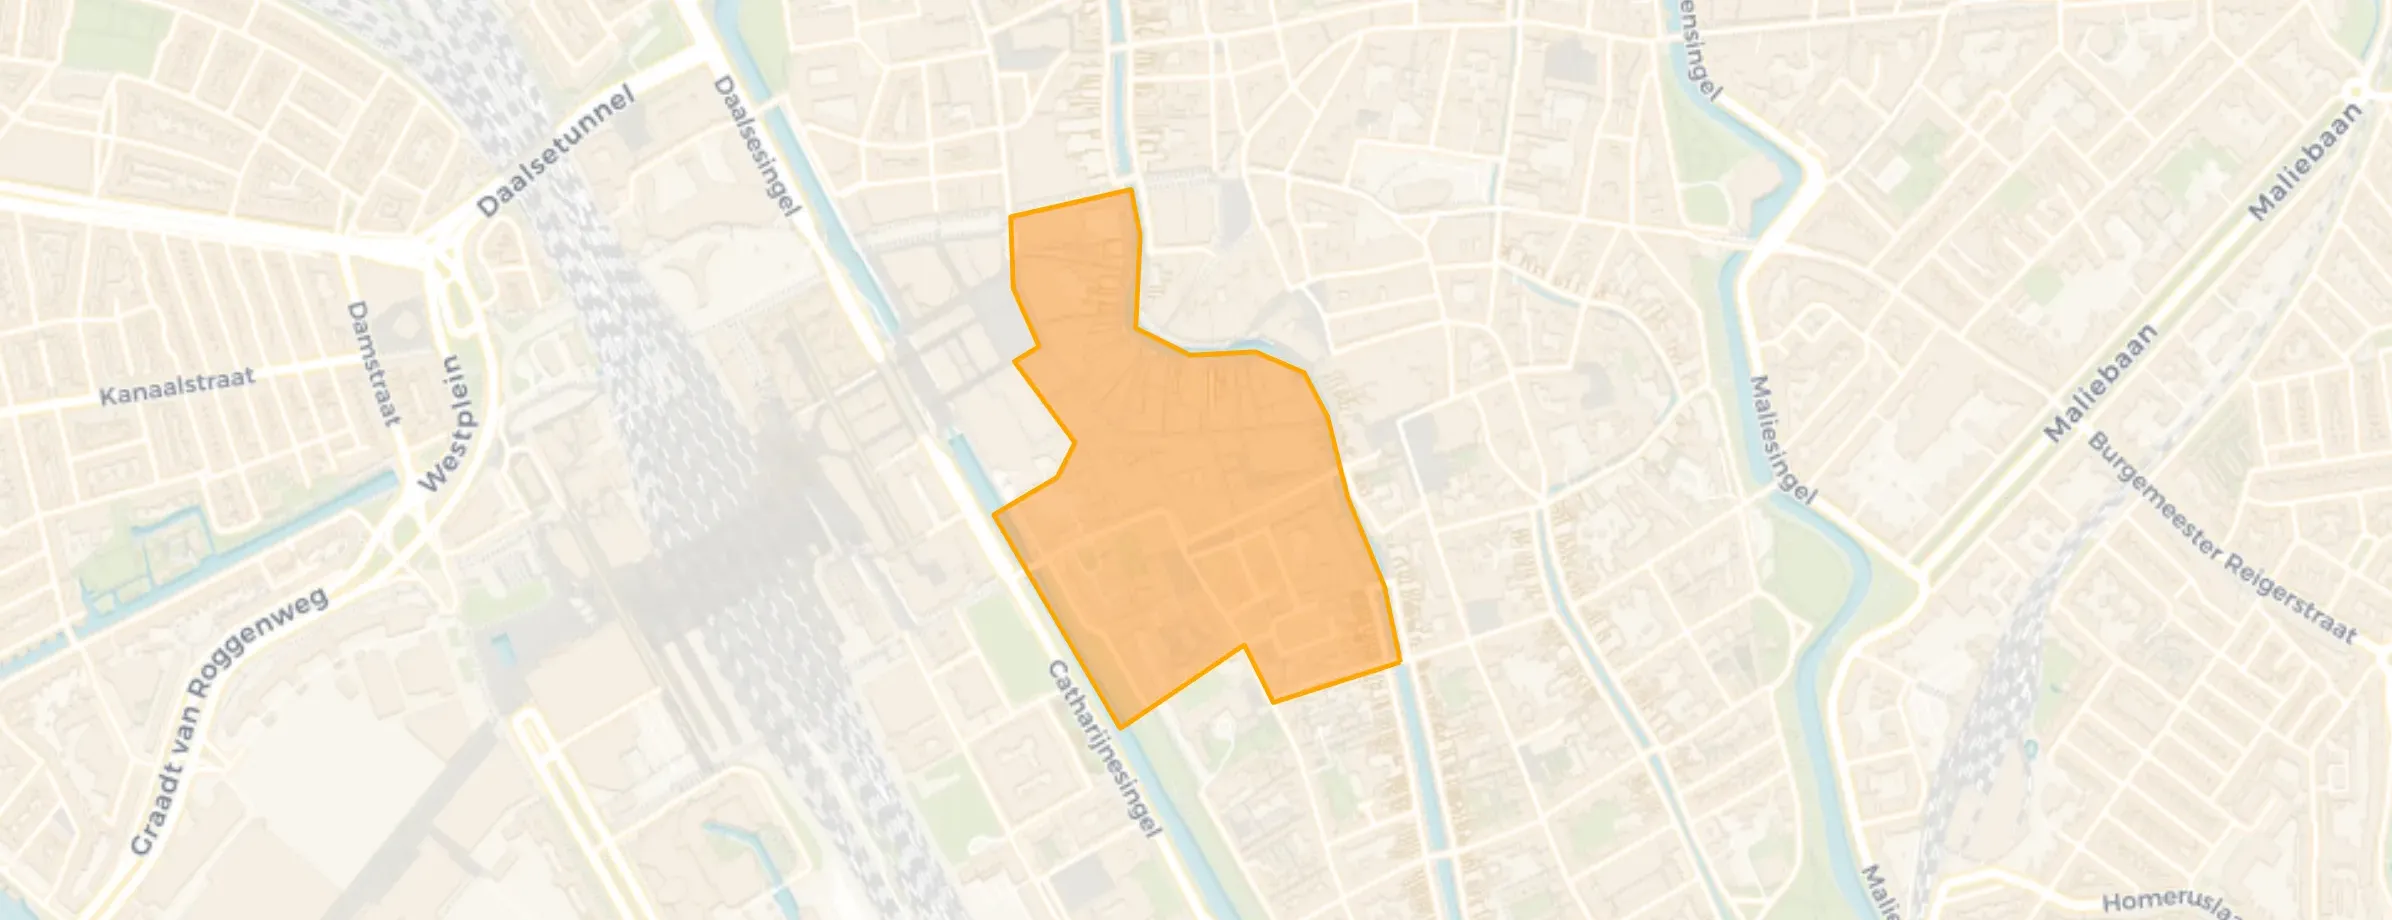
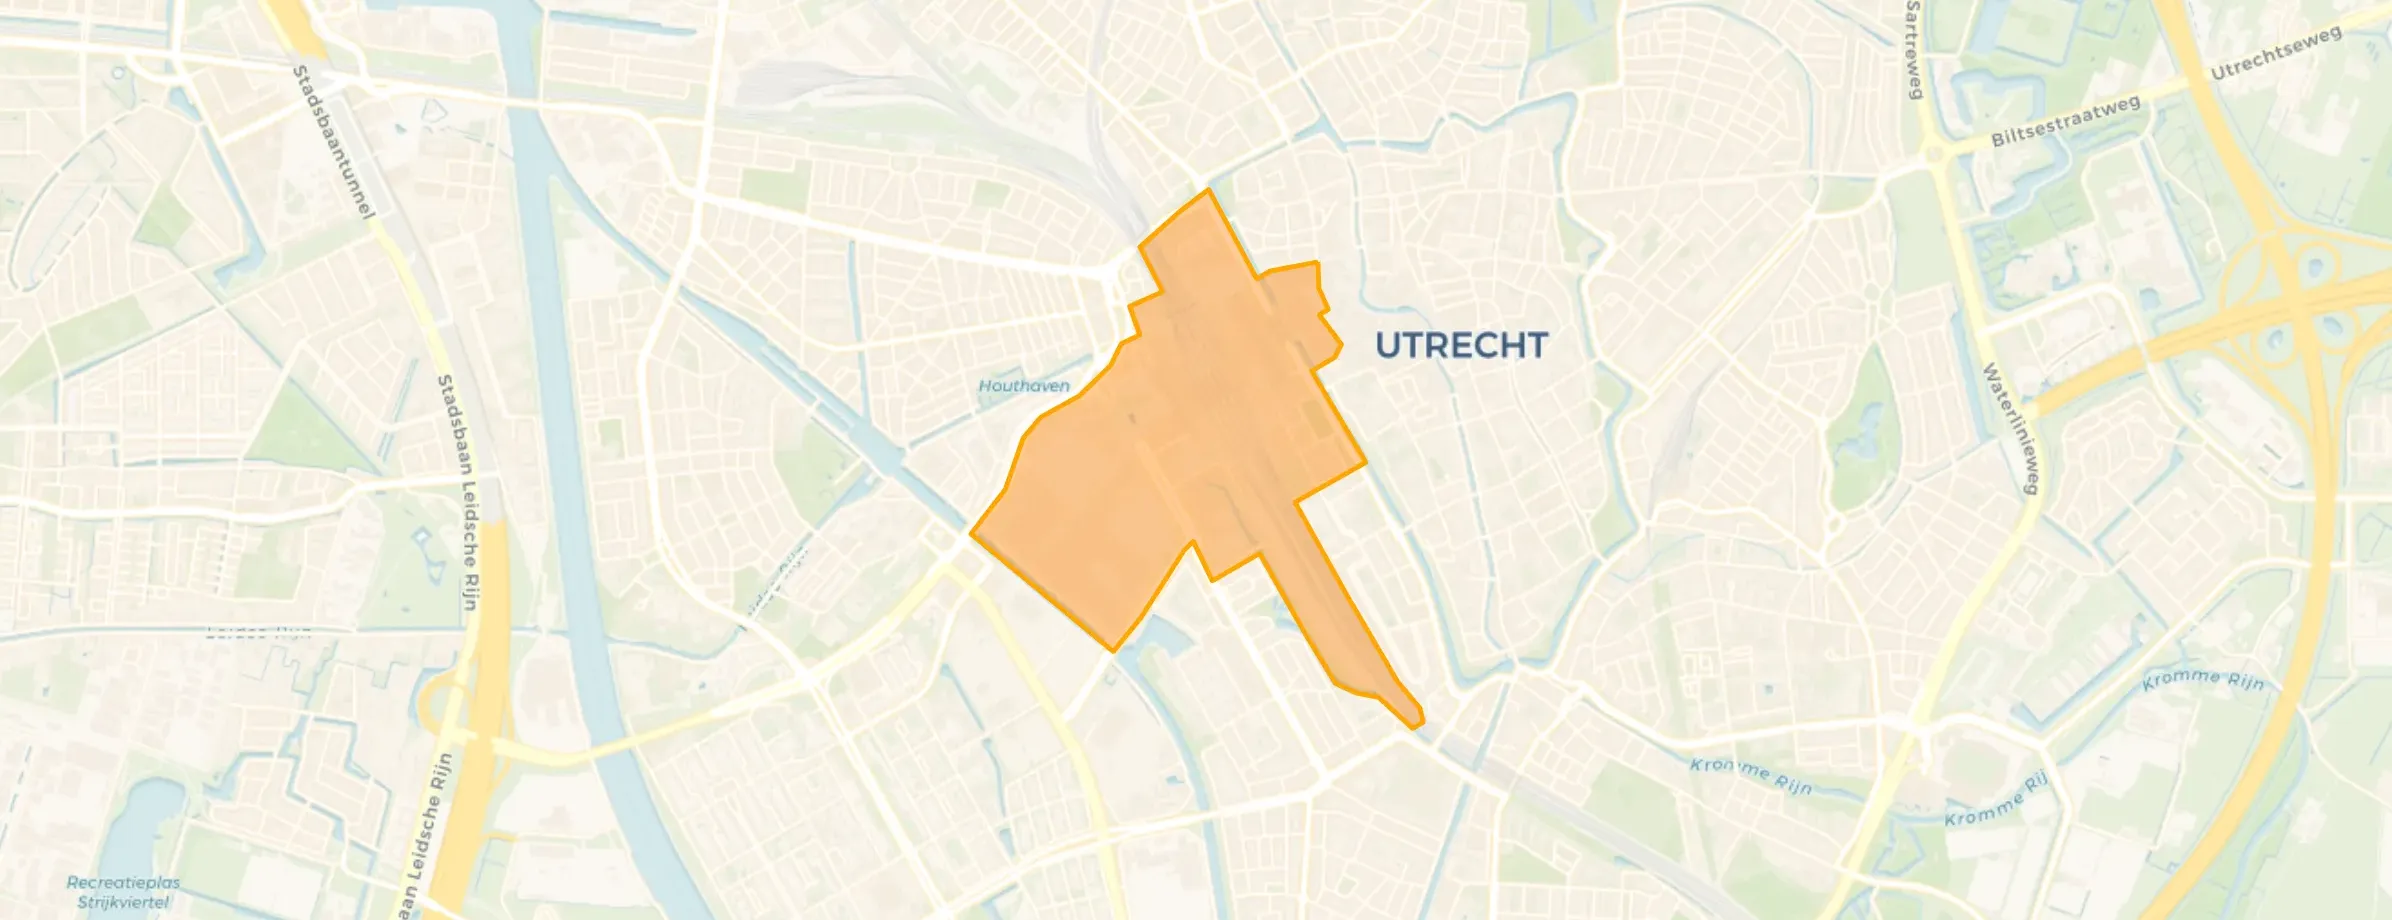
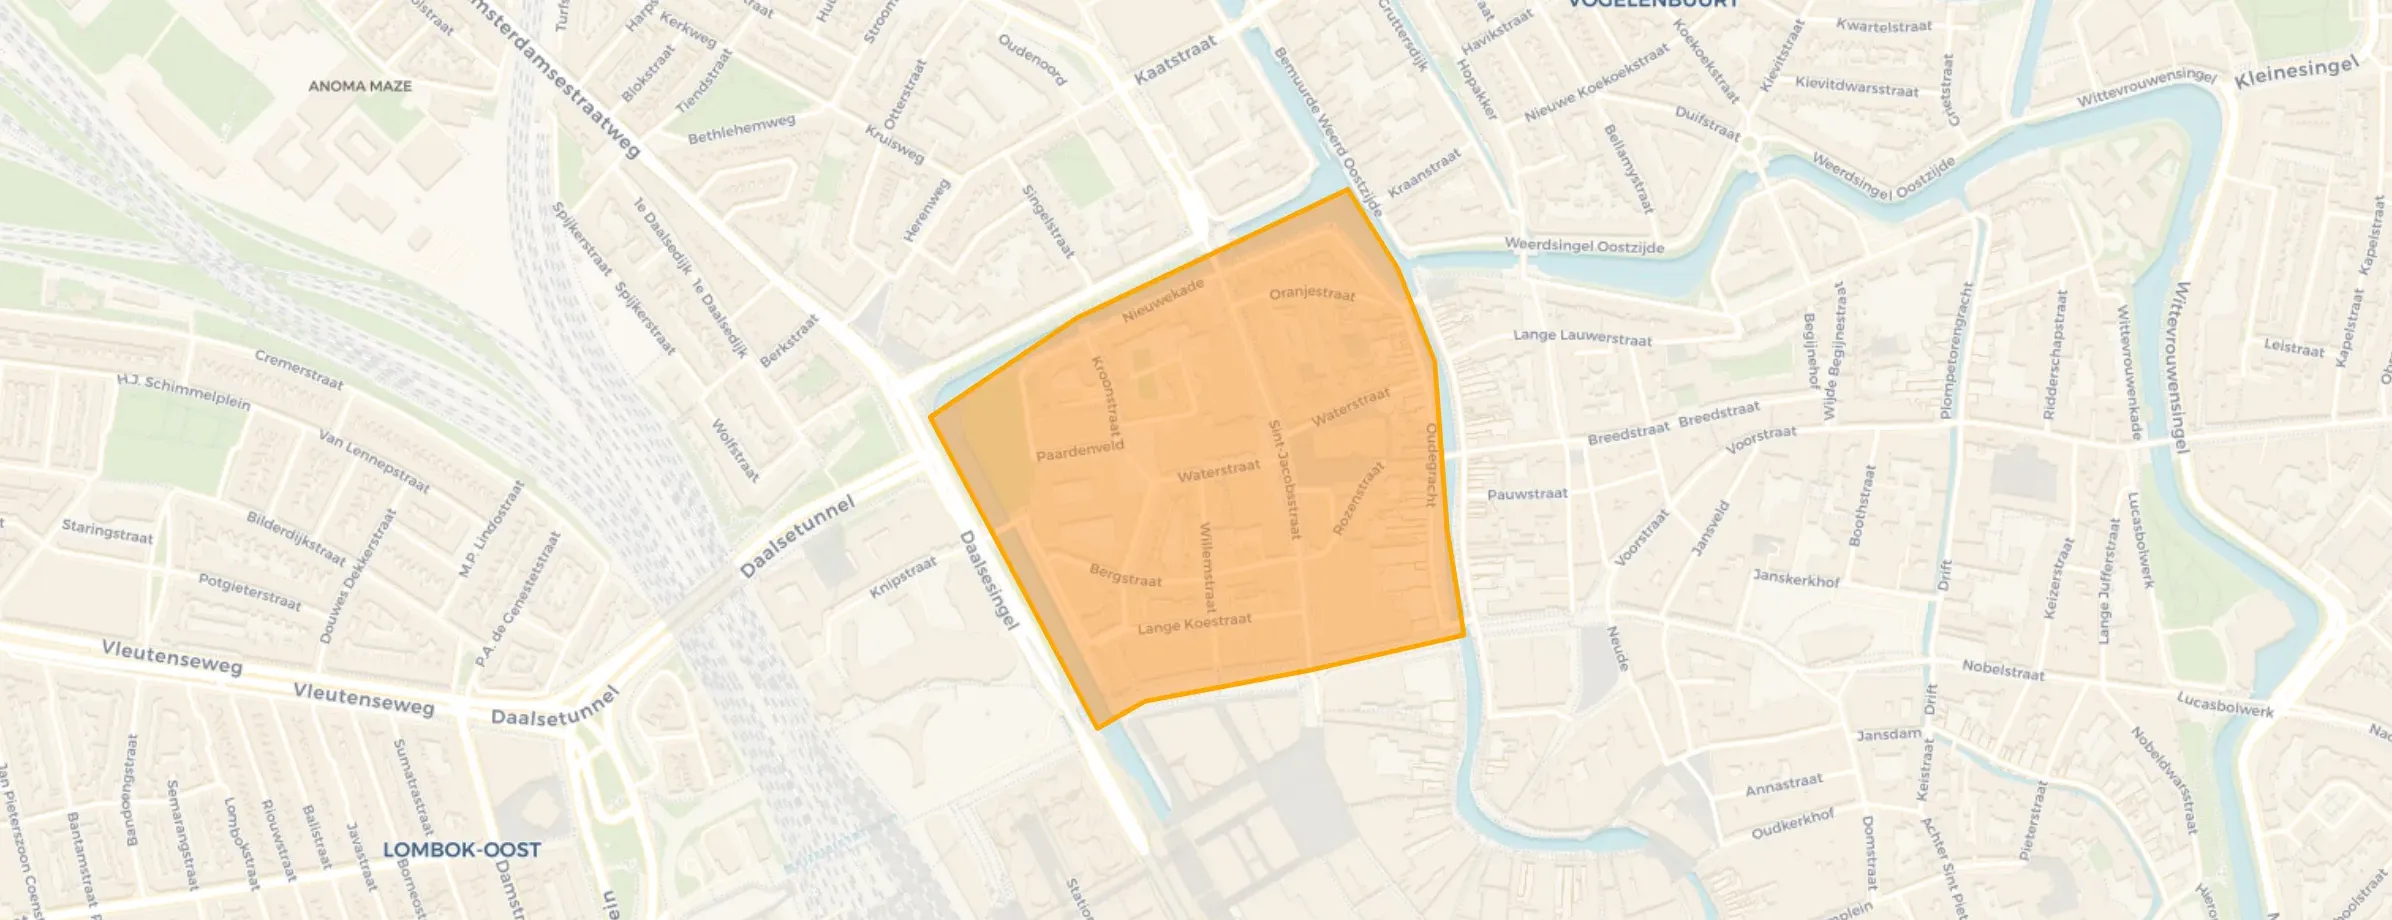
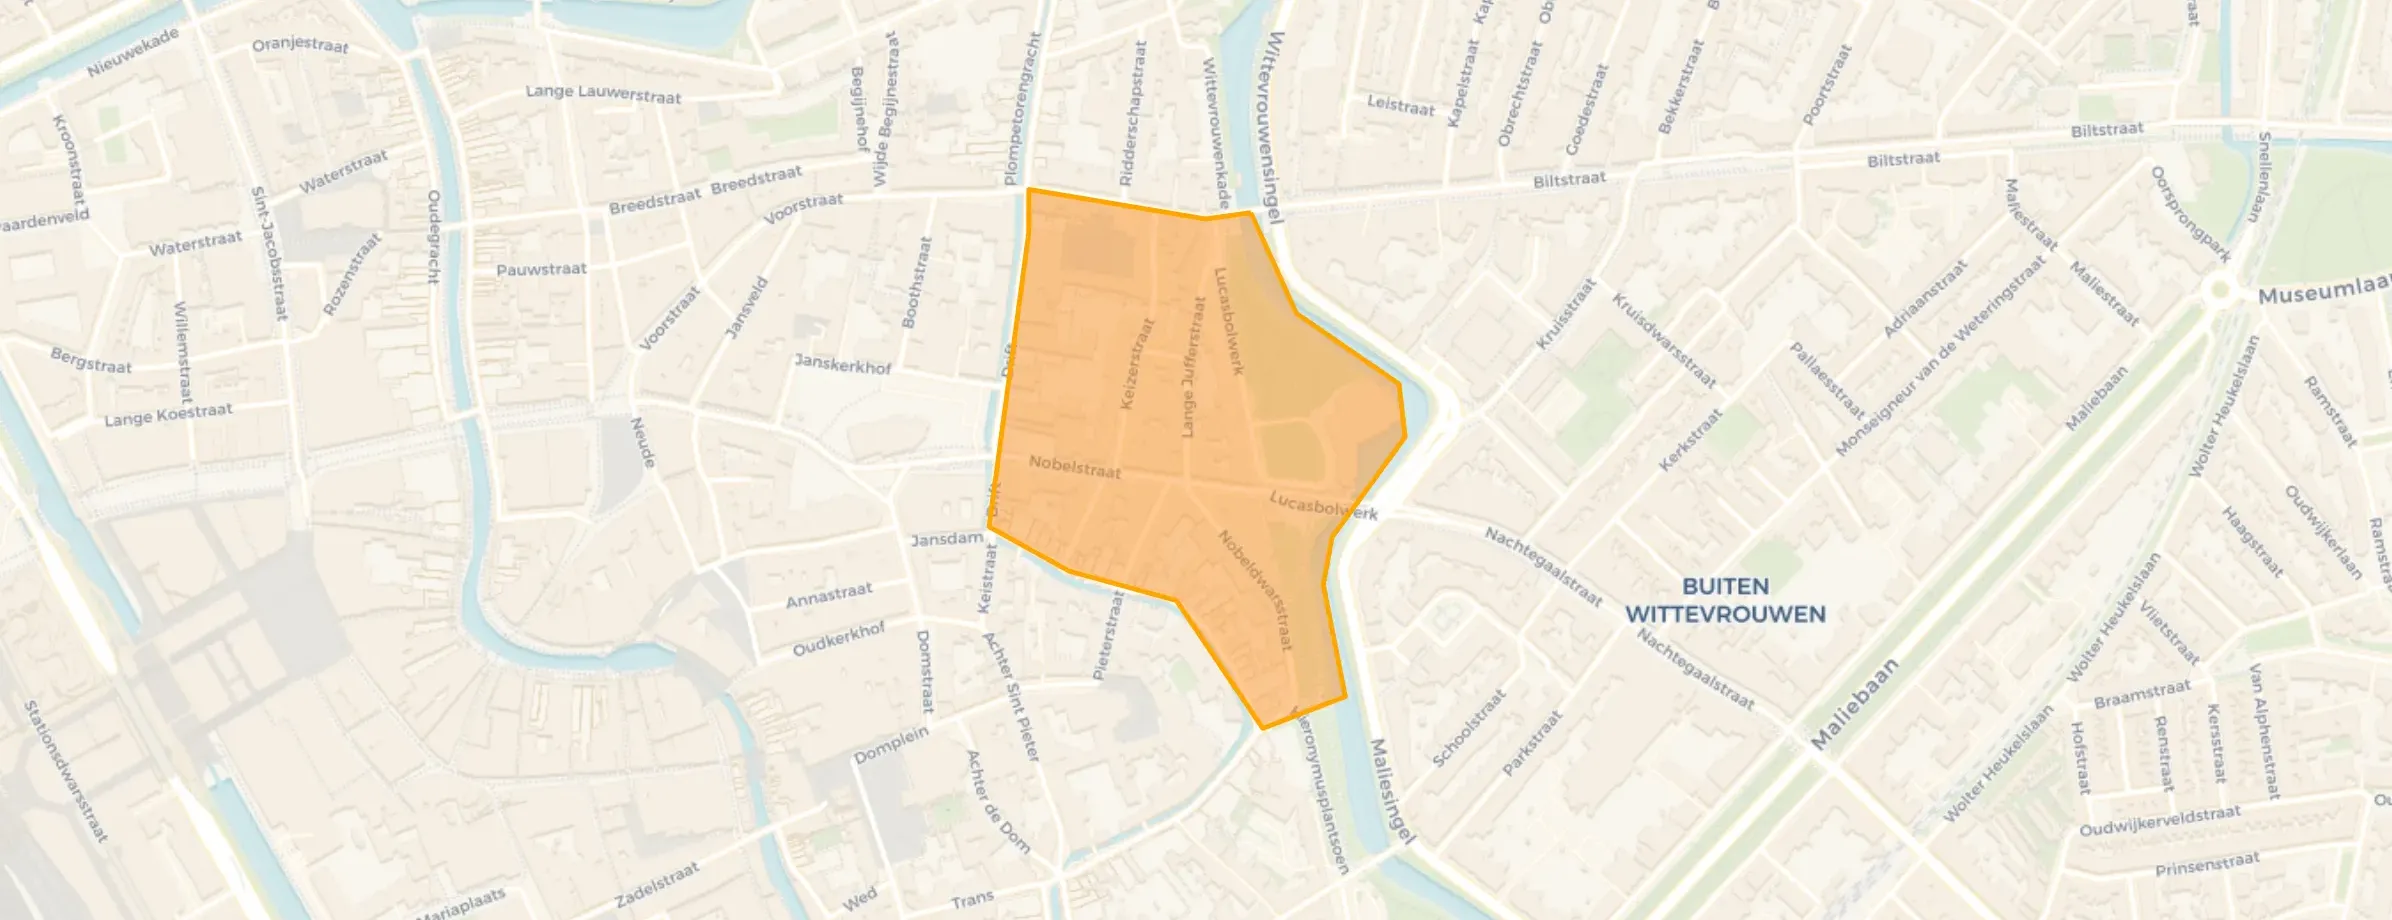
Binnenstad is located in the province of Utrecht, in the municipality of Utrecht The district has a total area of 271 hectares, of which 259 hectares are land and 11 hectares are water. The district is coded as WK034406. The postcode area is 3511AA-3531BL.
Binnenstad has 20.190 residents. Of these, 51,0% are men and 49,0% are women. Most residents are 25 to 45 years (48,2%). The other age groups are 18,5% for '15 to 25 years', 17,3% for '45 to 65 years', 11,4% for '65 years or older' and 4,5% for '0 to 15 years'. Of the residents, 77,1% is unmarried, 16,1% is married, 5,1% is divorced and 1,7% is widowed. 12.840 residents originate from the Netherlands, 3.220 come from Europe and 4.130 come from countries outside Europe.
There are 13.615 households in Binnenstad. 68,5% of these are single-person households, 24,4% households without children and 7,1% households with children. The average household size is 1,4 persons.
In Binnenstad there are 16.800 income recipients. The average income per income recipient is €45.400, which is €9.600 (27%) higher than the national average of €35.800. Per resident, the average income is €42.300, which is €13.100 (45%) higher than the national average of €29.200. Most residents of Binnenstad are highly educated. 66,0% have a university or higher professional education (HBO/WO), 26,2% have an intermediate education (HAVO, VWO or MBO 2-4) and 7,8% have a lower education (VMBO or MBO 1).
Of the 20.190 residents, around 72% are in paid employment, which amounts to 14.537 people. This is 7% higher than the national average of 65%. The majority of workers are in salaried employment (82%), while 18% are self-employed. In Binnenstad, 15% of residents receive a benefit. The largest group is those receiving a state pension (AOW). 2.000 people receive this benefit.
In Binnenstad there are 10.718 homes with an average assessed value (WOZ) of €535.000. Of these, around 89% are occupied and 11% unoccupied. Most homes are rental properties. This amounts to 70% rental homes and 30% owner-occupied homes. Of the homes, 30% privately owned, 17% owned by housing associations and 53% owned by other landlords. The most common construction periods in Binnenstad are 1700-1900 (21%) and Before 1700 (18%).
There are currently no homes for sale in Binnenstad. The most recently listed home is Hoola van Nootenstraat 393 by Punt Makelaars Utrecht op Funda. No homes were sold in Binnenstad over the past year.
There are currently no homes for rent in Binnenstad. The most recent home is Achter Clarenburg 31B, offered by Rotsvast Maastricht. No homes were let in Binnenstad over the past year.
No recent rental data available for Binnenstad.
In Binnenstad there are 12.354 addresses with a registered energy label. The most common labels are G (23%), A (22%) and C (19%). On average, an address in Binnenstad uses 2.200 kWh of electricity per year. This is 22% below the national average of 2.810 kWh. With an annual consumption of 530 m³ per address, natural gas consumption is 59% below the national average of 1.280 m³.





I live on the Singel, which is quite busy with traffic, but the streets behind it (between the Singel and the railway) are actually very quiet and peaceful. This is also because there are few amenities in this part. However, you can easily reach all necessary shops on foot. Due to the few cafés in these streets, there is little sense of community. The quiet streets behind the house can sometimes be scary when you have to walk through them at night. Especially the stretch from the central station to home passes dark parks and offices that are empty in the evening. Living on the Singel, apart from the traffic, is very nice because you can (run) along the Singel in the greenery straight away. Hygiene is fine. The bins are not often too full.
Auto-translated to English by AILiving so close to the city centre has pros and cons. Main con is noise. But we love how walkable this neighborhood is to everything in the city centre. We can't imagine living the same lifestyle if we live further away.
Auto-translated to English by AII've lived in the Zeven Steegjes all my life and really enjoy it here
Auto-translated to English by AII've lived here my whole life and have always enjoyed it.
Auto-translated to English by AIIn terms of amenities it's wonderful to live in the centre, but it's also very busy and not accessible by car. Public transport is excellent. I never feel comfortable walking alone late at night because of all the homeless people and creepy individuals. There should be much more green space in the centre for my liking. It could be so much better. We do have a very nice green courtyard at the apartment complex.
Auto-translated to English by AIIt's a nice area to live in. The location is pleasant, but it's the centre so there's almost always noise pollution. Of course that's to be expected. However, the surroundings aren't very hygienic. In the courtyard where we live, there are many restaurants that dump their waste in the alleys. That's a shame.
Auto-translated to English by AIStreet full of shops and cosiness. Nice and bustling sometimes also noisy but that's not the residents' fault haha
Auto-translated to English by AII grew up there. It's quiet. Twijnstraat is beautiful. We hardly have any trouble with Altrecht. It's also nice that that's possible in the city. The neighbours are nice.
Auto-translated to English by AI
The most common type is flats (81%).
Over the past year a home for sale in Binnenstad was listed for an average of €504,383 (€7,381 per m²). Last quarter prices rose by 14%.
A rental home in Binnenstad cost an average of €1,996 per month (€32 per m²).
Residents give Binnenstad a 7.6 out of 10 based on 8 reviews. Amenities stands out with a 8.3; nature and greenery lags behind with a 6.4.
Wijk Binnenstad has 20,190 residents. The largest age group is 25 to 45 years (48%). Notably, 68% of the households are single-person households.
The housing supply in Binnenstad is remarkably efficient: 73% has an A, A+ or B label. The average natural gas consumption per household is 530 m³ per year.
From Binnenstad you can on average reach a supermarket at 0.5 km, a GP at 0.6 km, a railway station at 1.4 km, a primary school at 0.7 km (as the crow flies, source: CBS).
Right now you will find 130 homes for sale and 181 homes for rent in Binnenstad.

Buurtje.nl uses cookies to make the site work and to improve it. In doing so, we process data such as your IP address and the pages you visit.
We use this data for three purposes: running the website (functional), measuring visits so we can improve Buurtje.nl (analytics), and — if you allow it — tailoring ads to your interests (marketing).
How we handle your data is described in our privacy policy. You can change your preferences at any time via 'Cookie preferences' at the bottom of every page.
Choose per category which cookies we may place. Read more in our privacy policy.