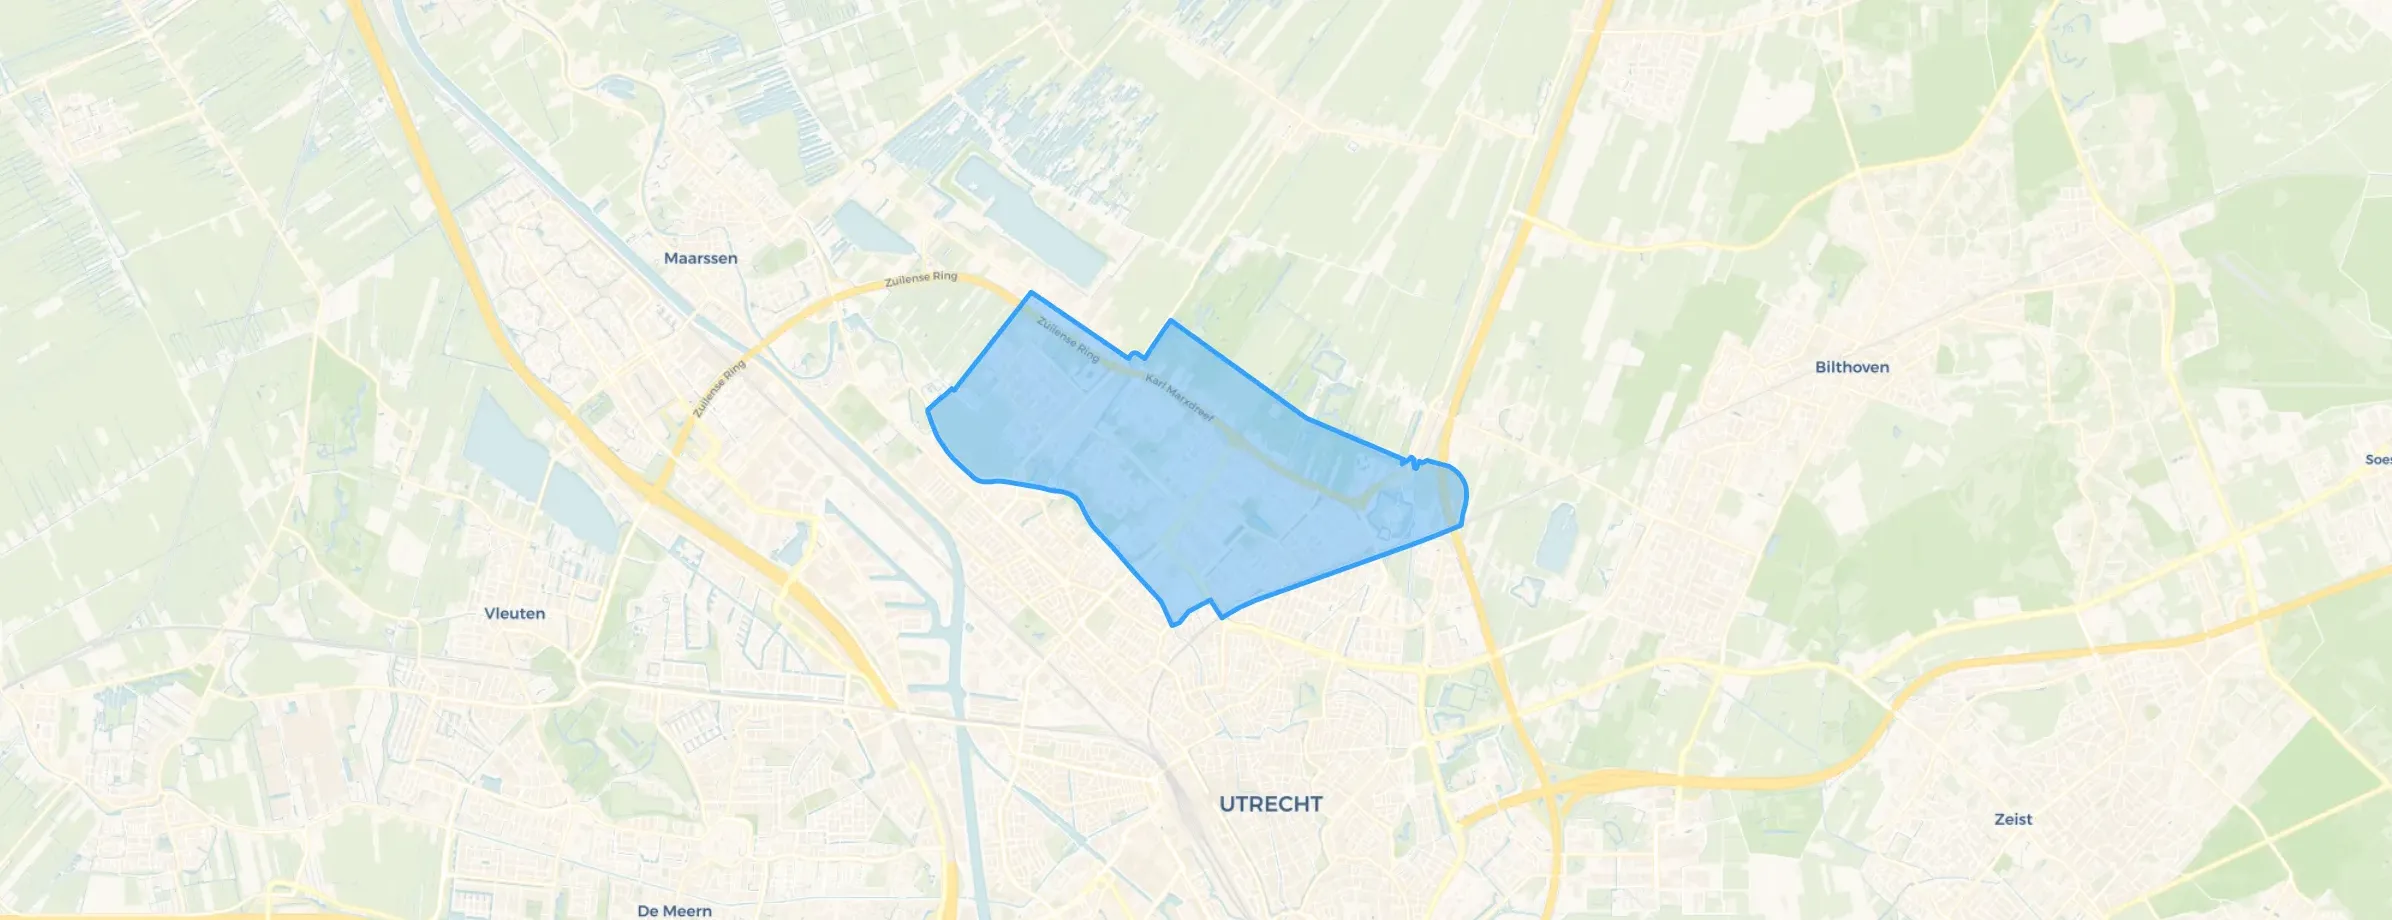
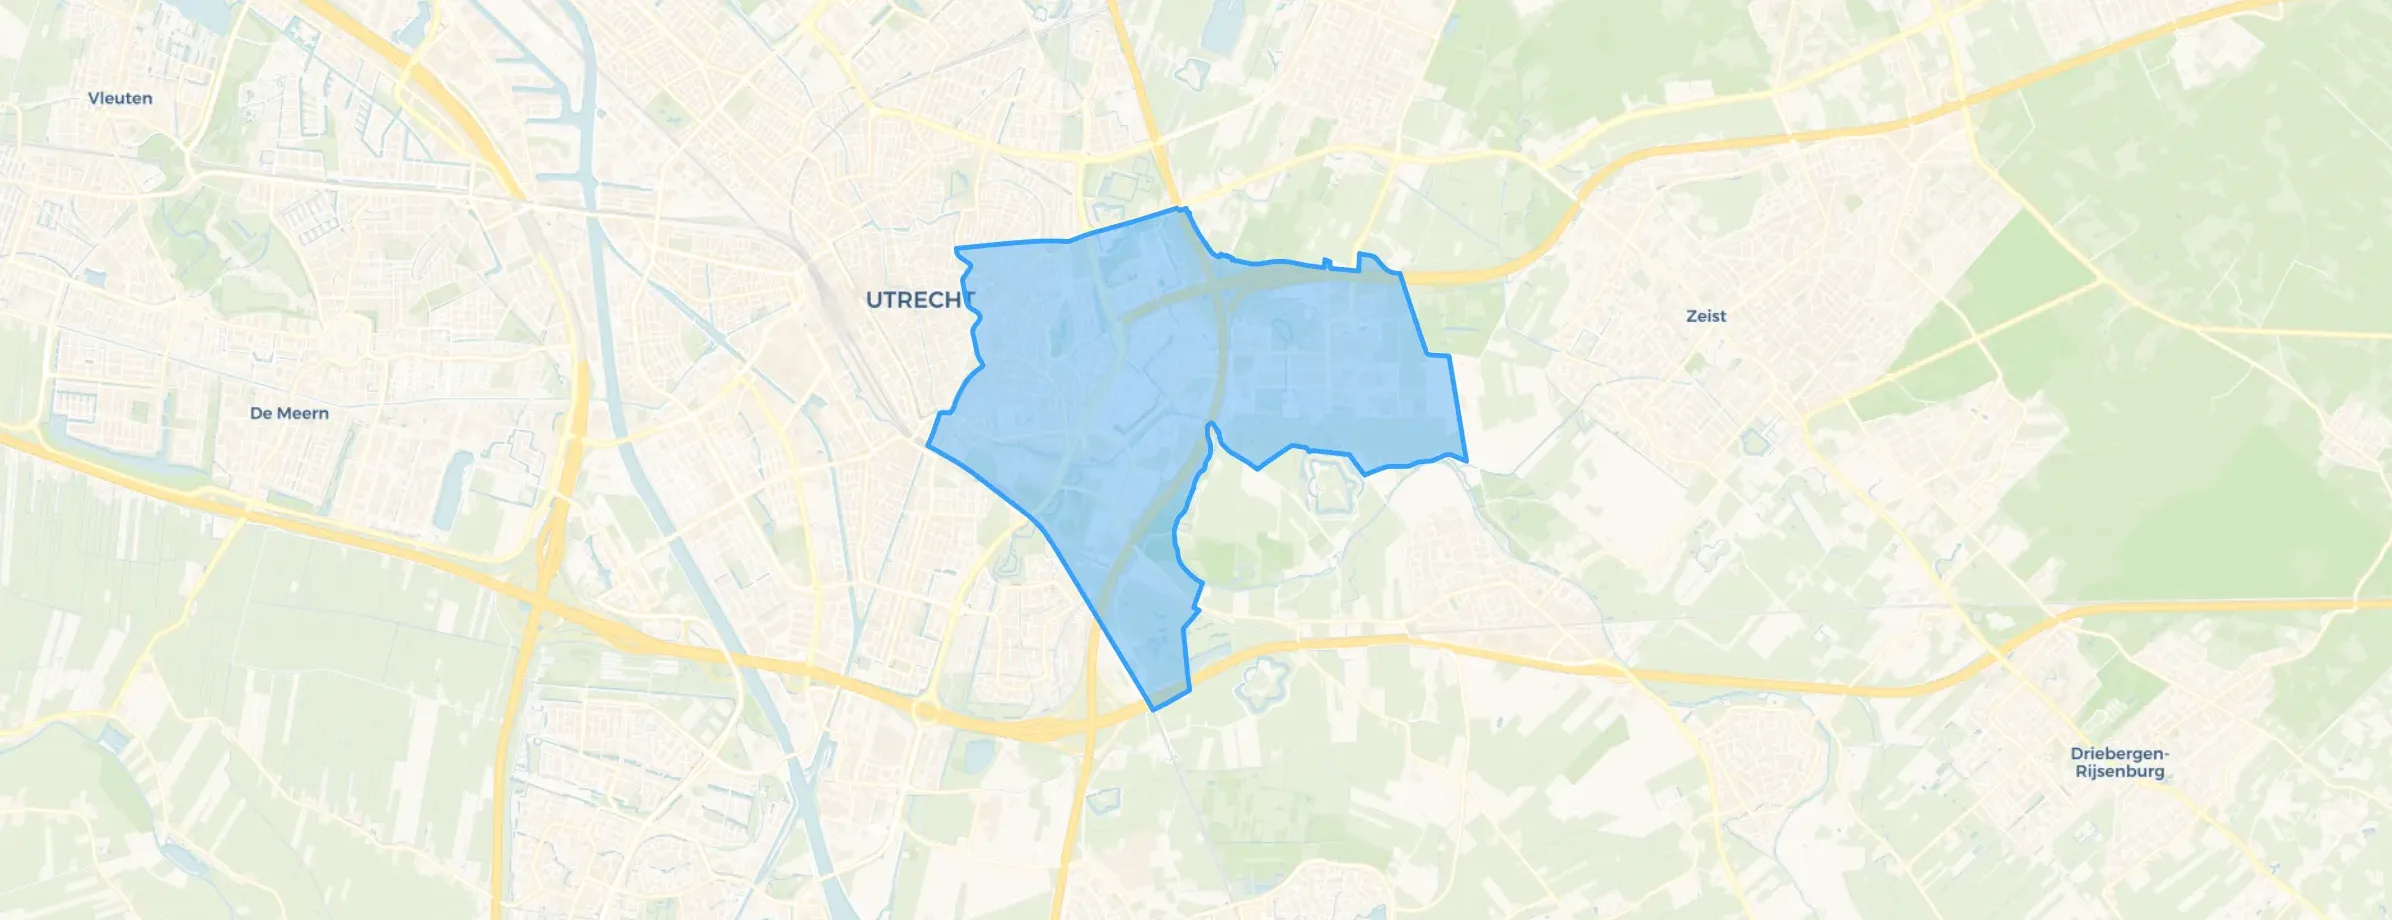
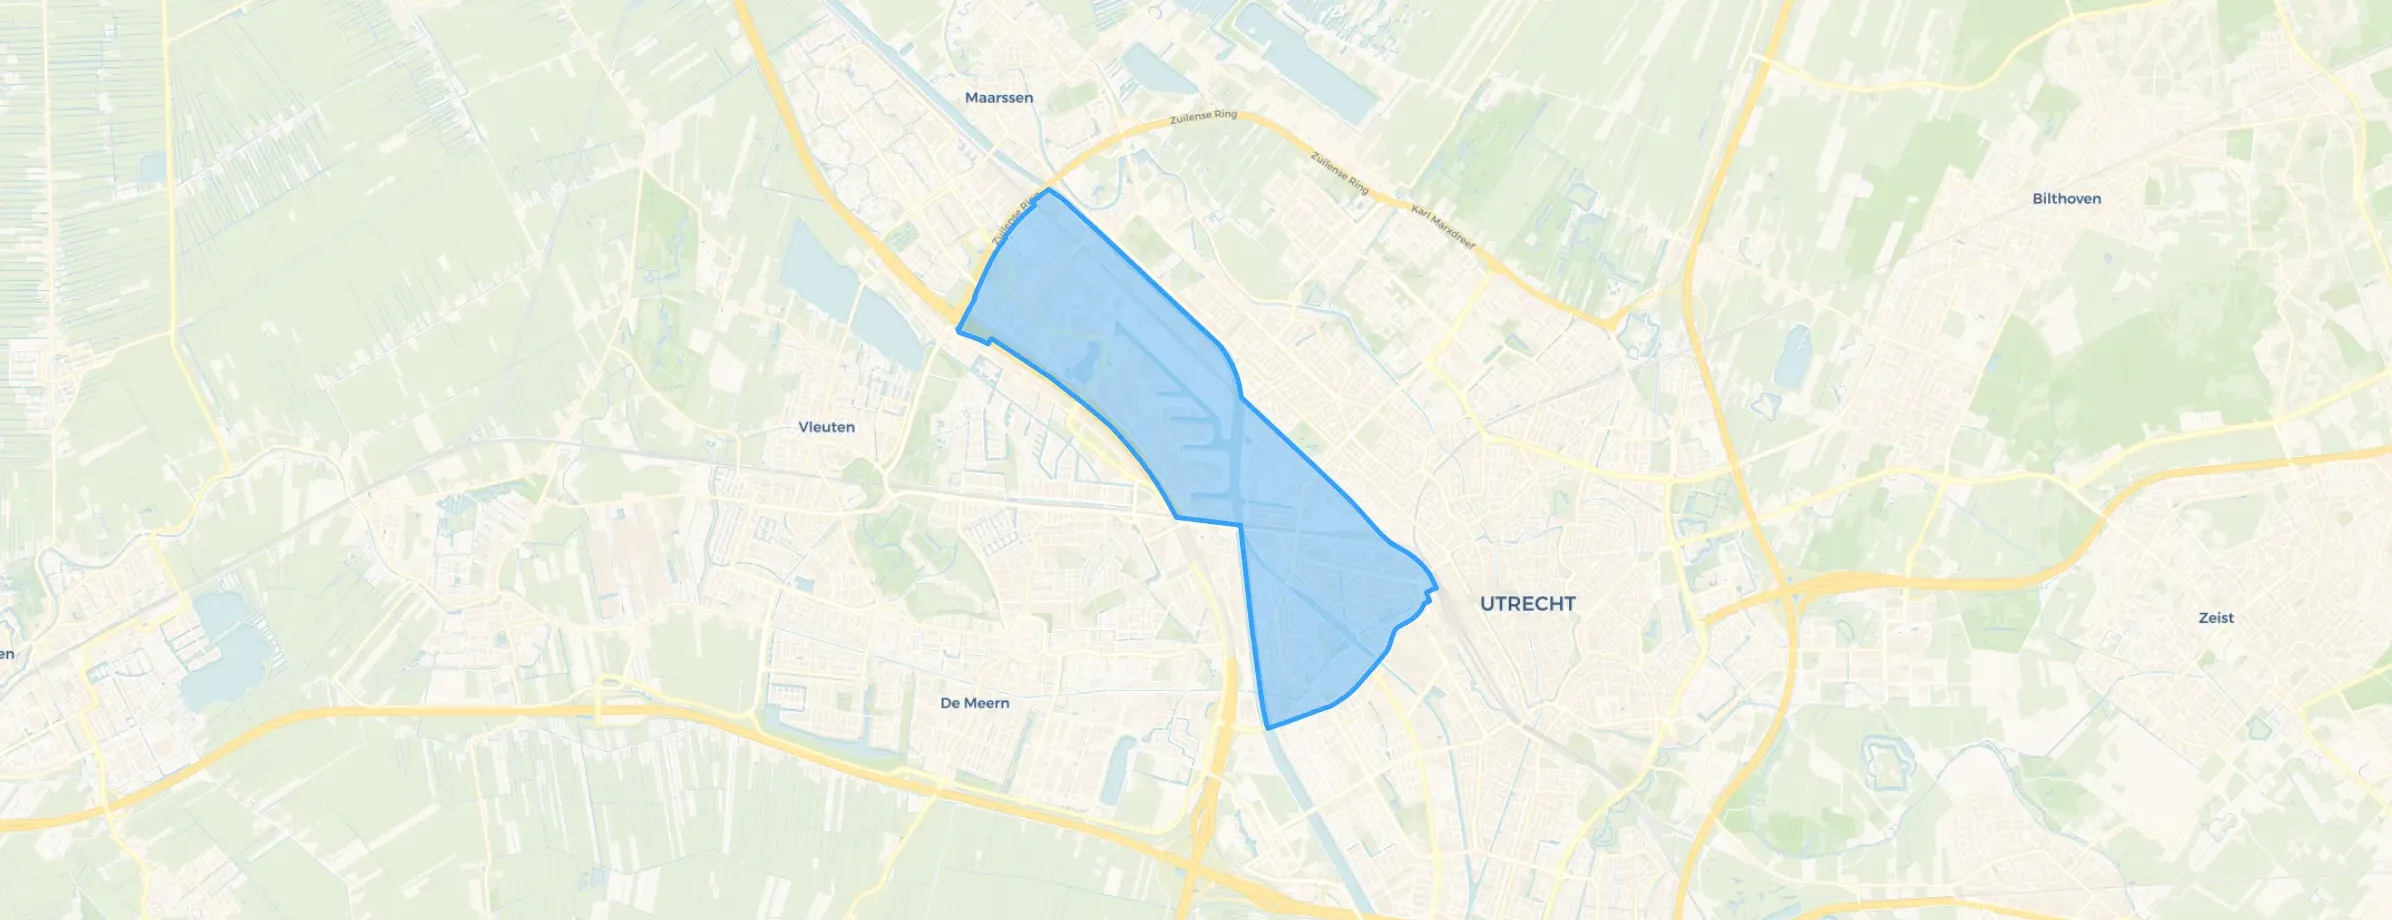
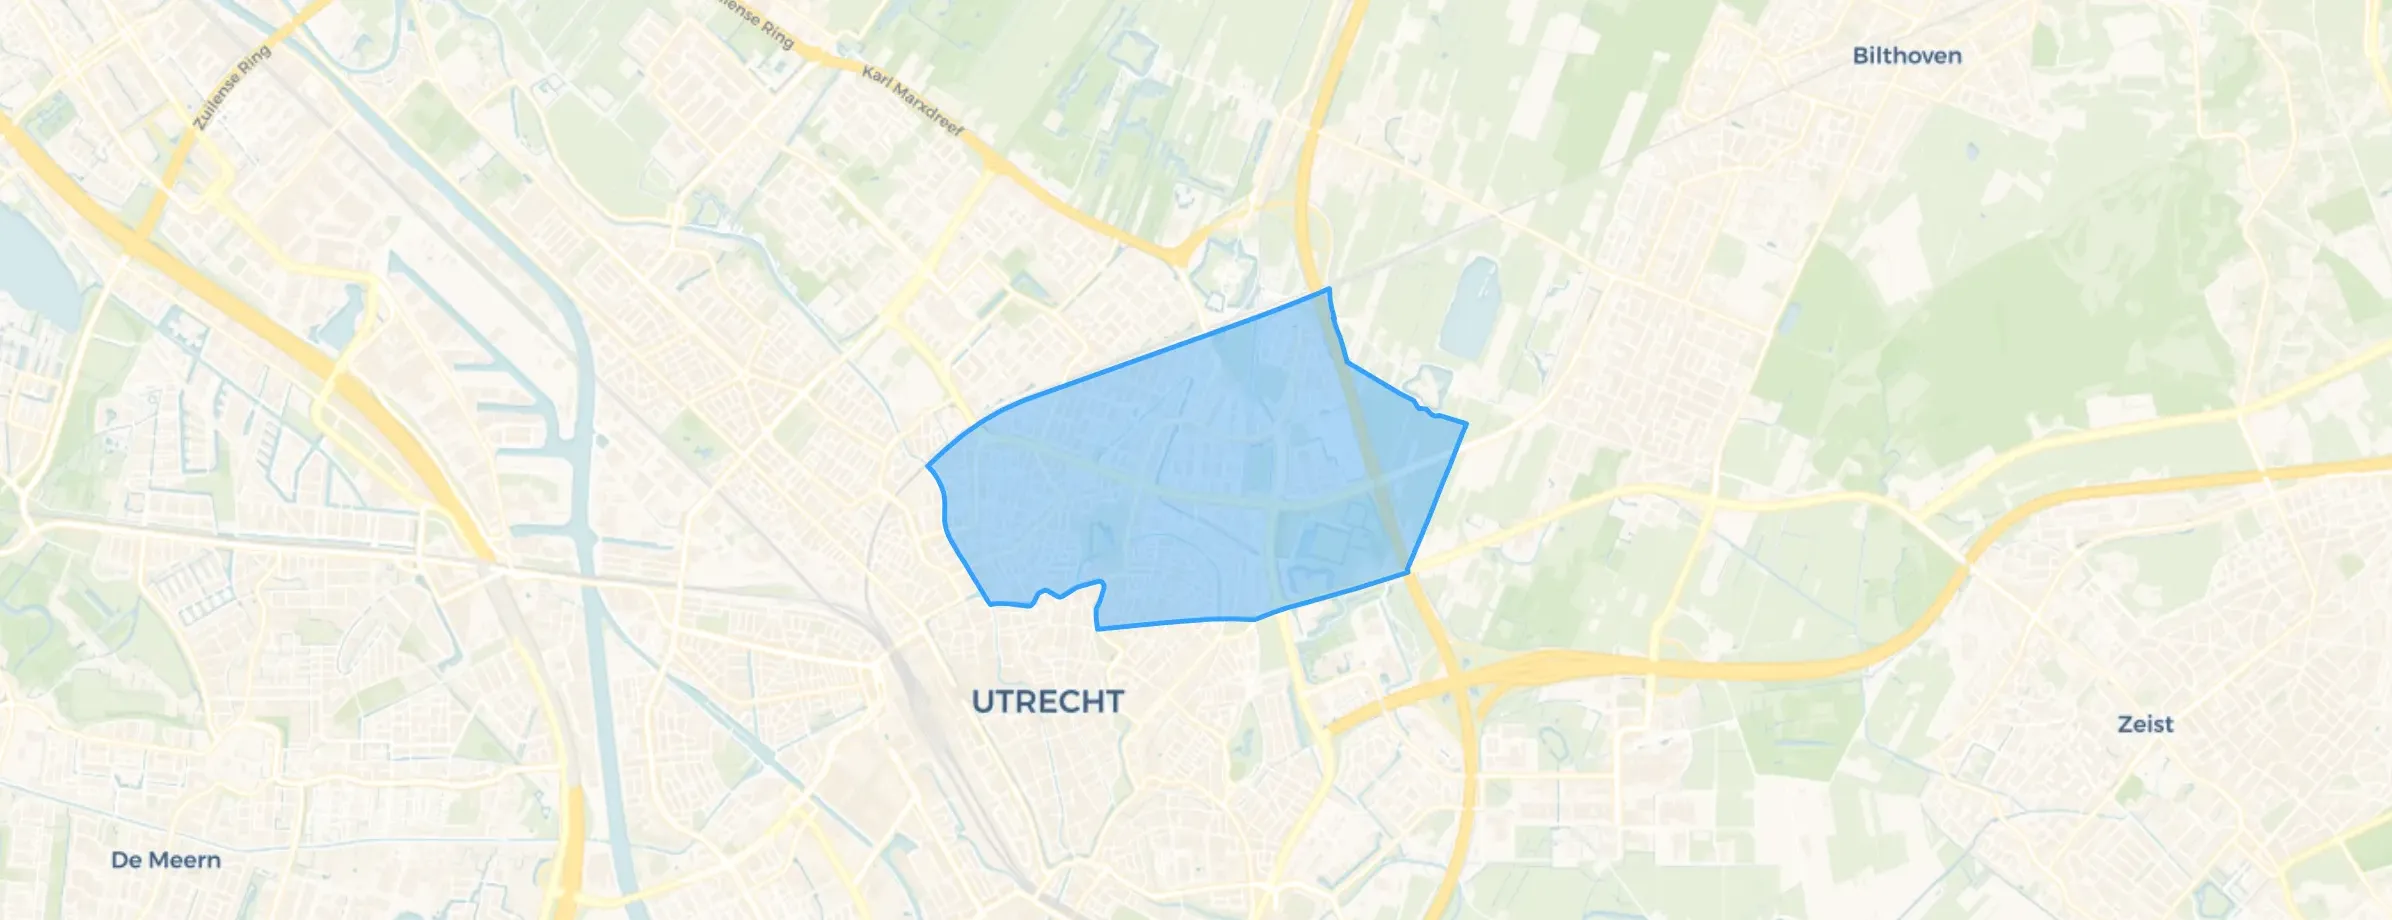
Municipality in Utrecht
Utrecht is located in the province of Utrecht The municipality has a total area of 9.921 hectares, of which 9.377 hectares are land and 544 hectares are water. The municipality is coded as GM0344. The postcode area is 3451AA-3585LR.
Utrecht has 376.757 residents. Of these, 48,9% are men and 51,1% are women. Most residents are 25 to 45 years (36,8%). The other age groups are 21,3% for '45 to 65 years', 15,6% for '0 to 15 years', 15,3% for '15 to 25 years' and 11,0% for '65 years or older'. Of the residents, 65,5% is unmarried, 26,3% is married, 5,7% is divorced and 2,5% is widowed. 222.747 residents originate from the Netherlands, 41.247 come from Europe and 112.763 come from countries outside Europe.
There are 194.040 households in Utrecht. 51,6% of these are single-person households, 22,4% households without children and 26,0% households with children. The average household size is 1,9 persons. The national average is 2,1 persons.
In Utrecht there are 299.500 income recipients. The average income per income recipient is €47.000, which is €4.800 (11%) higher than the national average of €42.200. Per resident, the average income is €38.500, which is €3.600 (10%) higher than the national average of €34.900. Most residents of Utrecht are highly educated. 55,2% have a university or higher professional education (HBO/WO), 26,7% have an intermediate education (HAVO, VWO or MBO 2-4) and 18,0% have a lower education (VMBO or MBO 1).
Of the 376.757 residents, around 75% are in paid employment, which amounts to 282.568 people. This is 3% higher than the national average of 72%. The majority of workers are in salaried employment (84%), while 16% are self-employed. In Utrecht, 17% of residents receive a benefit. The largest group is those receiving a state pension (AOW). 36.440 people receive this benefit.
In Utrecht there are 168.736 homes with an average assessed value (WOZ) of €490.000. Of these, around 96% are occupied and 4% unoccupied. Most homes are rental properties. This amounts to 55% rental homes and 45% owner-occupied homes. Of the homes, 45% privately owned, 31% owned by housing associations and 24% owned by other landlords. The most common construction periods in Utrecht are 1950-1970 (20%) and 1900-1925 (13%).
There are currently no homes for sale in Utrecht. The most recently listed home is Wittevrouwensingel 58 by LEF Makelaars & Taxateurs. No homes were sold in Utrecht over the past year.
There are currently no homes for rent in Utrecht. The most recent home is Hendrick de Keyserstraat 32, offered by Your-House. No homes were let in Utrecht over the past year.
No recent rental data available for Utrecht.
In Utrecht there are 124.205 addresses with a registered energy label. The most common labels are A (37%), C (16%) and B (11%). On average, an address in Utrecht uses 2.140 kWh of electricity per year. This is 16% below the national average of 2.550 kWh. With an annual consumption of 500 m³ per address, natural gas consumption is 38% below the national average of 800 m³.

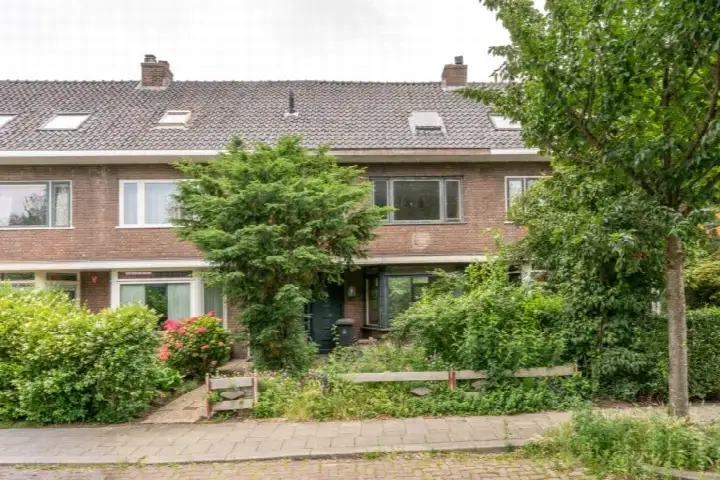
Rustige woonwijk en op loopafstand van de stad. Buurt bestaat uit van alles (gezinnen, stellen en alleenstaanden, af en toe een student of een expat). Dat gaat allemaal goed samen en brengt wel een gezellige sfeer. Parkeerplekken zijn er iets te weinig van maar dat lossen ze hier gewoon op door de stoep te gebruiken. Als niemand er last van heeft vinden ze het hier allemaal wel prima. Mooi wijkie.
Auto-translated to English by AIDe Nieuwegracht is een rustige en schone kant van het centrum van Utrecht. Aan de overkant ligt een mooi park en een grote weide. Hier is het over het algemeen rustig, soms helaas niet heel schoon. Op de wandelpaden liggen op sommige plekken erg veel sigaretten. De buurt is erg goed bereikbaar op de fiets en te voet. De auto is niet aan te raden, hoewel de Nieuwegracht in vergelijking met de Oudegracht en Twijnstraat veel makkelijker is voor auto's.
Auto-translated to English by AILeuke gemixte buurt waar mensen oog voor elkaar hebben en het rustig wonen is. Het grootste voordeel is dat alle voorzieningen dichtbij zijn zoals Leidsche Rijn centrum, winkelcentrum parkwijk, bushalte, treinstation, scholen, sportclubs, parken, bioscoop en horeca.
Auto-translated to English by AIHeerlijk rustige buurt op slechts 20 minuten afstand van het centrum van Utrecht. Park Hoge Weide, scholen, supermarkten en sportvoorzieningen zijn om de hoek.
Auto-translated to English by AIThe neighborhood is considered safe, has an active and engaged community, and is well maintained. Neighborhood relations are good. Residents have access to quality housing, reputable schools, and attractive green spaces such as Wilhelminapark, Oosterspoorbaan and Minstroom. The centre is within reach, and Oost offers a nice number of shops.
Auto-translated to English by AICosy, student-like, park on the doorstep, where people sit when the weather is nice. Pub in the neighbourhood, shopping centre within walking distance and Kanaalstraat nearby.
Auto-translated to English by AILunetten zuid is a fairly extensive area, but there are common characteristics: There is little traffic on the streets, even the ring road is relatively quiet. Many houses are situated around a shared green space with some play facilities. This quickly creates a bond with the neighbours. Because Lunetten is separated from the city by a park and forts, which are part of the UNESCO heritage, it has some village-like features. If you value your privacy and don't like contact, then Leidsche rijn is more likely a place where you'll feel at home. Lunetten is not a place of high fences, but rather has a scent of granola with a hint of wokeness. If you feel at home with that, you are very welcome, but if you are not willing to do something for the neighbourhood or your neighbours, there are plenty of other places where you will feel at home.
Auto-translated to English by AII've lived in Zuilen for 26 years and still consider it one of the best neighbourhoods in Utrecht. With shops, schools, buses and the train station all nearby, everything is within reach. And with the beautiful Julianapark just around the corner, the area also has a lovely place to relax. As far as I'm concerned, an absolute top location.
Auto-translated to English by AIThe most common type is flats (62%).
Over the past year a home for sale in Utrecht was listed for an average of €549,814 (€6,191 per m²).
A rental home in Utrecht cost an average of €1,891 per month (€25 per m²). That is 12% below the national average.
Residents give Utrecht a 7.5 out of 10 based on 123 reviews. Especially accessibility (8.3) scores well; cleanliness (6.8) receives the lowest rating.
Gemeente Utrecht has 376,757 residents. The largest age group is 25 to 45 years (37%). Notably, 52% of the households are single-person households.
The housing supply in Utrecht is remarkably efficient: 62% has an A, A+ or B label. The average natural gas consumption per household is 500 m³ per year.
From Utrecht you can on average reach a supermarket at 0.7 km, a GP at 0.7 km, a railway station at 2.0 km, a primary school at 0.6 km (as the crow flies, source: CBS).
Right now you will find 1,811 homes for sale and 540 homes for rent in Utrecht.