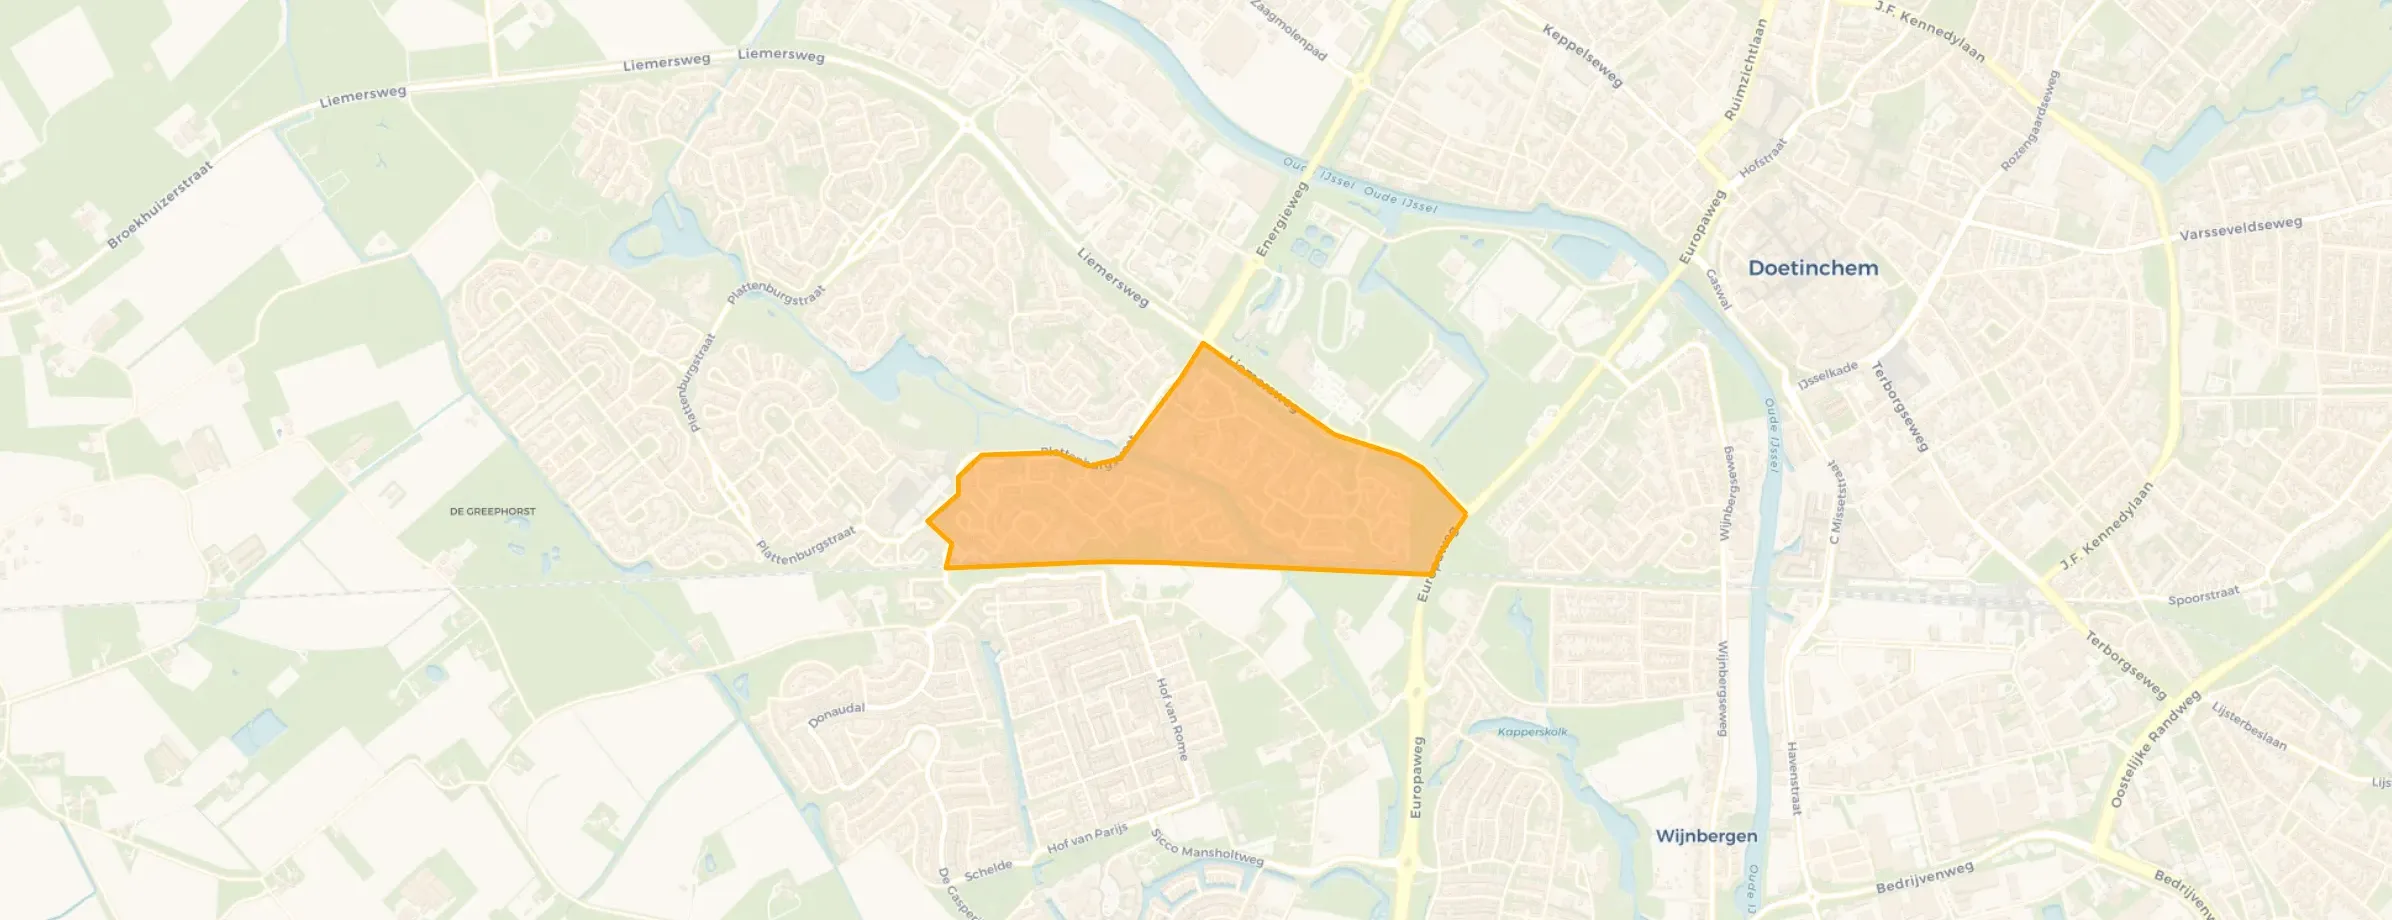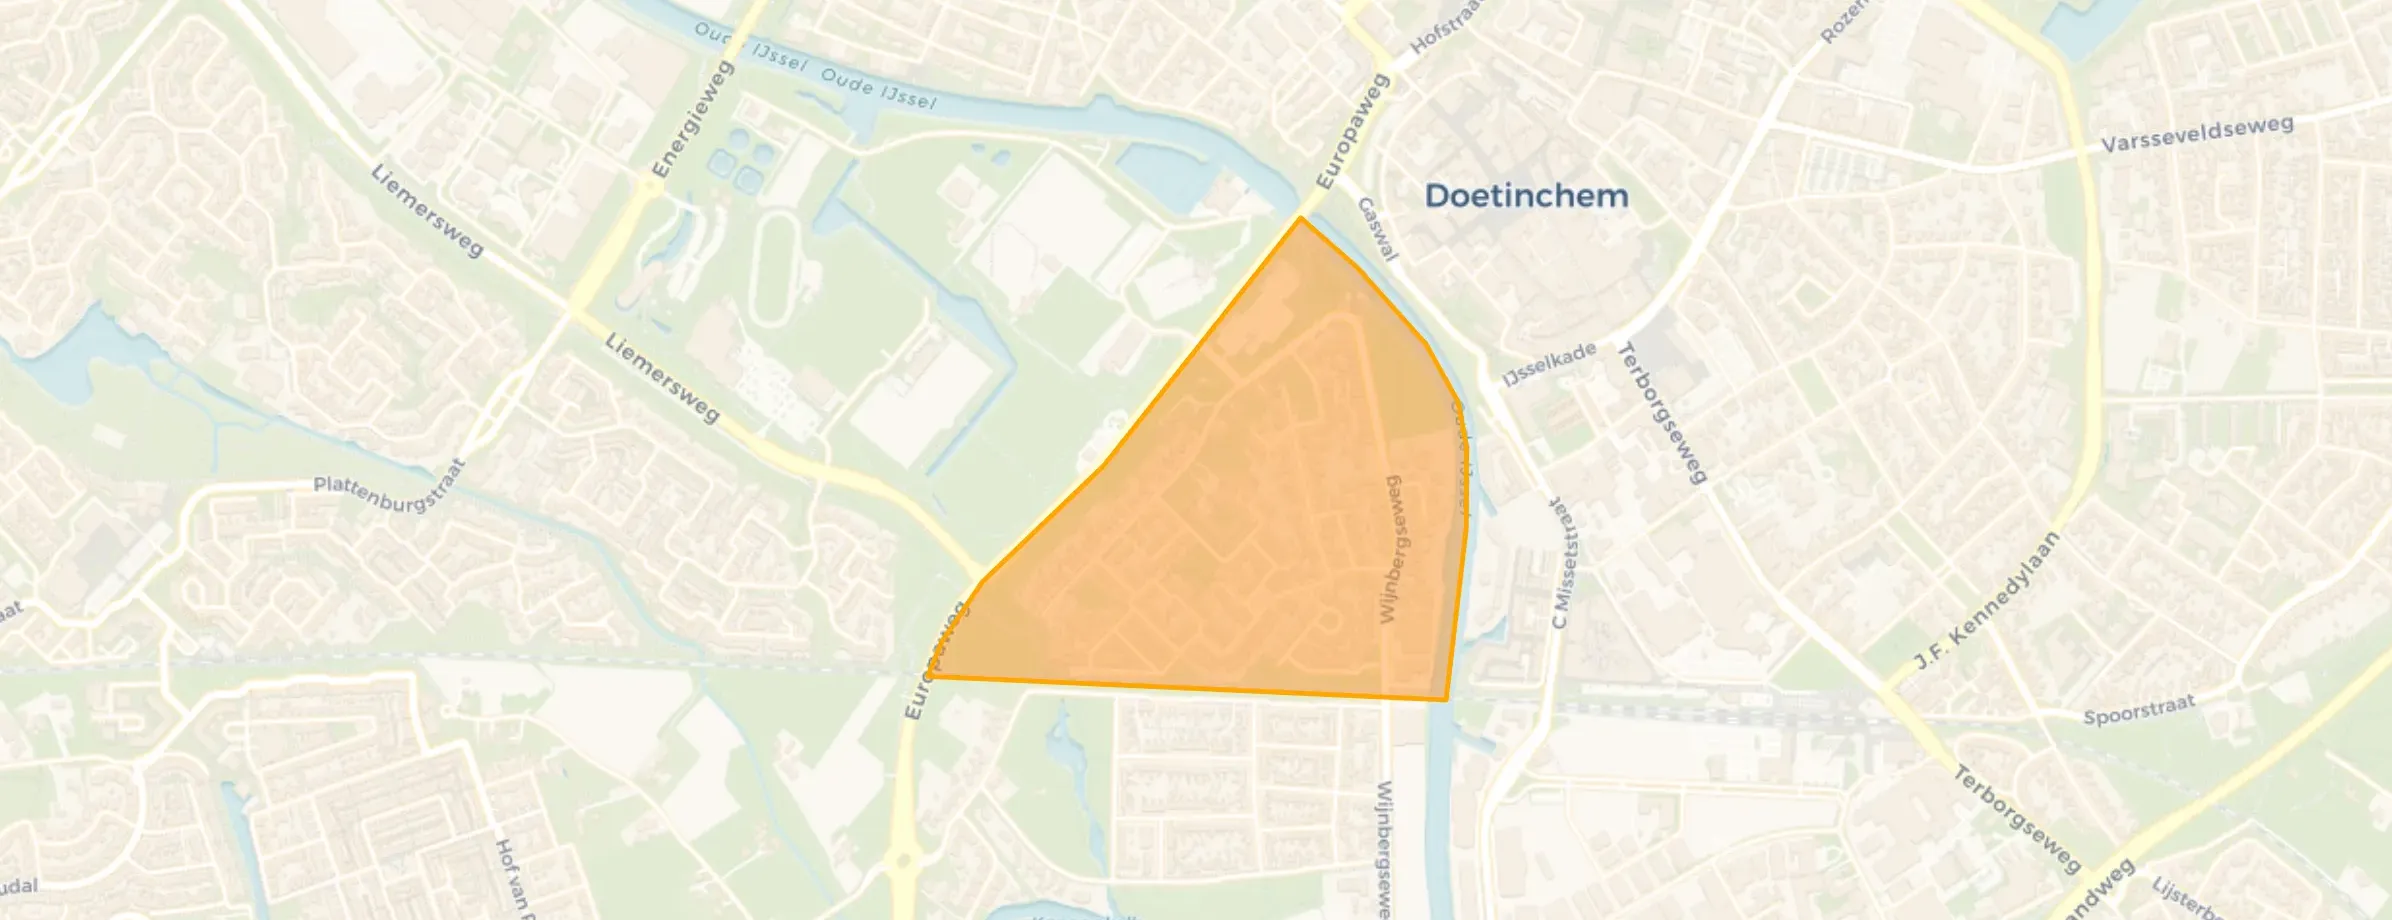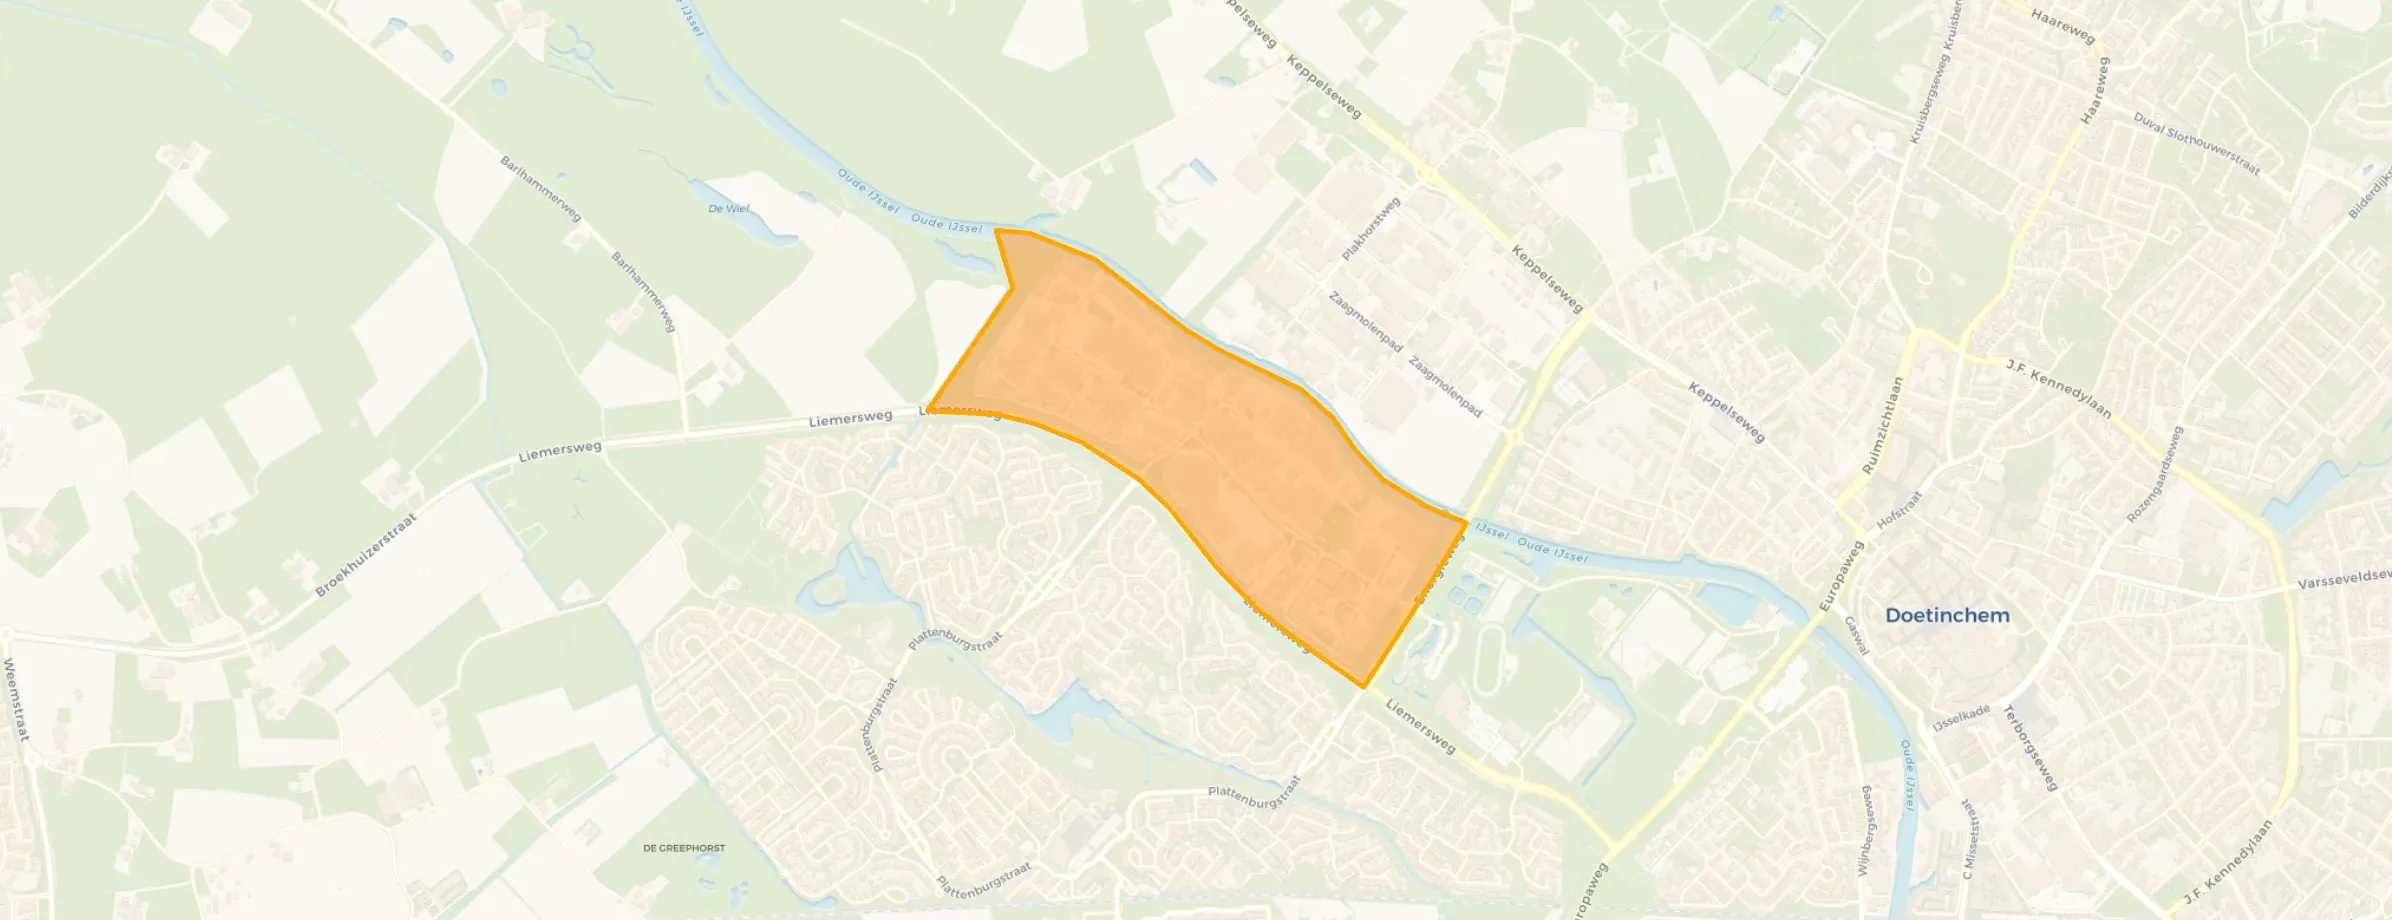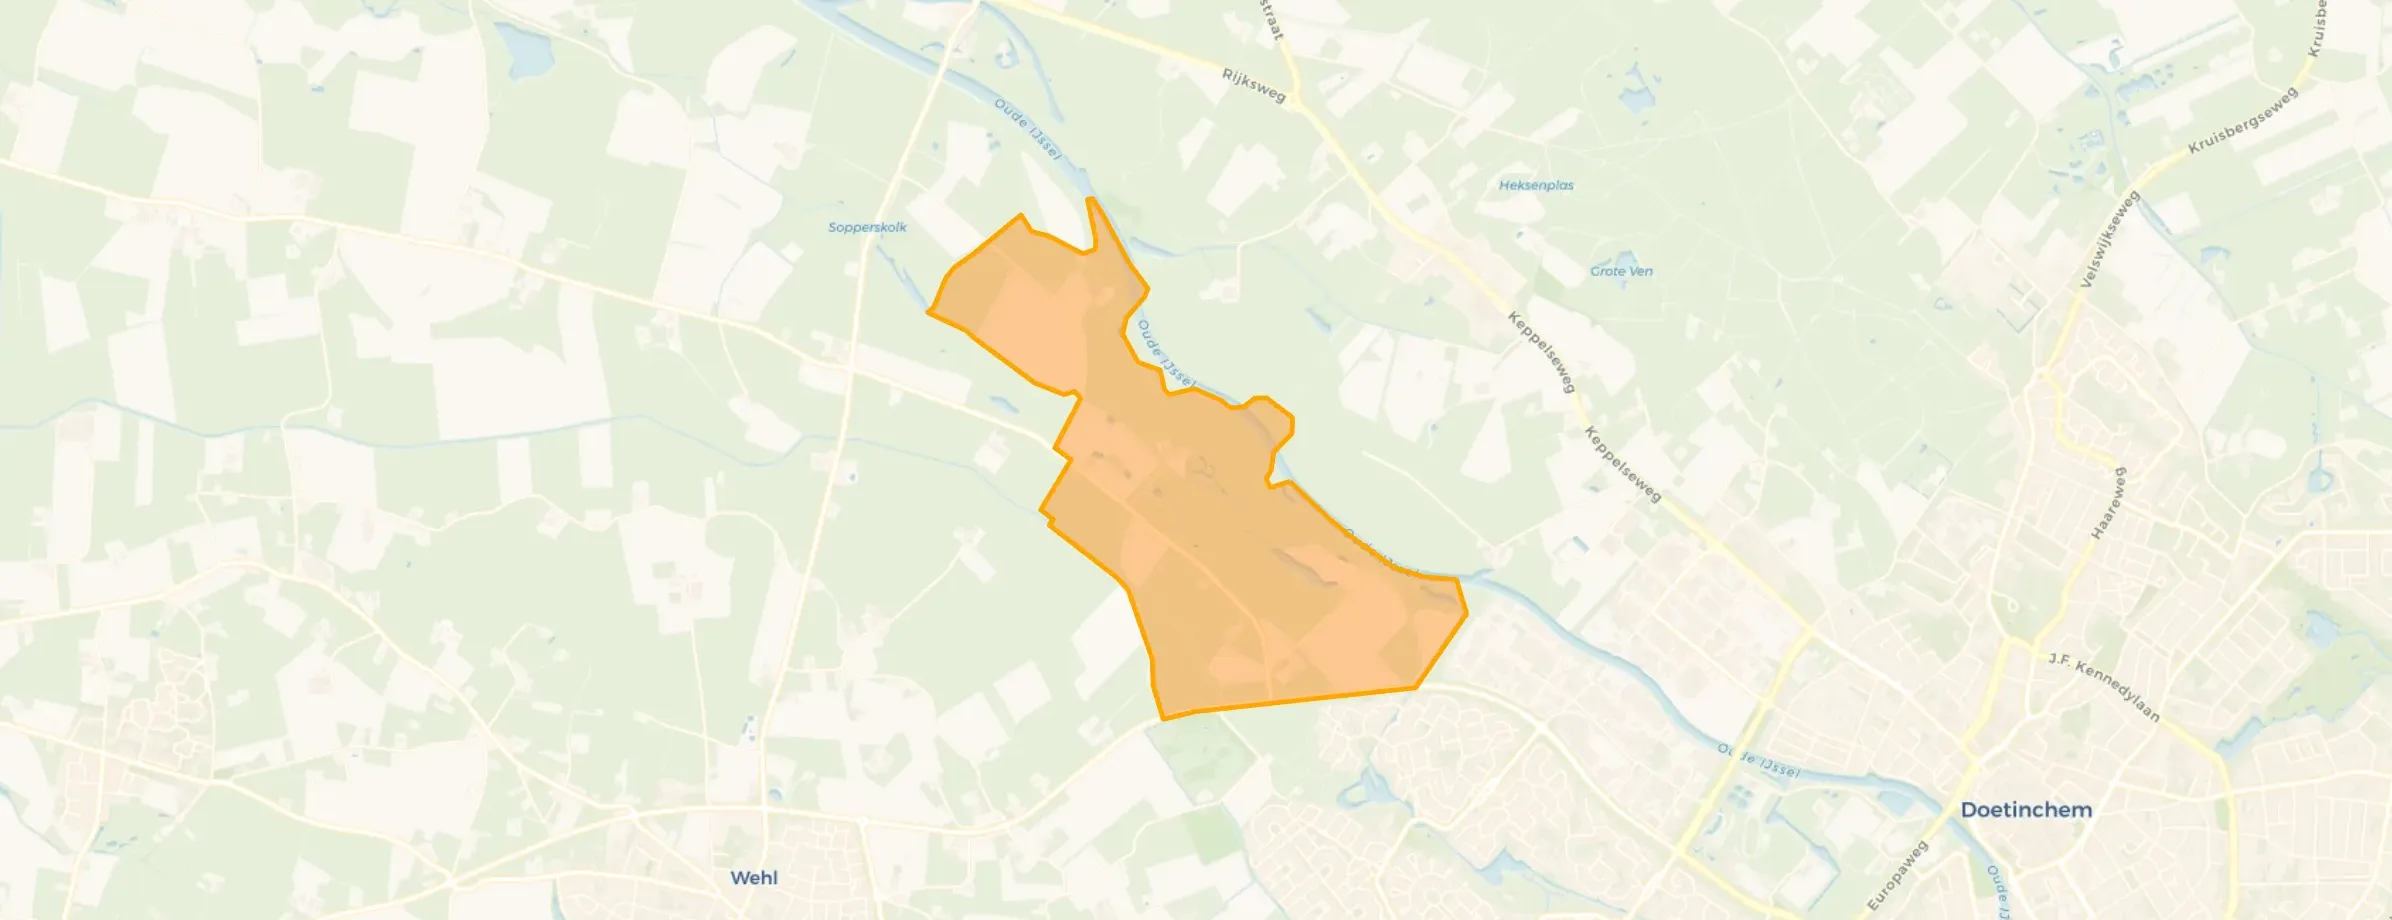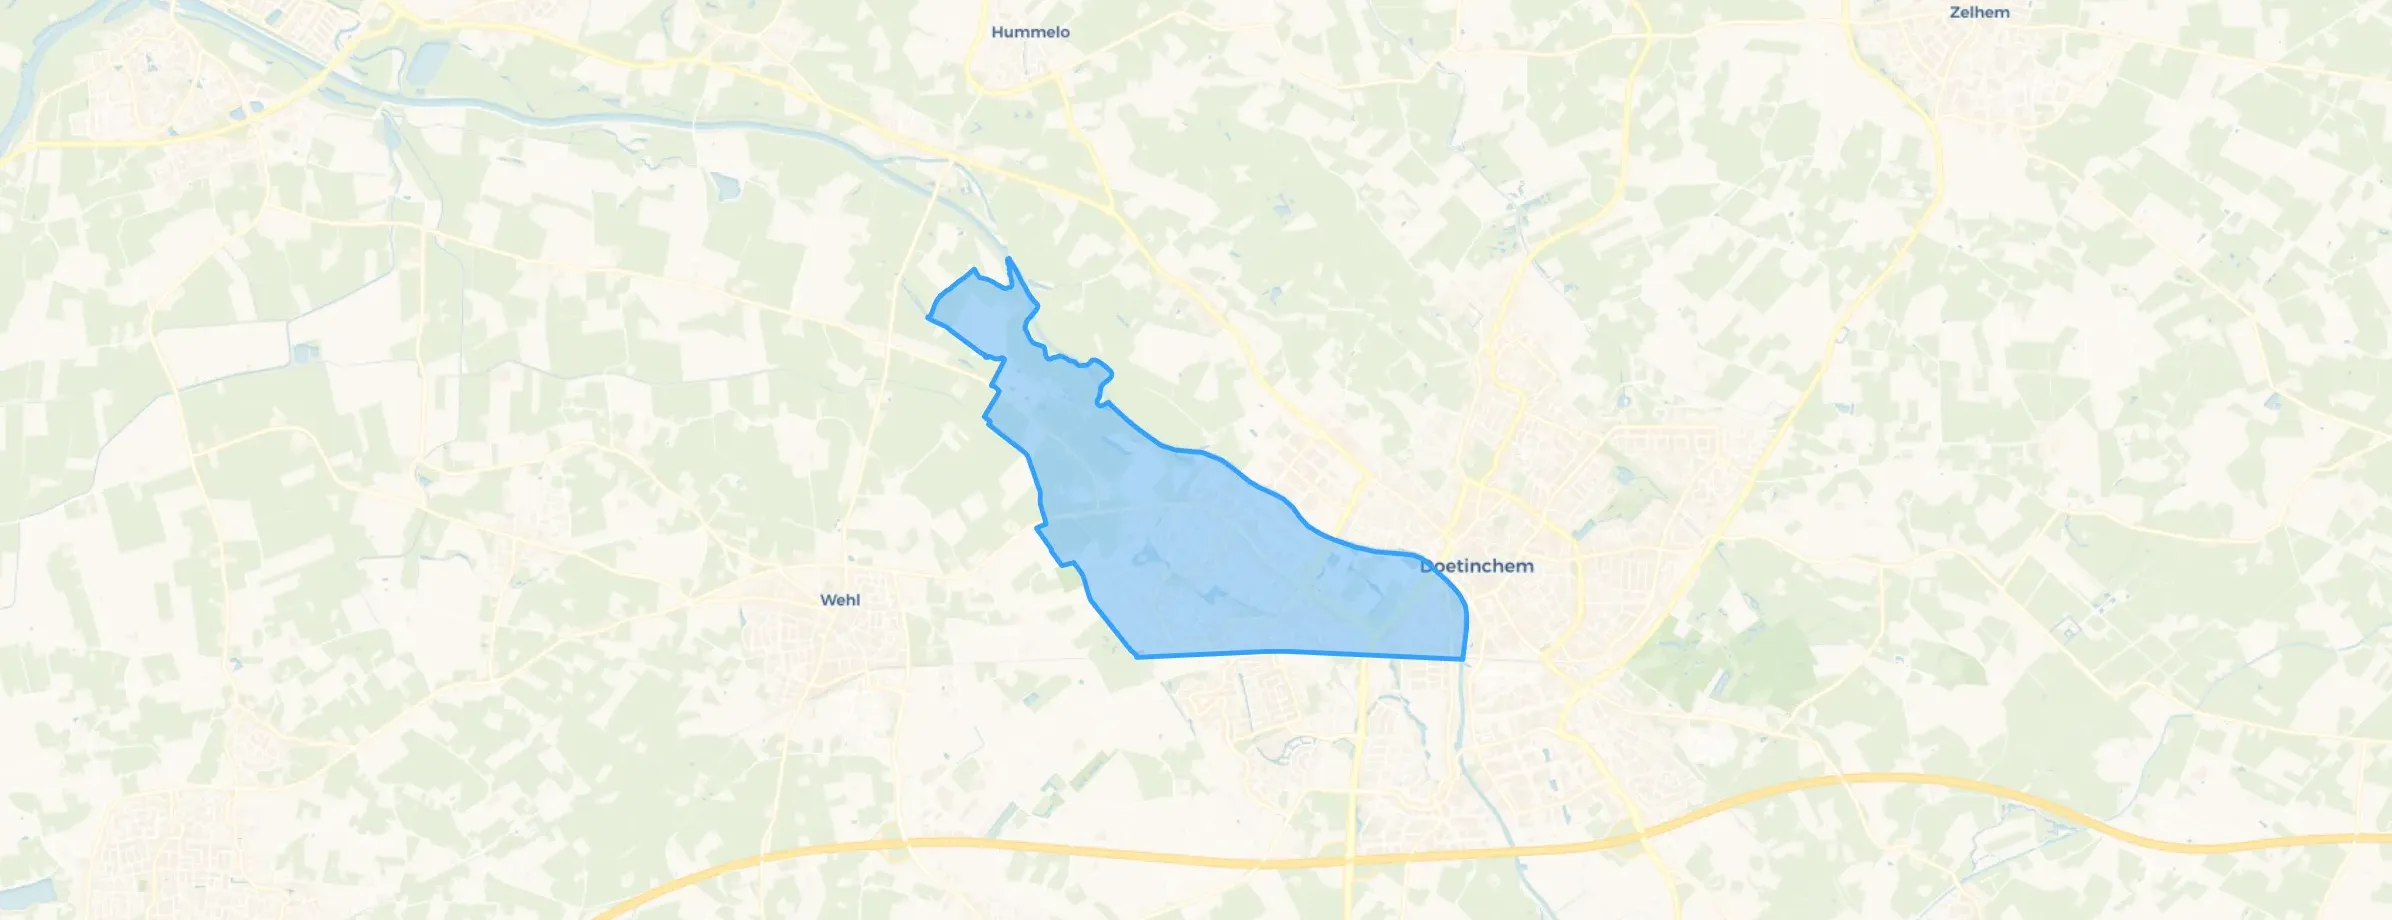
District in Doetinchem
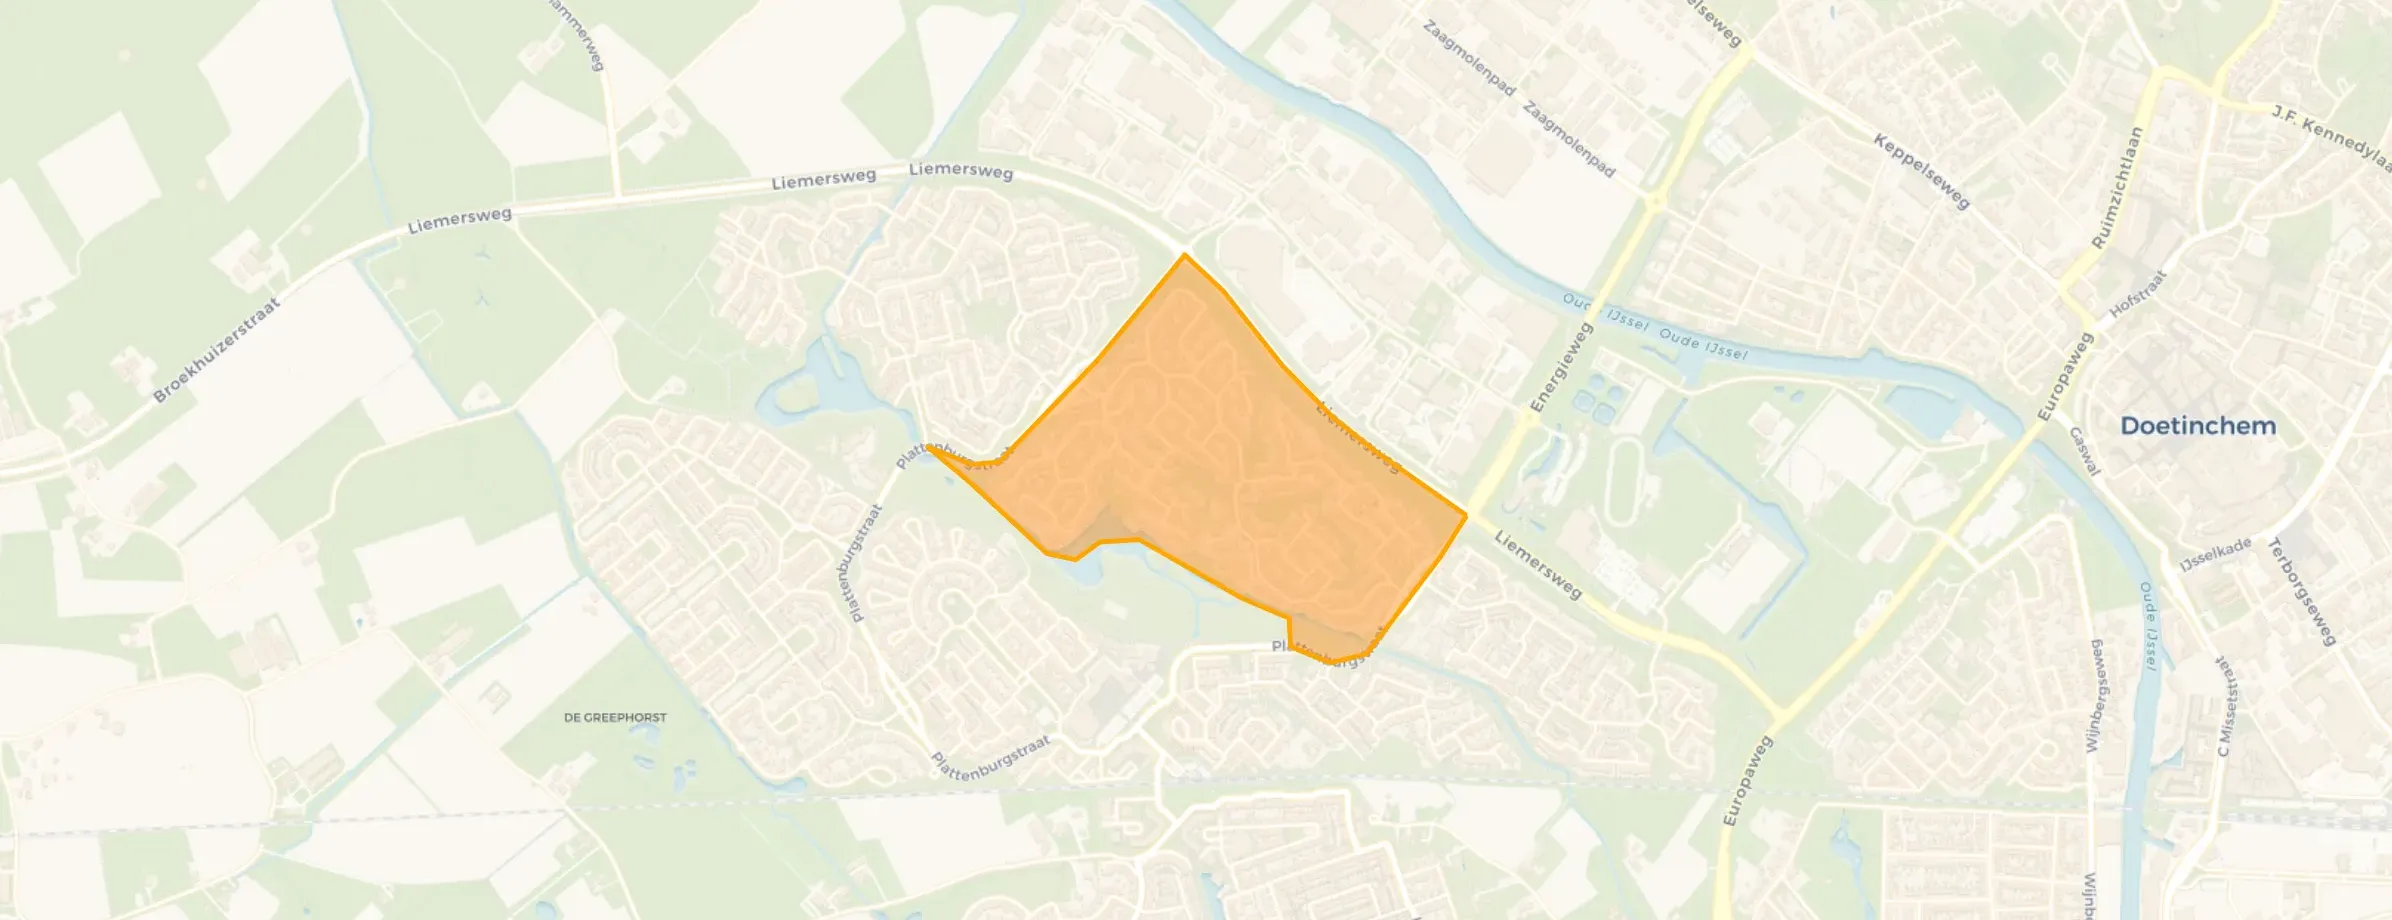
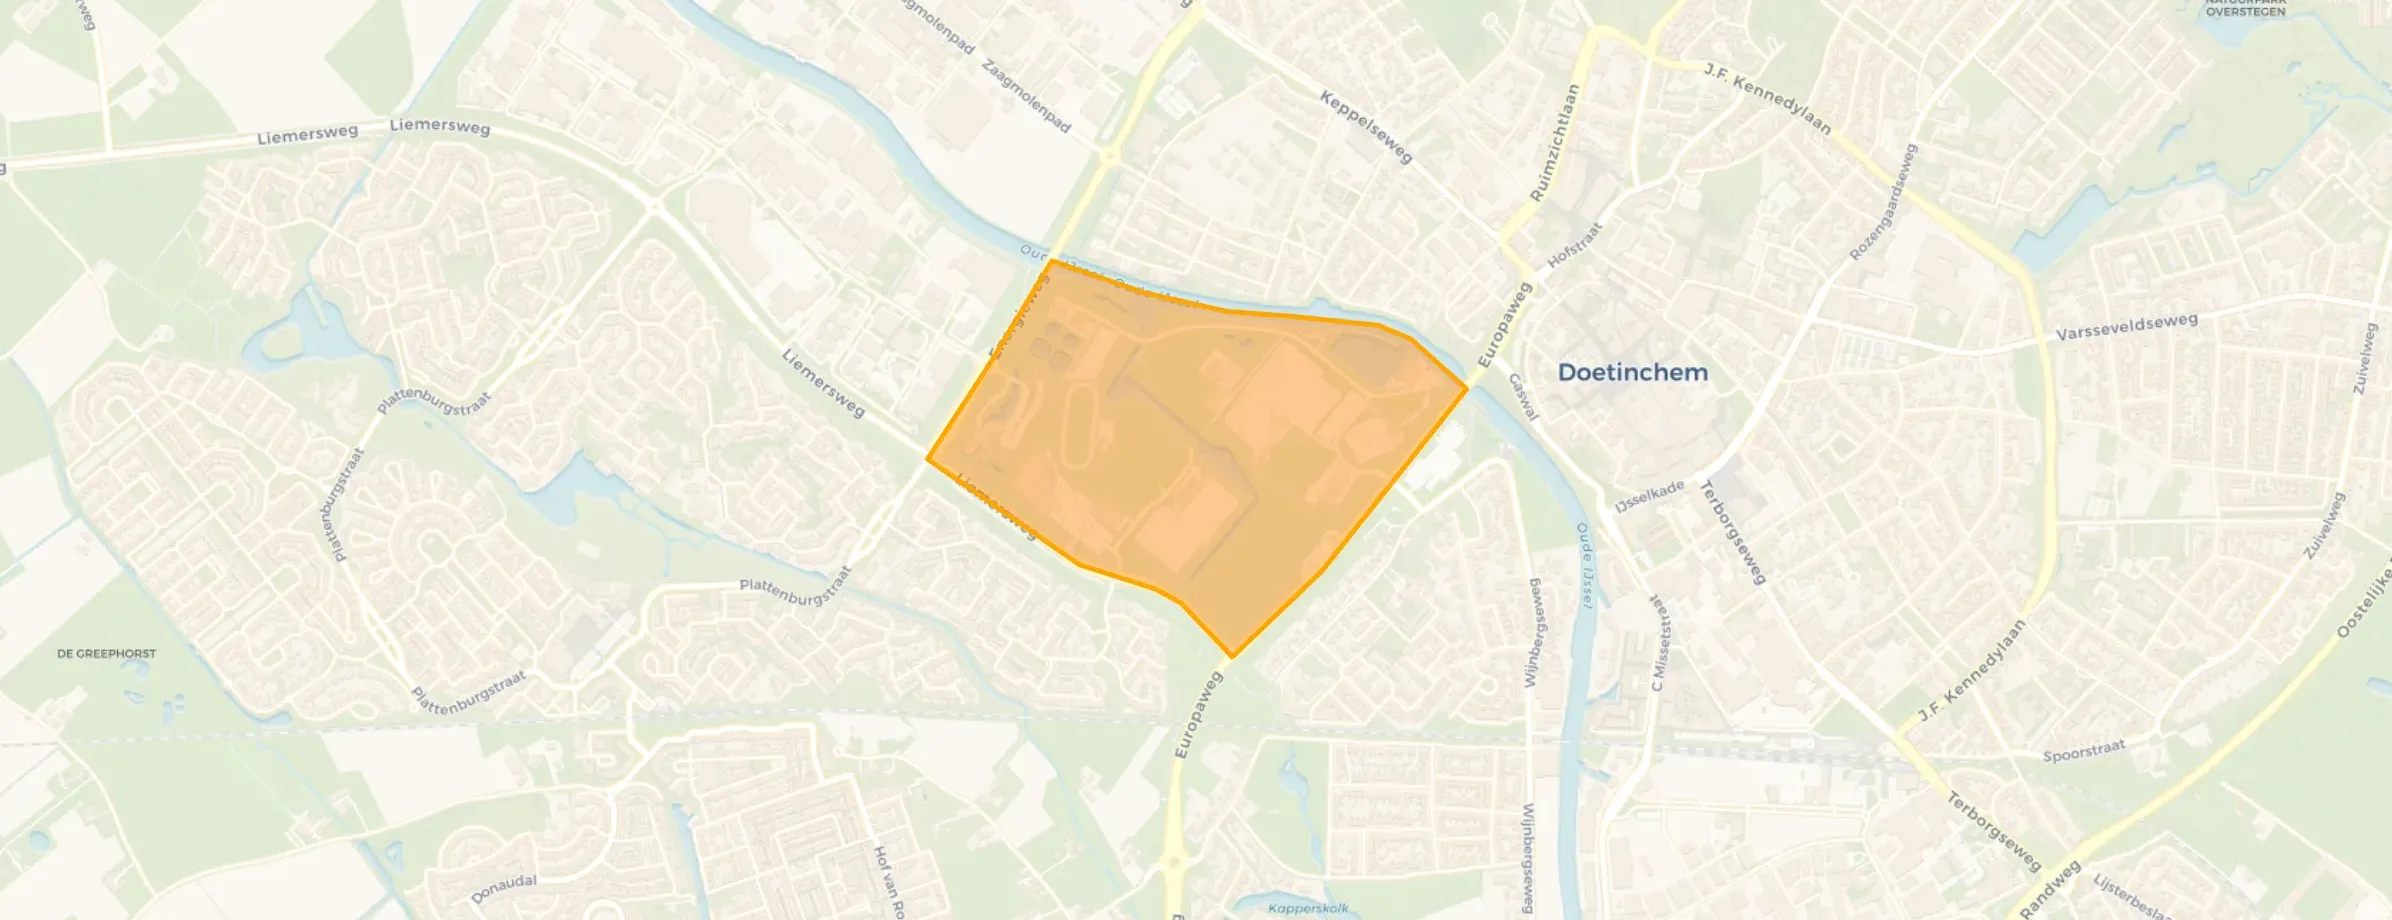
De Huet is located in the province of Gelderland, in the municipality of Doetinchem The district has a total area of 546 hectares, of which 526 hectares are land and 20 hectares are water. The district is coded as WK022206. The postcode area is 7006AA-7006VT.
De Huet has 9.910 residents. Of these, 49,2% are men and 50,7% are women. Most residents are 45 to 65 years (29,8%). The other age groups are 22,0% for '25 to 45 years', 21,6% for '65 years or older', 15,0% for '0 to 15 years' and 11,6% for '15 to 25 years'. Of the residents, 45,0% is unmarried, 42,4% is married, 8,7% is divorced and 3,9% is widowed. 8.250 residents originate from the Netherlands, 795 come from Europe and 870 come from countries outside Europe.
There are 4.465 households in De Huet. 32,0% of these are single-person households, 33,5% households without children and 34,5% households with children. The average household size is 2,2 persons.
In De Huet there are 8.100 income recipients. The average income per income recipient is €34.900, which is €900 (3%) lower than the national average of €35.800. Per resident, the average income is €28.900, which is €300 (1%) lower than the national average of €29.200. Most residents of De Huet are educated to an intermediate level. 51,7% have an intermediate education (HAVO, VWO or MBO 2-4), 27,6% have a university or higher professional education (HBO/WO) and 20,7% have a lower education (VMBO or MBO 1).
Of the 9.910 residents, around 65% are in paid employment, which amounts to 6.442 people. This is 0% lower than the national average of 65%. The majority of workers are in salaried employment (88%), while 12% are self-employed. In De Huet, 25% of residents receive a benefit. The largest group is those receiving a state pension (AOW). 1.810 people receive this benefit.
In De Huet there are 4.485 homes with an average assessed value (WOZ) of €288.000. Of these, around 97% are occupied and 3% unoccupied. Most homes are owner-occupied. This amounts to 33% rental homes and 67% owner-occupied homes. Of the homes, 67% privately owned, 20% owned by housing associations and 13% owned by other landlords. The most common construction periods in De Huet are 1980-1990 (60%) and 1990-2000 (19%).
There are currently no homes for sale in De Huet. The most recently listed home is Onstein 55 by BMV Makelaars. No homes were sold in De Huet over the past year.
There are currently no homes for rent in De Huet. The most recent home is Rode-Kruisplein 59, offered by www.thuisindeachterhoek.nl. No homes were let in De Huet over the past year.
No recent rental data available for De Huet.
In De Huet there are 4.613 addresses with a registered energy label. The most common labels are C (56%), B (24%) and A (10%). On average, an address in De Huet uses 2.590 kWh of electricity per year. This is 8% below the national average of 2.810 kWh. With an annual consumption of 1.040 m³ per address, natural gas consumption is 19% below the national average of 1.280 m³.
Nice neighbourhood, still no problems after almost 15 years. Always something to see.
Auto-translated to English by AII'm not from Brakkenstein myself, but I'm walking through this neighbourhood for half a year for school. During our research, we made contact with Brakkenstein residents and businesses located in Brakkenstein. We experienced this positively; the people are friendly and happy to chat. They are interested and willing to cooperate! Many activities are organised for the Brakkenstein residents. Many of these are well attended, which can lead to more connection within the Brakkenstein neighbourhood.
Auto-translated to English by AIA nice neighbourhood in itself, unfortunately not when it comes to hygiene. Many different people live here, not all of whom handle waste neatly. In addition, the provision of waste bins is unfortunately not well organised. As a result, there is always rubbish and mess in the street. The location is really perfect! And personally, I am very happy with my little house.
Auto-translated to English by AIGreat neighbourhood to live in. Everything is around the corner, which is ideal! I've been living on the Huet for a year now and will definitely stay here for a long time!
Auto-translated to English by AIThe housing stock is mainly post-war — 84% was built between 1945 and 1990. In addition, the most common type is terraced houses (46%).
Over the past year a home for sale in De Huet was listed for an average of €391,383 (€3,072 per m²). Last quarter prices rose by 6%.
A rental home in De Huet cost an average of €971 per month (€10 per m²).
Residents give De Huet a 8.1 out of 10 based on 4 reviews. The strongest score is for education (9.2), the weakest for cleanliness (7.0).
Wijk De Huet has 9,910 residents. The largest age group is 45 to 65 years (30%).
From De Huet you can on average reach a supermarket at 1.1 km, a GP at 1.1 km, a railway station at 1.4 km, a primary school at 0.8 km (as the crow flies, source: CBS).
Right now you will find 13 homes for sale and 2 homes for rent in De Huet. The market here is fast: a home for sale is listed for an average of just 21 days.