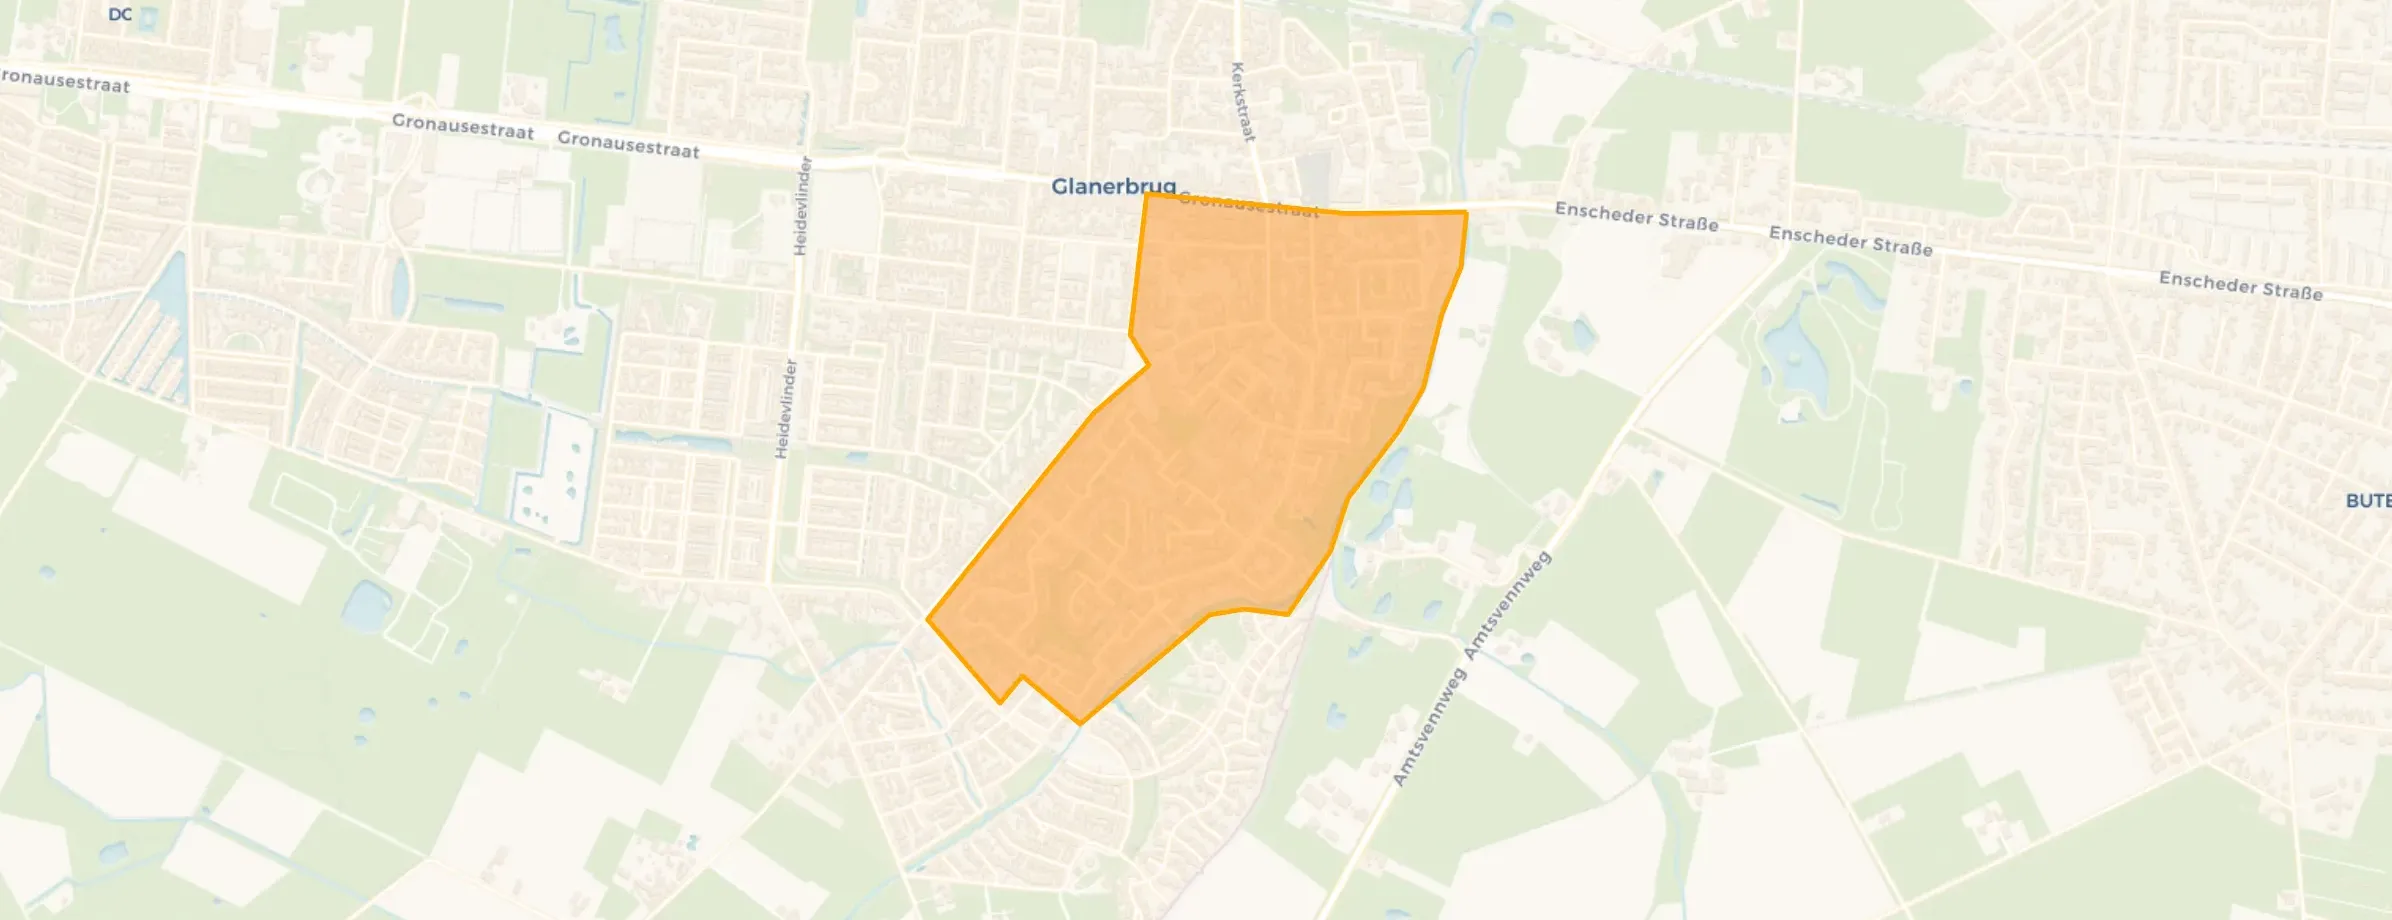
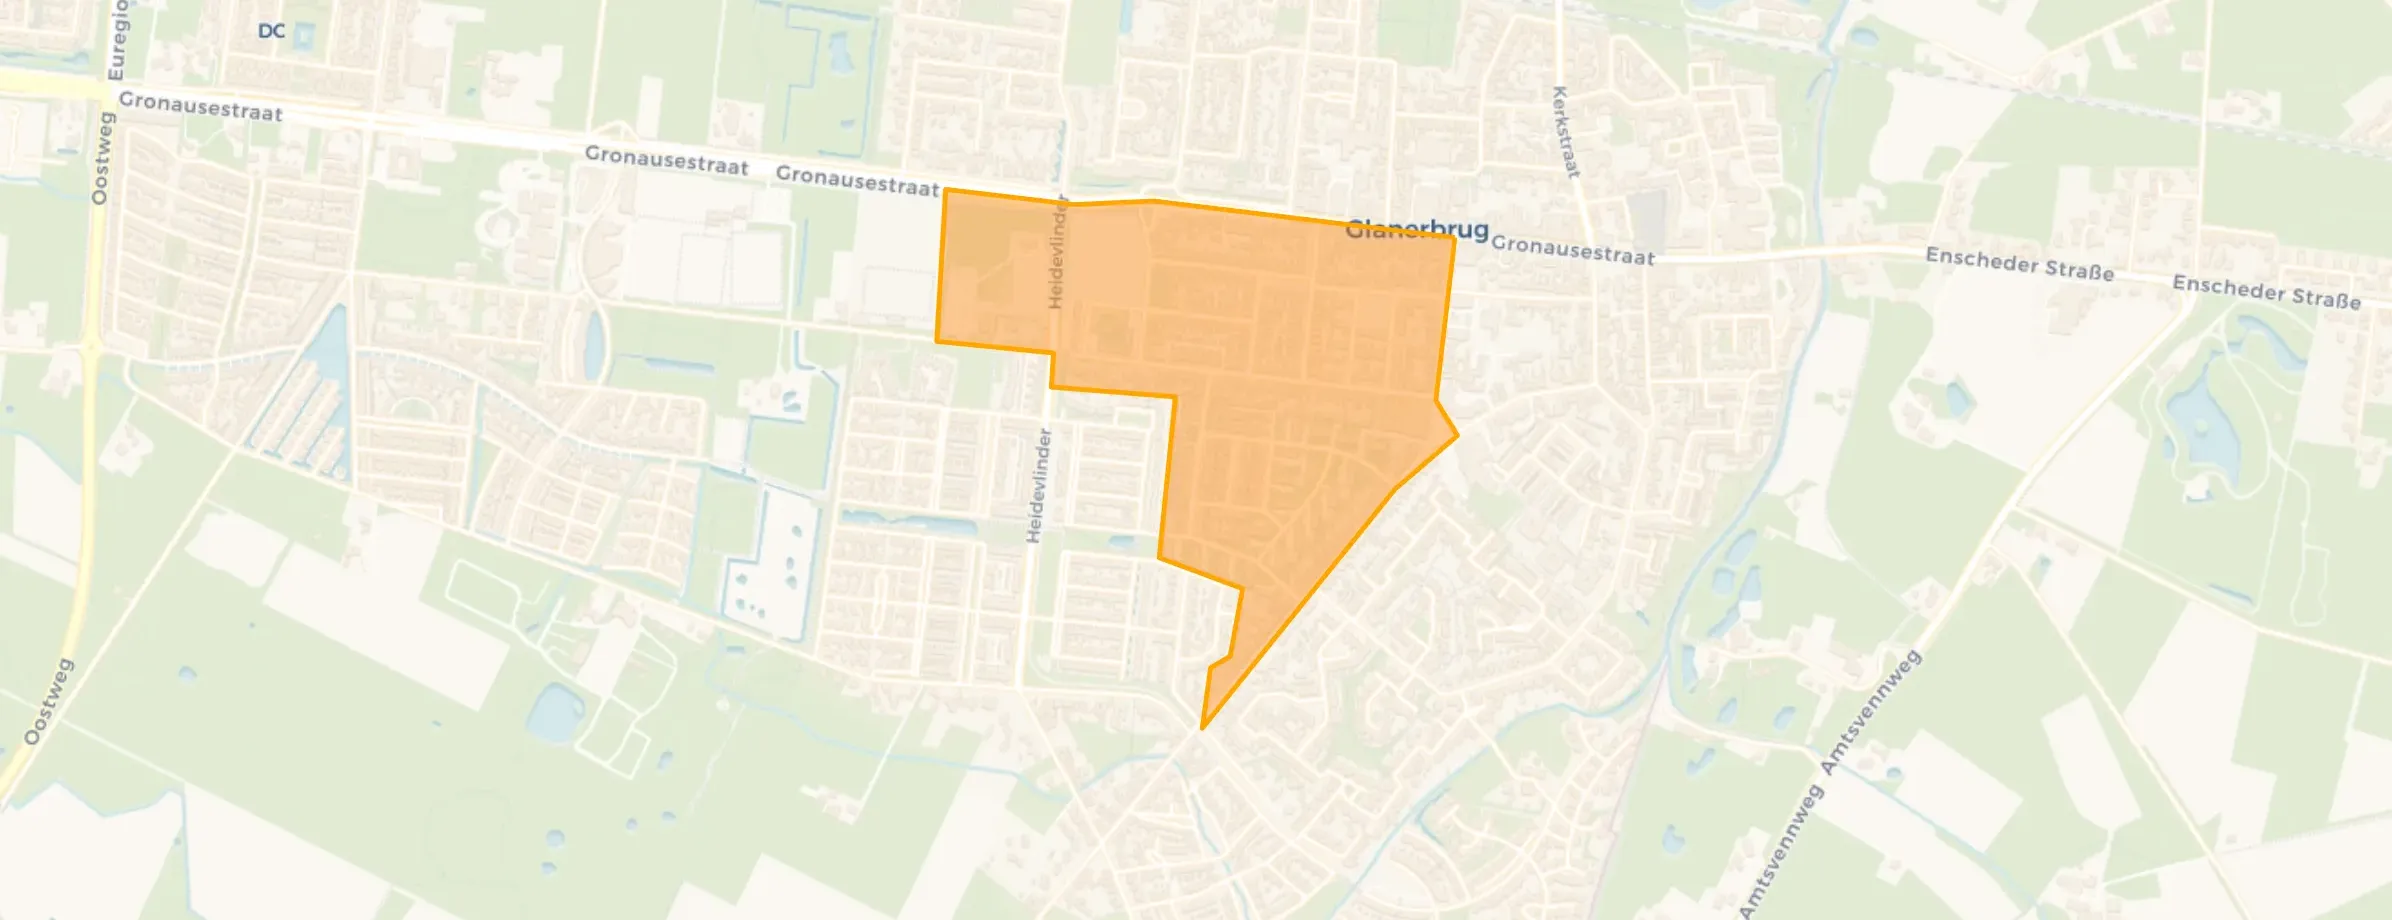
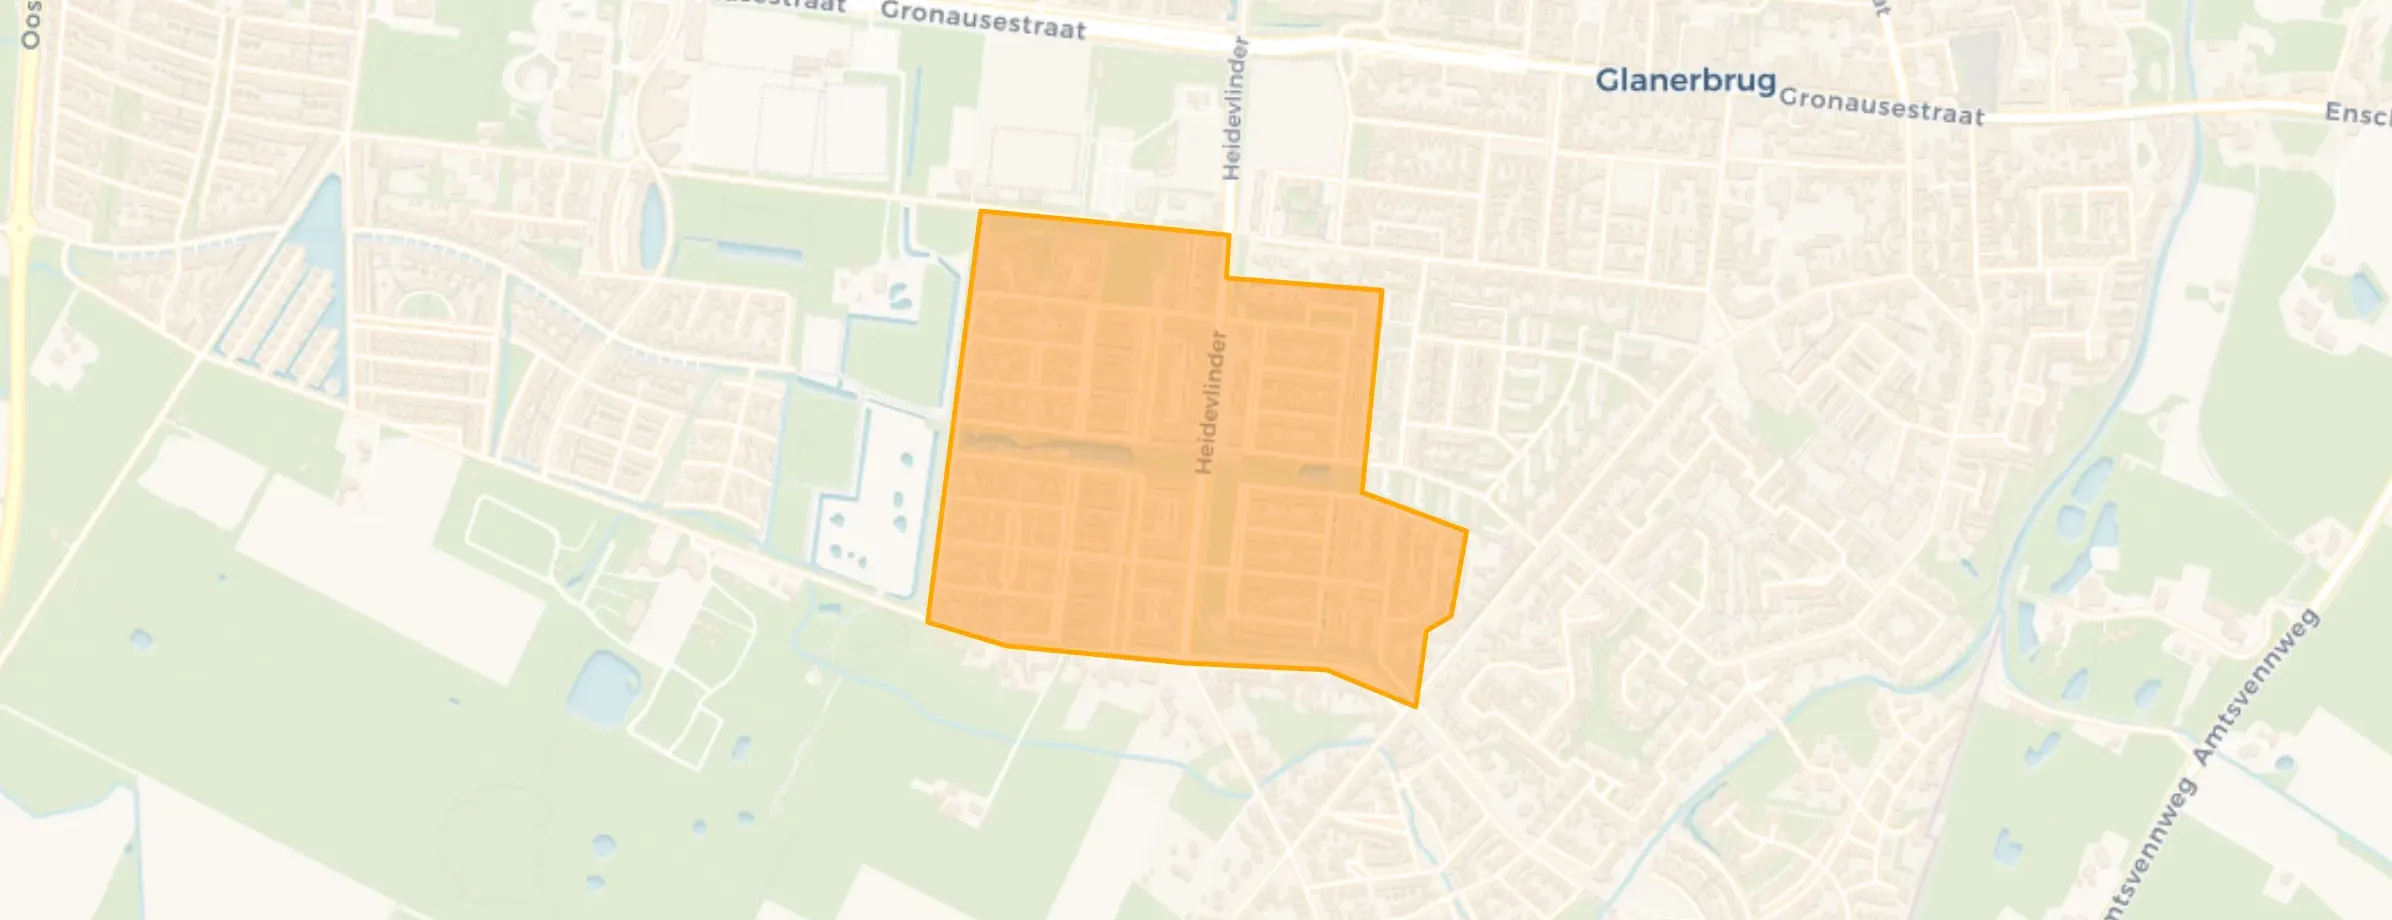
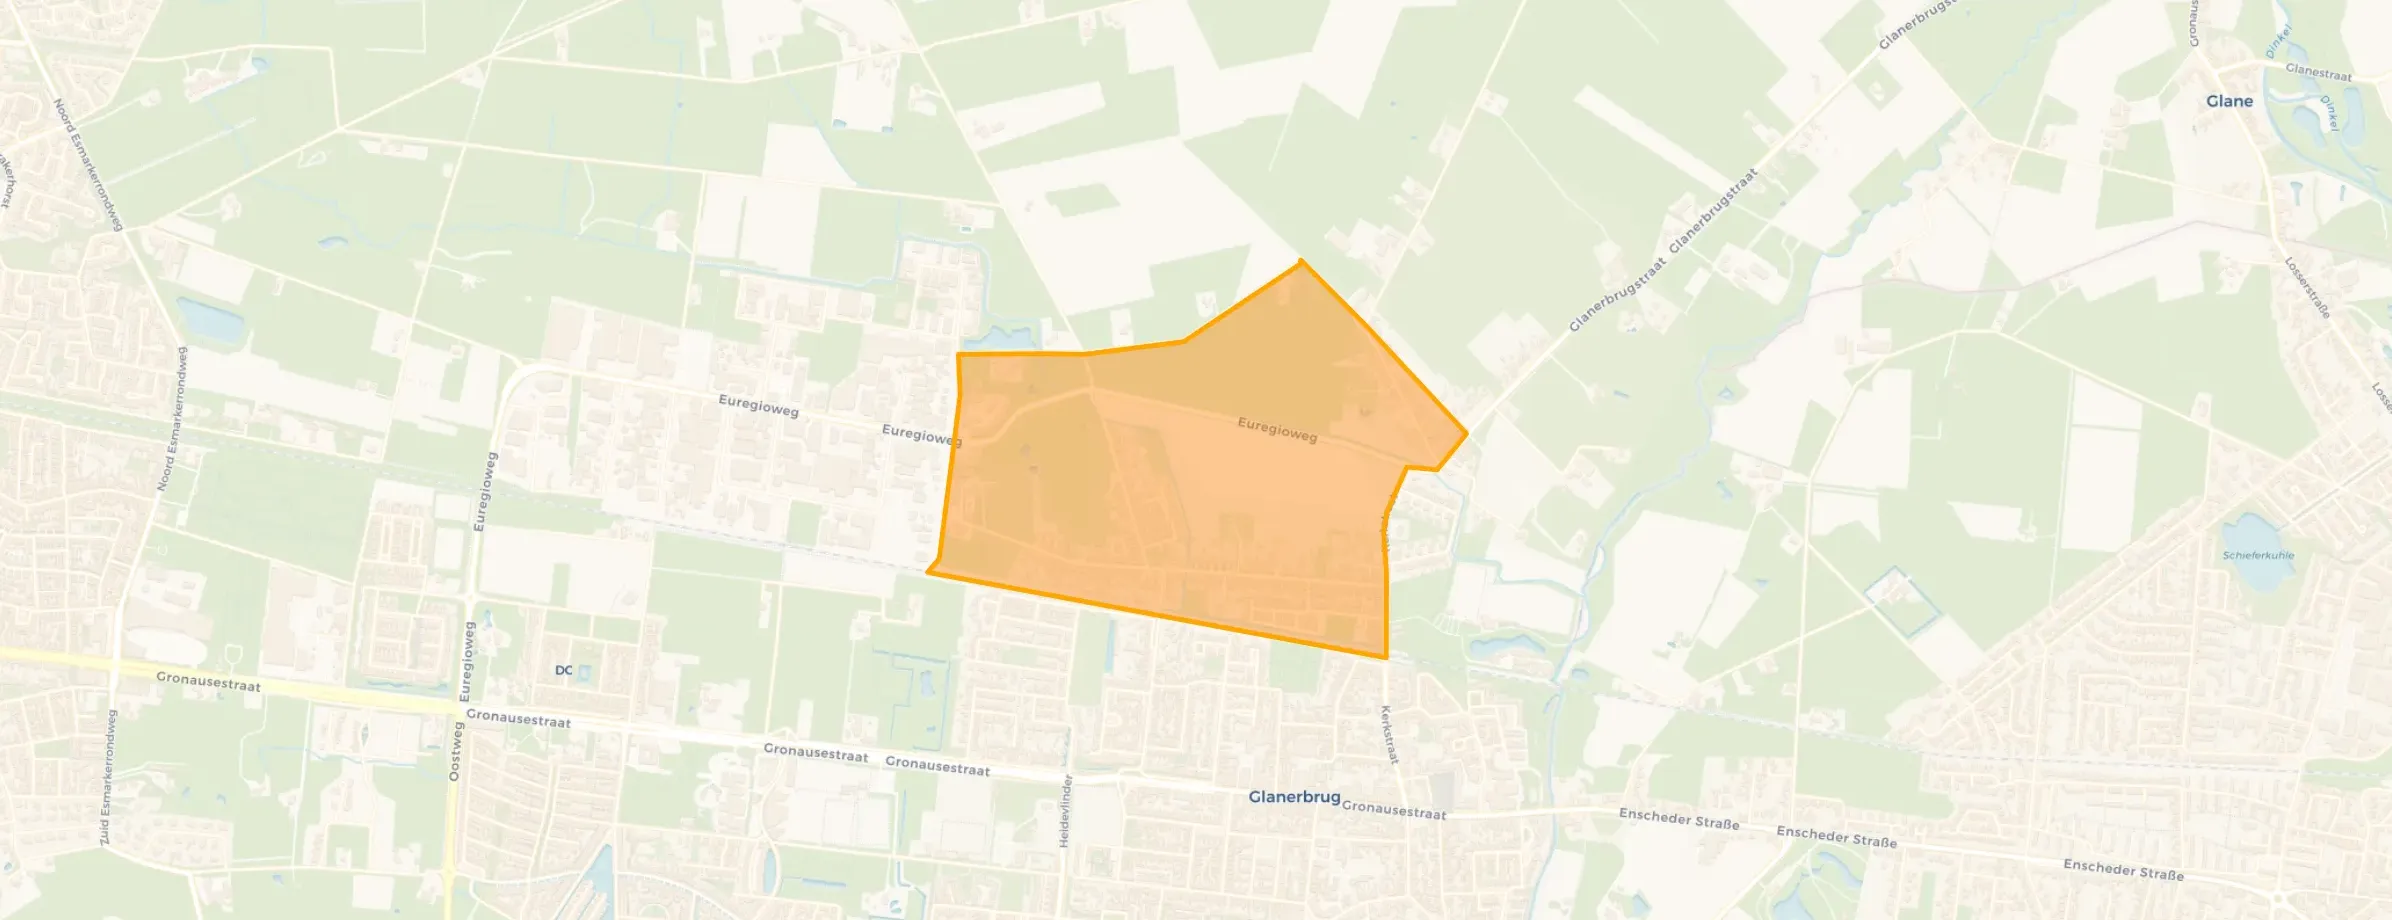
Glanerbrug en omgeving is located in the province of Overijssel, in the municipality of Enschede. The district has a total area of 547 hectares, of which 547 hectares are land and 0 hectares are water. The district is coded as WK015308. The postcode area is 7532AA-7534ZZ.
Glanerbrug en omgeving has 16.605 residents. Of these, 50,6% are men and 49,4% are women. Most residents are 45 to 65 years (29,1%). The other age groups are 24,2% for '25 to 45 years', 17,5% for '65 years or older', 16,2% for '0 to 15 years' and 13,1% for '15 to 25 years'. Of the residents, 49,2% is unmarried, 38,0% is married, 8,0% is divorced and 4,7% is widowed. 12.545 residents originate from the Netherlands, 1.700 come from Europe and 2.365 come from countries outside Europe.
There are 7.050 households in Glanerbrug en omgeving. 31,6% of these are single-person households, 27,4% households without children and 41,1% households with children. The average household size is 2,3 persons. The national average is 2,1 persons.
In Glanerbrug en omgeving there are 13.300 income recipients. The average income per income recipient is €36.100, which is €6.100 (14%) lower than the national average of €42.200. Per resident, the average income is €29.500, which is €5.400 (15%) lower than the national average of €34.900. Most residents of Glanerbrug en omgeving are educated to an intermediate level. 48,6% have an intermediate education (HAVO, VWO or MBO 2-4), 30,6% have a lower education (VMBO or MBO 1) and 20,9% have a university or higher professional education (HBO/WO).
Of the 16.605 residents, around 73% are in paid employment, which amounts to 12.122 people. This is 1% higher than the national average of 72%. The majority of workers are in salaried employment (88%), while 12% are self-employed. In Glanerbrug en omgeving, 25% of residents receive a benefit. The largest group is those receiving a state pension (AOW). 2.560 people receive this benefit.
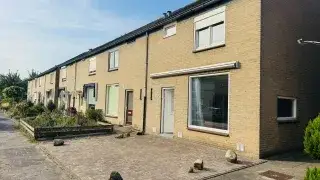
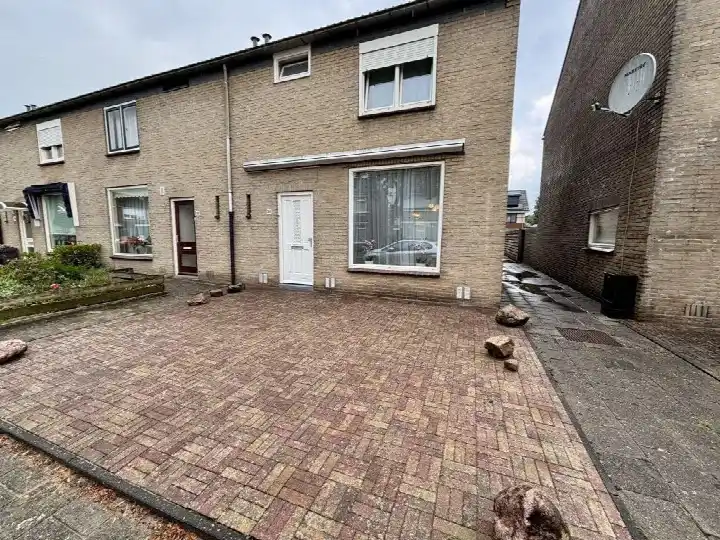
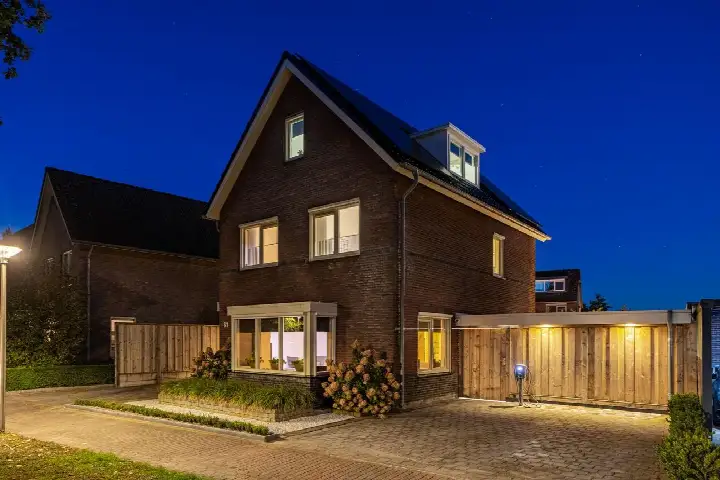
In Glanerbrug en omgeving there are 7.201 homes with an average assessed value (WOZ) of €308.000. Of these, around 97% are occupied and 3% unoccupied. Most homes are owner-occupied. This amounts to 36% rental homes and 64% owner-occupied homes. Of the homes, 64% privately owned, 28% owned by housing associations and 8% owned by other landlords. The most common construction periods in Glanerbrug en omgeving are 2000-2010 (25%) and 1990-2000 (23%).
There are currently 62 homes for sale in Glanerbrug en omgeving. The most recently listed home is W.C. Schoutenstraat 9 by Thoma Post Makelaars. Over the past year, 208 homes were sold in Glanerbrug en omgeving. On average, a home was sold within 75 days.
The average asking price for a home for sale in Glanerbrug en omgeving over the past year was €385.298. This is 25% higher than the average assessed value (WOZ) of €308.000. The average asking price per m² of floor area is €3.106.
There are 6 homes for rent in Glanerbrug en omgeving. The most recent home is Spoorbaanstraat 5-23, offered by www.woninghuren.nl. Over the past year, 10 homes were let in Glanerbrug en omgeving. On average, a listing was let within 103 days.
The average rent for a rental home in Glanerbrug en omgeving over the past year was €2.409 per month. Per m² of floor area that is €20 per month.
In Glanerbrug en omgeving there are 4.571 addresses with a registered energy label. The most common labels are A (39%), B (20%) and C (18%). On average, an address in Glanerbrug en omgeving uses 2.840 kWh of electricity per year. This is 11% above the national average of 2.550 kWh. Natural gas consumption, at 860 m³ per year, is 8% above the national average of 800 m³.
Nice, neat and quiet neighbourhood. Lots of greenery, few high-rise buildings, which I really like. We ourselves live in an apartment where we feel at home. The neighbours in our apartment are all older Enschede residents and Glanerbrug residents. Nice complex to live in. The view from our apartment is beautiful, lots of greenery, and you can easily walk into the countryside. However, the shops, apart from a few, are further away. I personally find that a disadvantage. You really need transport if you want to go somewhere. Not everyone can cycle or has a car. I feel safe here; in the 6 years I've lived here, I personally haven't experienced anything that could give an unsafe feeling. You also don't see groups of young people hanging around here.
Auto-translated to English by AIIt used to be nice and cosy. Now all kinds of people move in whom you still don't know after 2 years. Few amenities, nothing to do here. Nature is being destroyed by rich stickers who want to build a house.
Auto-translated to English by AII've been living here for about 4 years now and so far I haven't had any problems. It has a beautiful natural environment and it's not too far from certain amenities. By bike, you can reach the city in about 15/20 minutes. However, there are no special amenities within walking distance, just a supermarket, New York Pizza, and a few football fields. That's not really a problem, of course.
Auto-translated to English by AII was born here, many people I grew up with still live here. Neighbourliness is a thing here, we keep an eye on everything. And for a cup of coffee you just pop in to the neighbours. Here it's 'we know each other'.
Auto-translated to English by AIThe neighbours are very friendly, I live on a very nice street. Basic amenities like supermarkets are very close by, which is very convenient. It is annoying though that if I want to go to the station, I have to travel far.
Auto-translated to English by AISince a few months I have discovered that neighbours are very sneaky. I will have lived here for 10 years in December, never had any problem with the neighbours, but since a few weeks they feel the need to violate my privacy by filming my house and seeing who comes and goes. Very unfortunate, I thought I could live well here, but it turns out they are afraid of me and my guests. They chat pleasantly with you, but behind your back, very sad such people.
Auto-translated to English by AIThe housing stock is relatively young — 56% dates from after 1990.
Over the past year a home for sale in Glanerbrug en omgeving was listed for an average of €385,298 (€3,106 per m²). That is 26% below the Dutch national average.
A rental home in Glanerbrug en omgeving cost an average of €2,409 per month (€20 per m²). That is 29% above the national average.
Residents give Glanerbrug en omgeving a 7.8 out of 10 based on 6 reviews. Safety stands out with a 8.5; amenities lags behind with a 6.0.
Wijk Glanerbrug en omgeving has 16,605 residents. Many families: 41% of the households have children.
The housing supply in Glanerbrug en omgeving is remarkably efficient: 66% has an A, A+ or B label. The average natural gas consumption per household is 860 m³ per year.
From Glanerbrug en omgeving you can on average reach a supermarket at 0.9 km, a GP at 1.3 km, a railway station at 1.6 km, a primary school at 0.8 km (as the crow flies, source: CBS).
Right now you will find 62 homes for sale and 6 homes for rent in Glanerbrug en omgeving. A home for sale here is listed for an average of 75 days — relatively long for the current market.