District in Heerlen
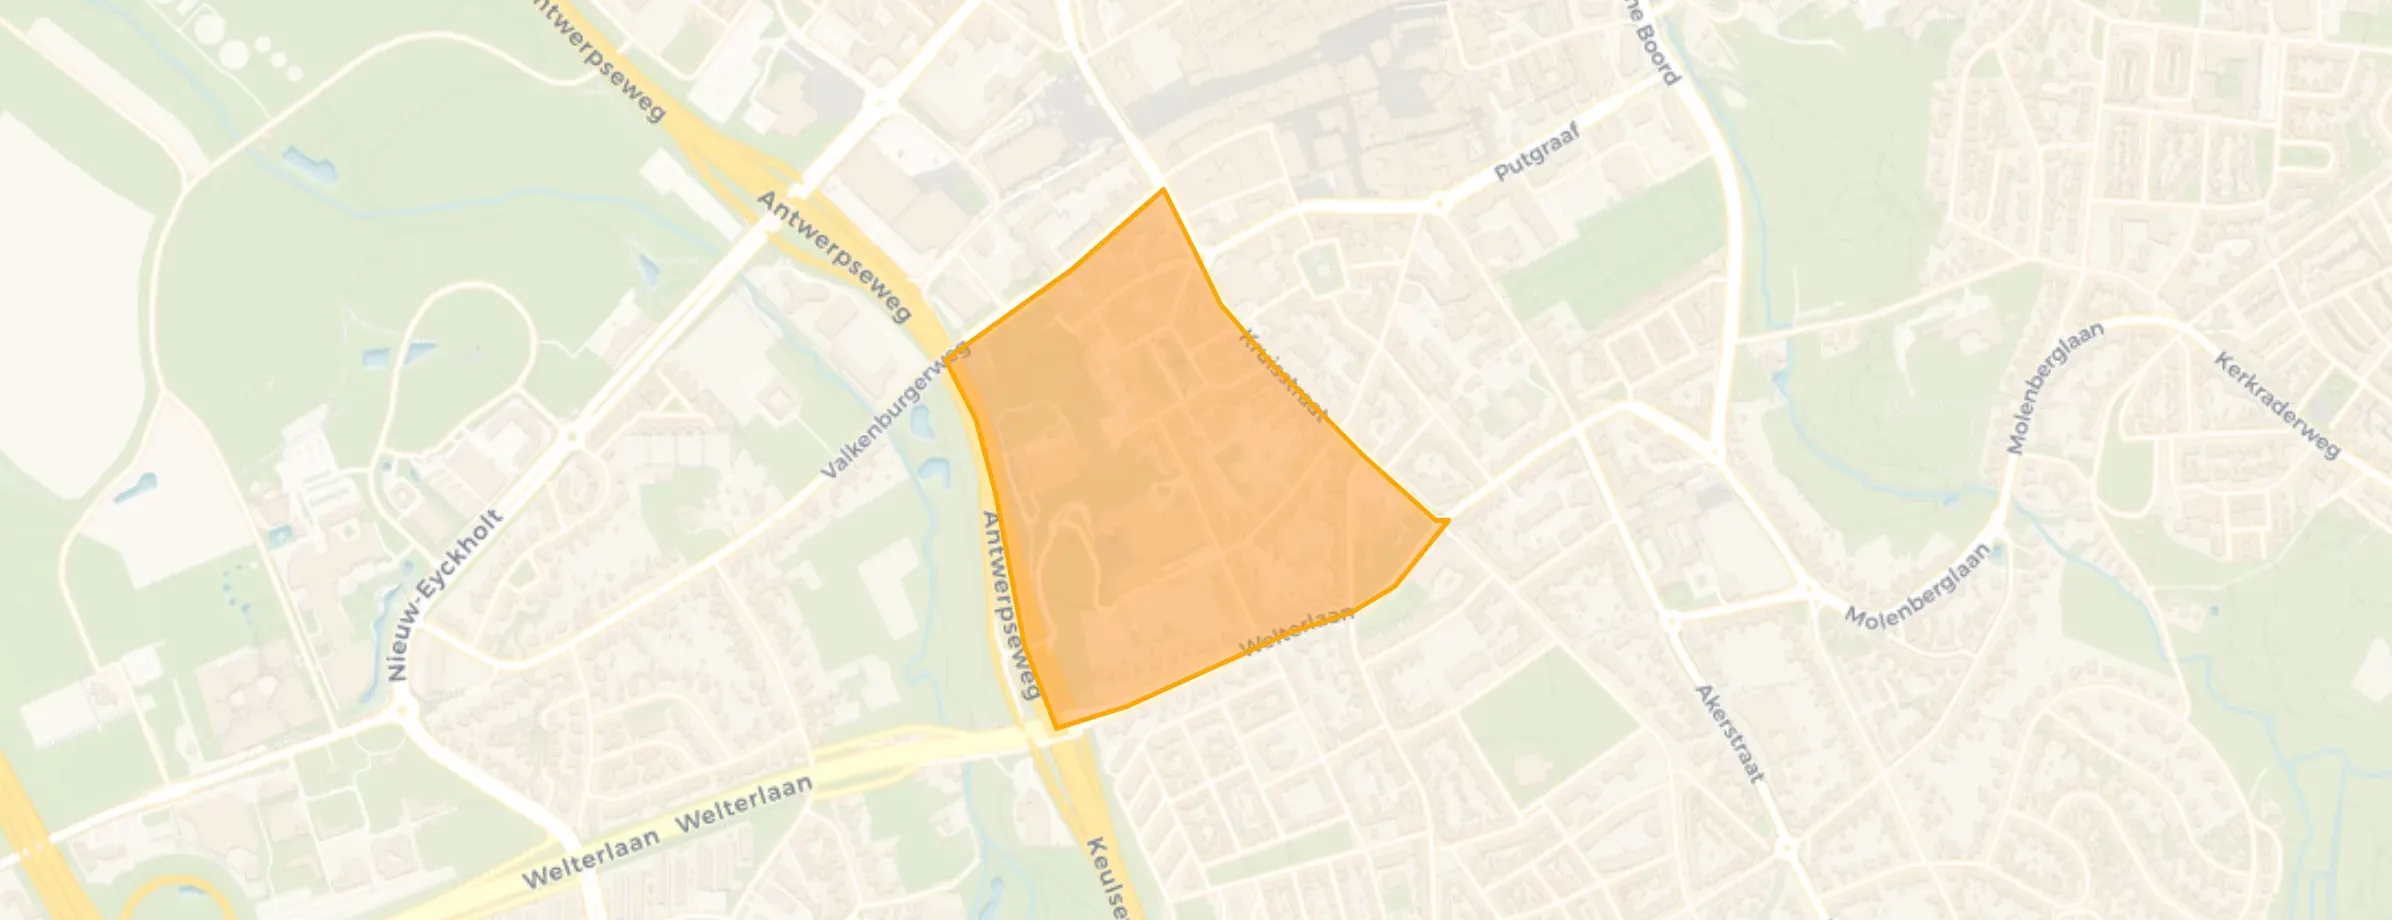
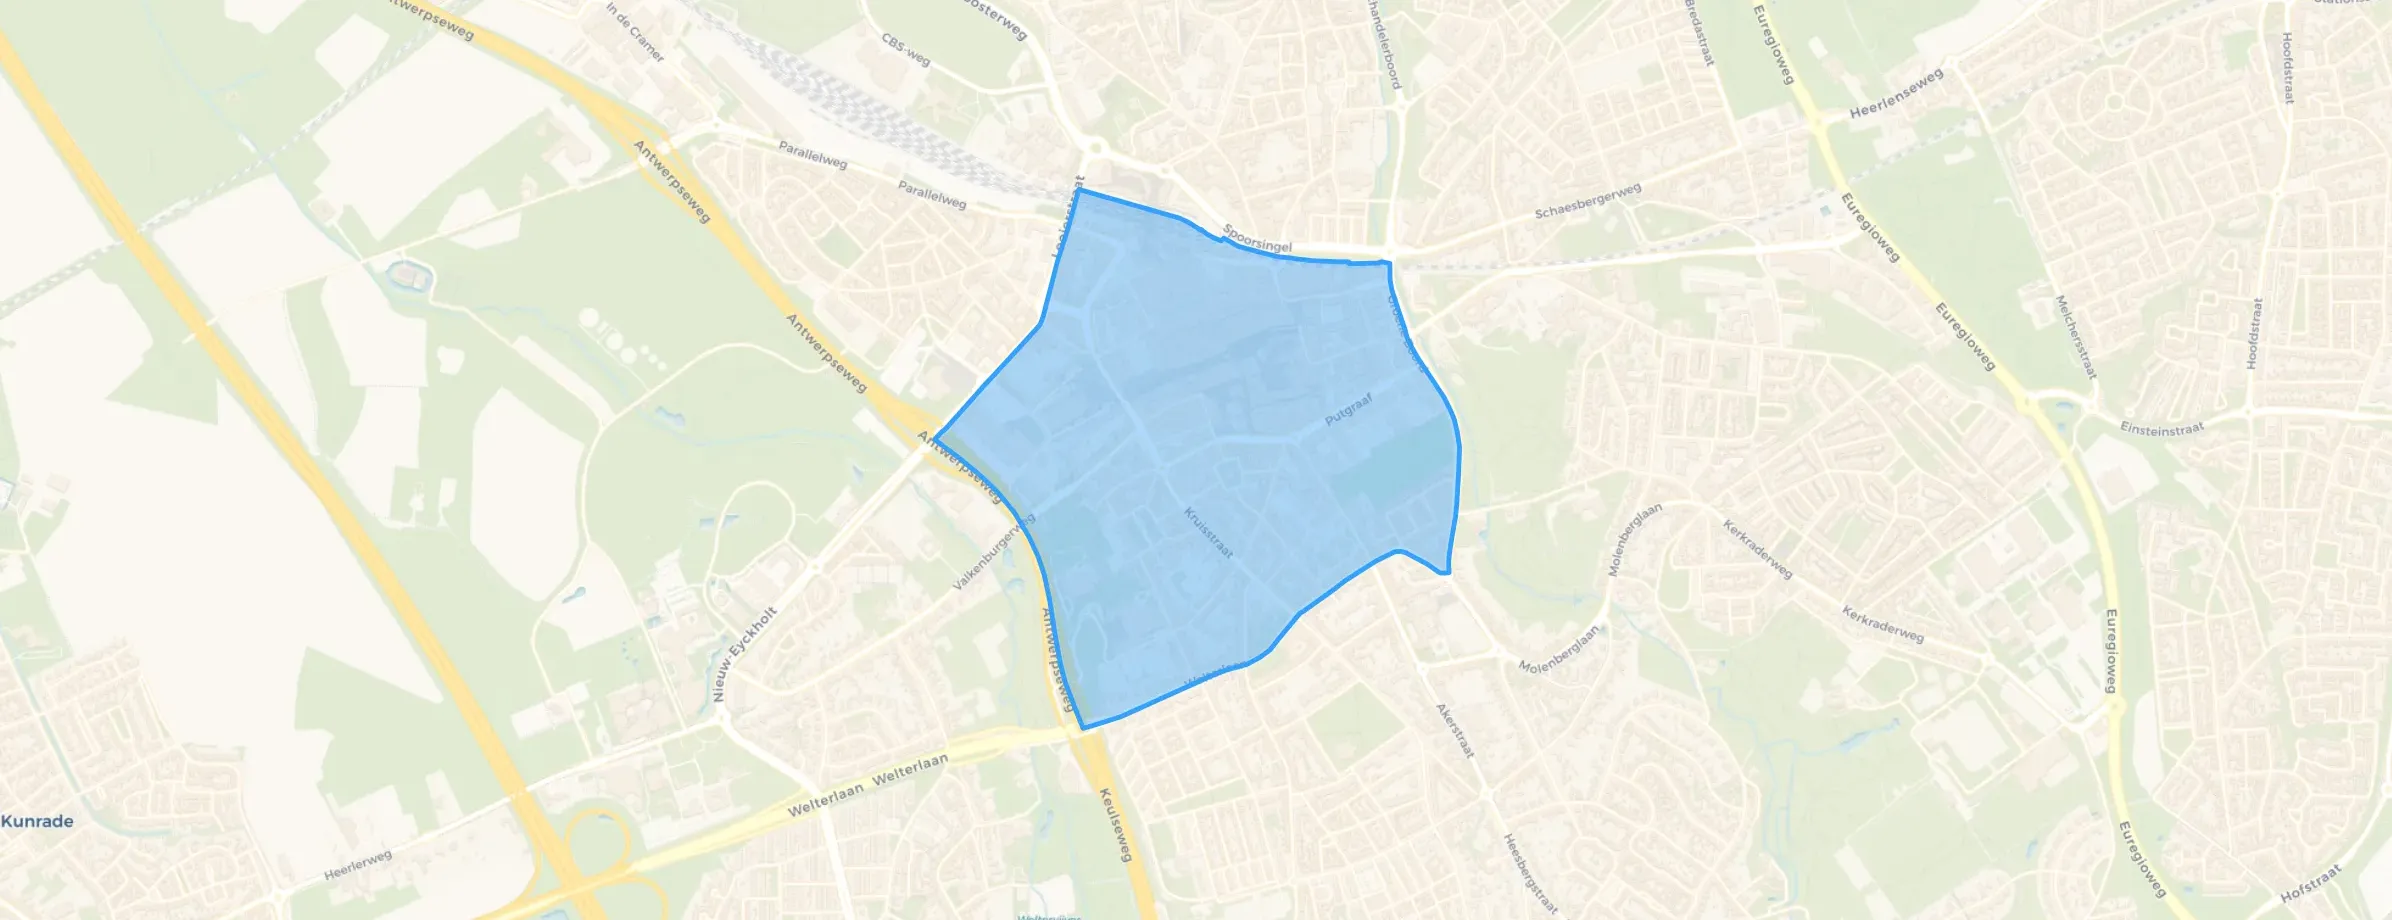
Heerlen-Centrum is located in the province of Limburg, in the municipality of Heerlen The district has a total area of 107 hectares, of which 107 hectares are land and 0 hectares are water. The district is coded as WK091733. The postcode area is 6411AA-6417BW.
Heerlen-Centrum has 5.765 residents. Of these, 51,6% are men and 48,4% are women. Most residents are 65 years or older (31,2%). The other age groups are 27,8% for '25 to 45 years', 21,4% for '45 to 65 years', 13,6% for '15 to 25 years' and 6,0% for '0 to 15 years'. Of the residents, 51,2% is unmarried, 28,4% is married, 11,8% is divorced and 8,6% is widowed. 3.650 residents originate from the Netherlands, 1.075 come from Europe and 1.040 come from countries outside Europe.
There are 3.835 households in Heerlen-Centrum. 66,0% of these are single-person households, 24,1% households without children and 9,9% households with children. The average household size is 1,5 persons. The national average is 2,1 persons.
In Heerlen-Centrum there are 4.900 income recipients. The average income per income recipient is €37.900, which is €4.300 (10%) lower than the national average of €42.200. Per resident, the average income is €34.900, which is €0 (0%) lower than the national average of €34.900. Most residents of Heerlen-Centrum are educated to an intermediate level. 42,1% have an intermediate education (HAVO, VWO or MBO 2-4), 36,2% have a university or higher professional education (HBO/WO) and 21,6% have a lower education (VMBO or MBO 1).
Of the 5.765 residents, around 64% are in paid employment, which amounts to 3.690 people. This is 8% lower than the national average of 72%. The majority of workers are in salaried employment (87%), while 13% are self-employed. In Heerlen-Centrum, 39% of residents receive a benefit. The largest group is those receiving a state pension (AOW). 1.660 people receive this benefit.
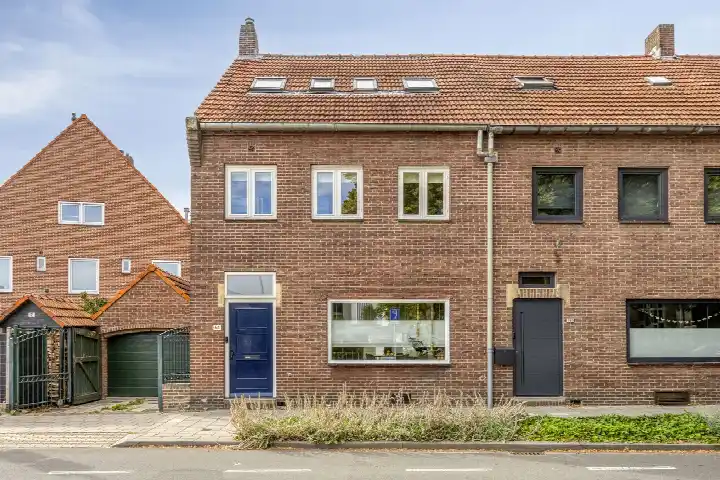
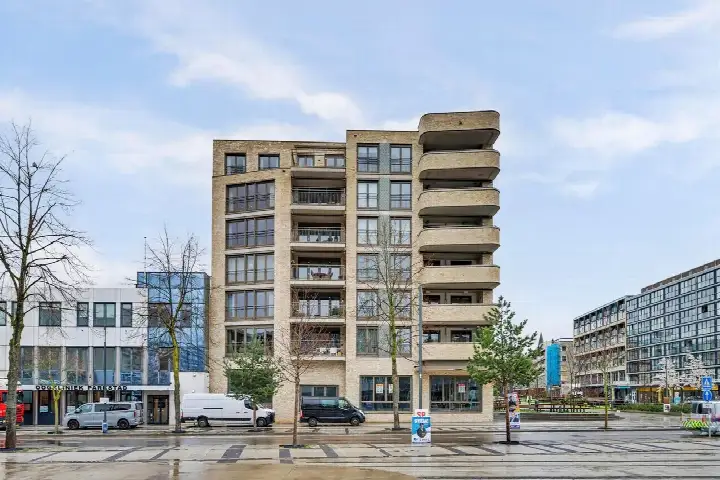
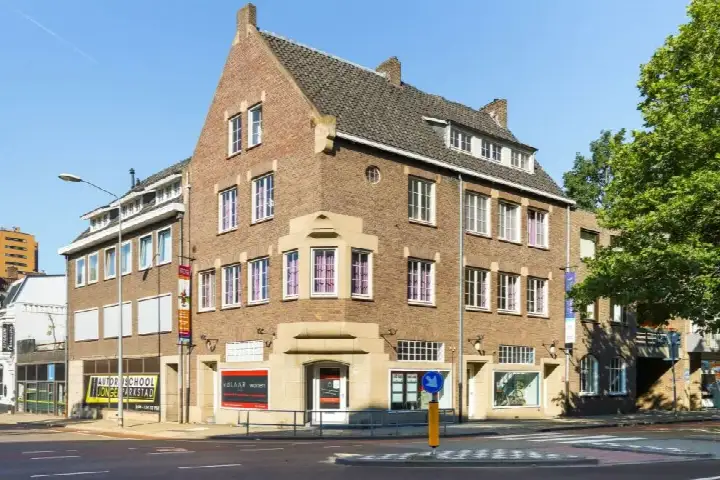
In Heerlen-Centrum there are 3.839 homes with an average assessed value (WOZ) of €216.000. Of these, around 88% are occupied and 12% unoccupied. Most homes are rental properties. This amounts to 65% rental homes and 35% owner-occupied homes. Of the homes, 35% privately owned, 22% owned by housing associations and 42% owned by other landlords. The most common construction periods in Heerlen-Centrum are 1950-1970 (27%) and 1925-1950 (14%).
There are currently no homes for sale in Heerlen-Centrum. The most recently listed home is Benzenraderweg 54 by Damen Makelaardij | Heerlen op Funda. No homes were sold in Heerlen-Centrum over the past year.
There are currently no homes for rent in Heerlen-Centrum. The most recent home is Geerstraat 12C, offered by Parkstad Makelaardij op Funda. No homes were let in Heerlen-Centrum over the past year.
No recent rental data available for Heerlen-Centrum.
In Heerlen-Centrum there are 3.337 addresses with a registered energy label. The most common labels are A (22%), C (21%) and B (18%). On average, an address in Heerlen-Centrum uses 2.070 kWh of electricity per year. This is 19% below the national average of 2.550 kWh. With an annual consumption of 580 m³ per address, natural gas consumption is 28% below the national average of 800 m³.
Very nice neighbourhood
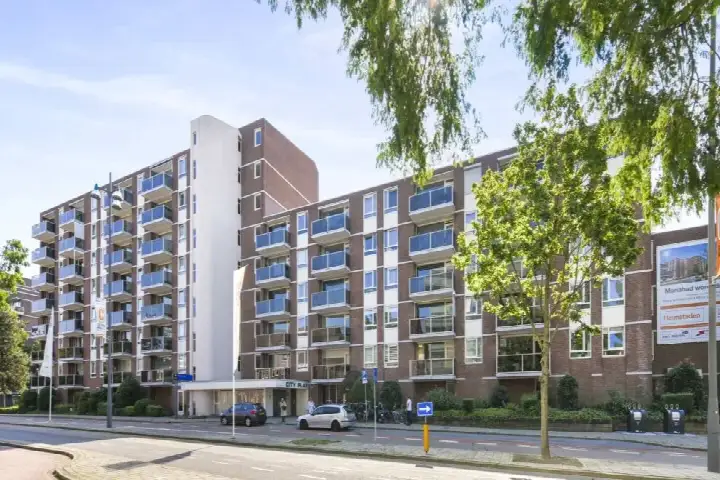
Auto-translated to English by AIPersonally, I think it's a safe neighbourhood, but that's because I know where I can go and what I'm allowed to do. If I were new here, I wouldn't feel so safe. You can encounter strange people here and experience situations that don't happen just like that outside this area. There is a lot of crime, from young to old, and if you pay close attention, you can see a lot of it. On top of that, there is simply a lot of poverty here. I see more people on benefits than working, and with each year, more and more homeless people. I see that they are trying their best to modernise the city. They are doing quite well at that, but... take the Aurora flats, for example. They've painted them all nice colours now, but that doesn't mean you've removed the ghetto. The same junkies and dealers still live in the flats as before. And I still wouldn't recommend walking alone in the dark. I think Heerlen is becoming more modern every year, but it remains my crack neighbourhood. Accessibility is fine, but we still don't have things like e-scooters or e-steps. Tram or metro. I can understand the tram and metro, but we are really lagging behind when it comes to e-scooters, etc. A few years ago, we only got those bikes you can rent... and then they basically showed that we can't handle that responsibility at all here. We destroy everything here that has any money in it or doesn't belong to us.
Auto-translated to English by AIThe housing stock is mainly post-war — 55% was built between 1945 and 1990. In addition, the most common type is flats (84%).
Over the past year a home for sale in Heerlen-Centrum was listed for an average of €280,377 (€2,605 per m²). That is 47% below the Dutch national average. Last quarter prices rose by 15%.
A rental home in Heerlen-Centrum cost an average of €1,314 per month (€13 per m²). That is 39% below the national average.
Wijk Heerlen-Centrum has 5,765 residents. The largest age group is 65+ years (31%). Notably, 66% of the households are single-person households.
From Heerlen-Centrum you can on average reach a supermarket at 0.5 km, a GP at 0.6 km, a railway station at 0.9 km, a primary school at 1.0 km (as the crow flies, source: CBS).
Right now you will find 75 homes for sale and 52 homes for rent in Heerlen-Centrum. A home for sale here is listed for an average of 74 days — relatively long for the current market.