District in Heerlen
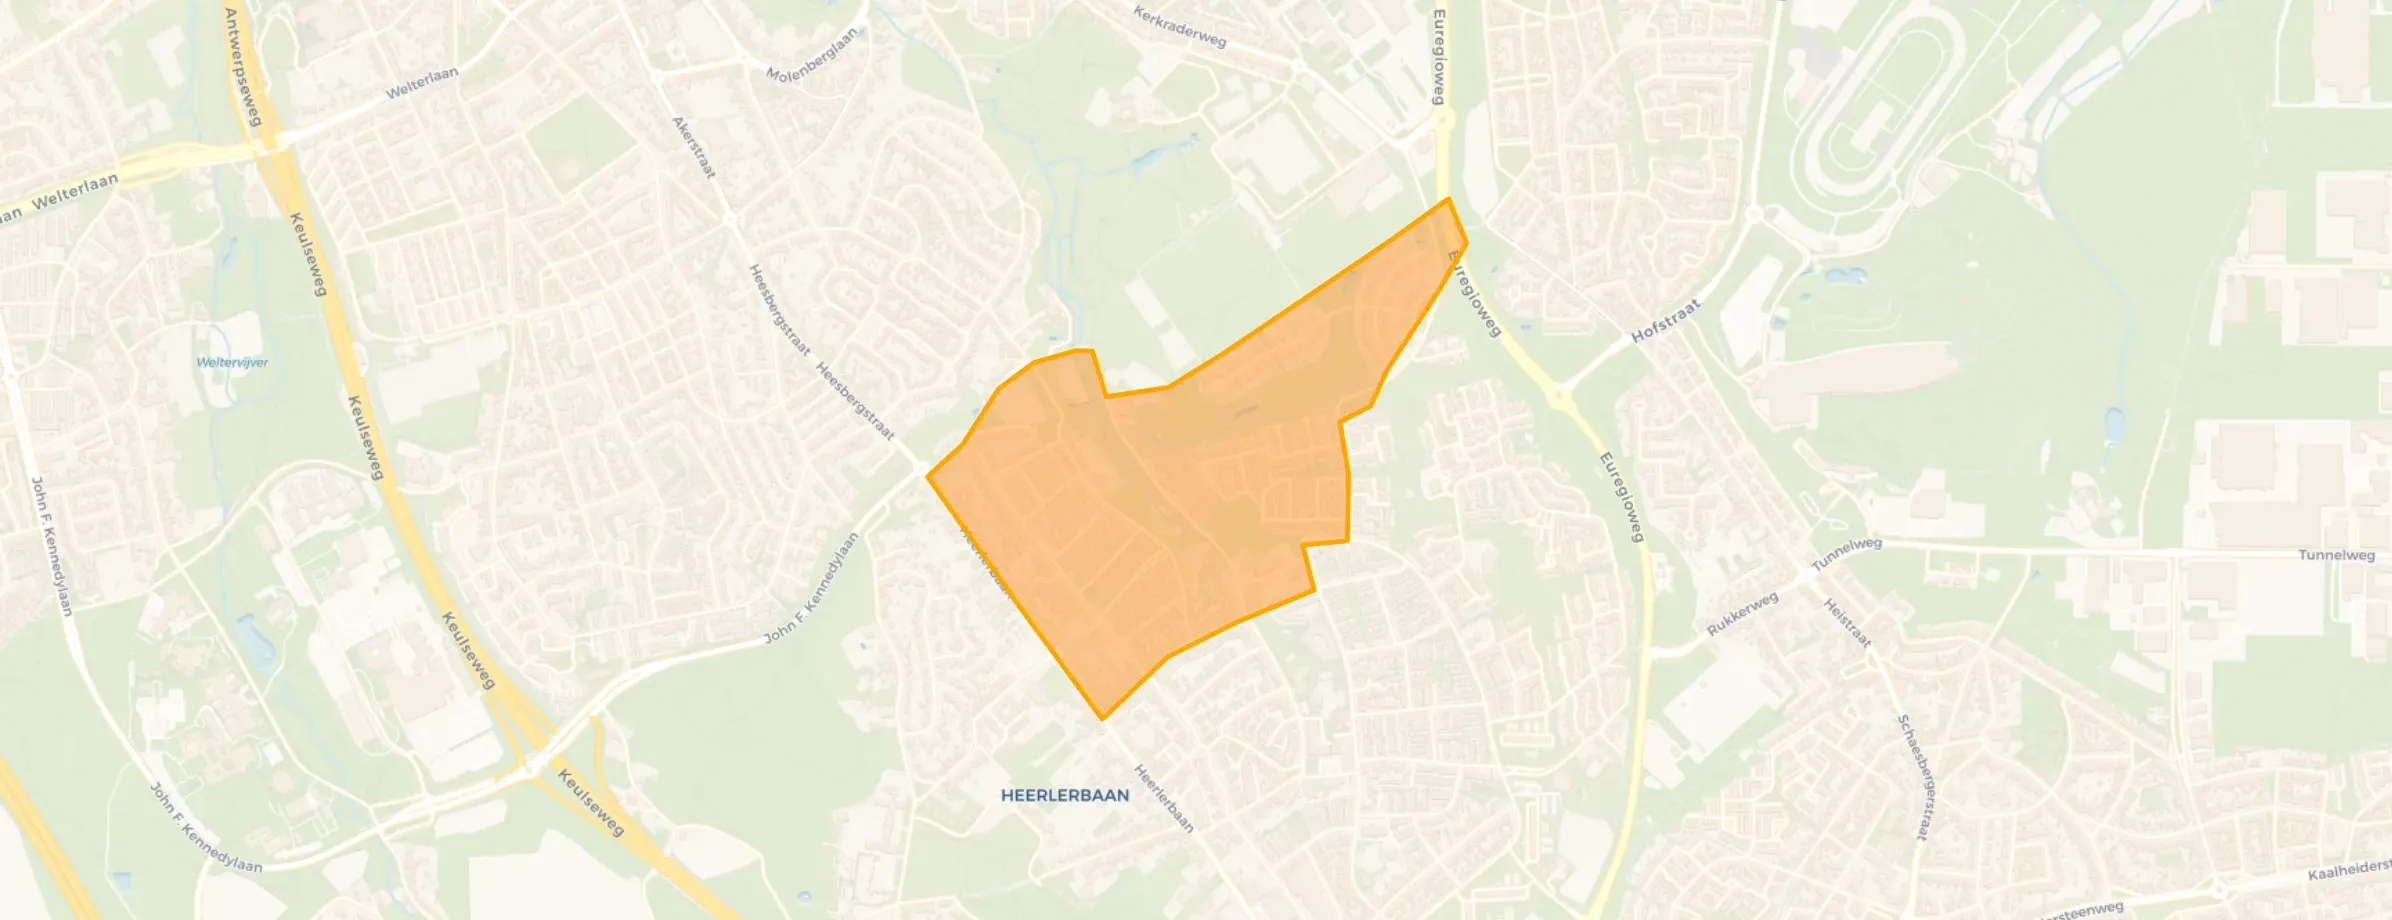
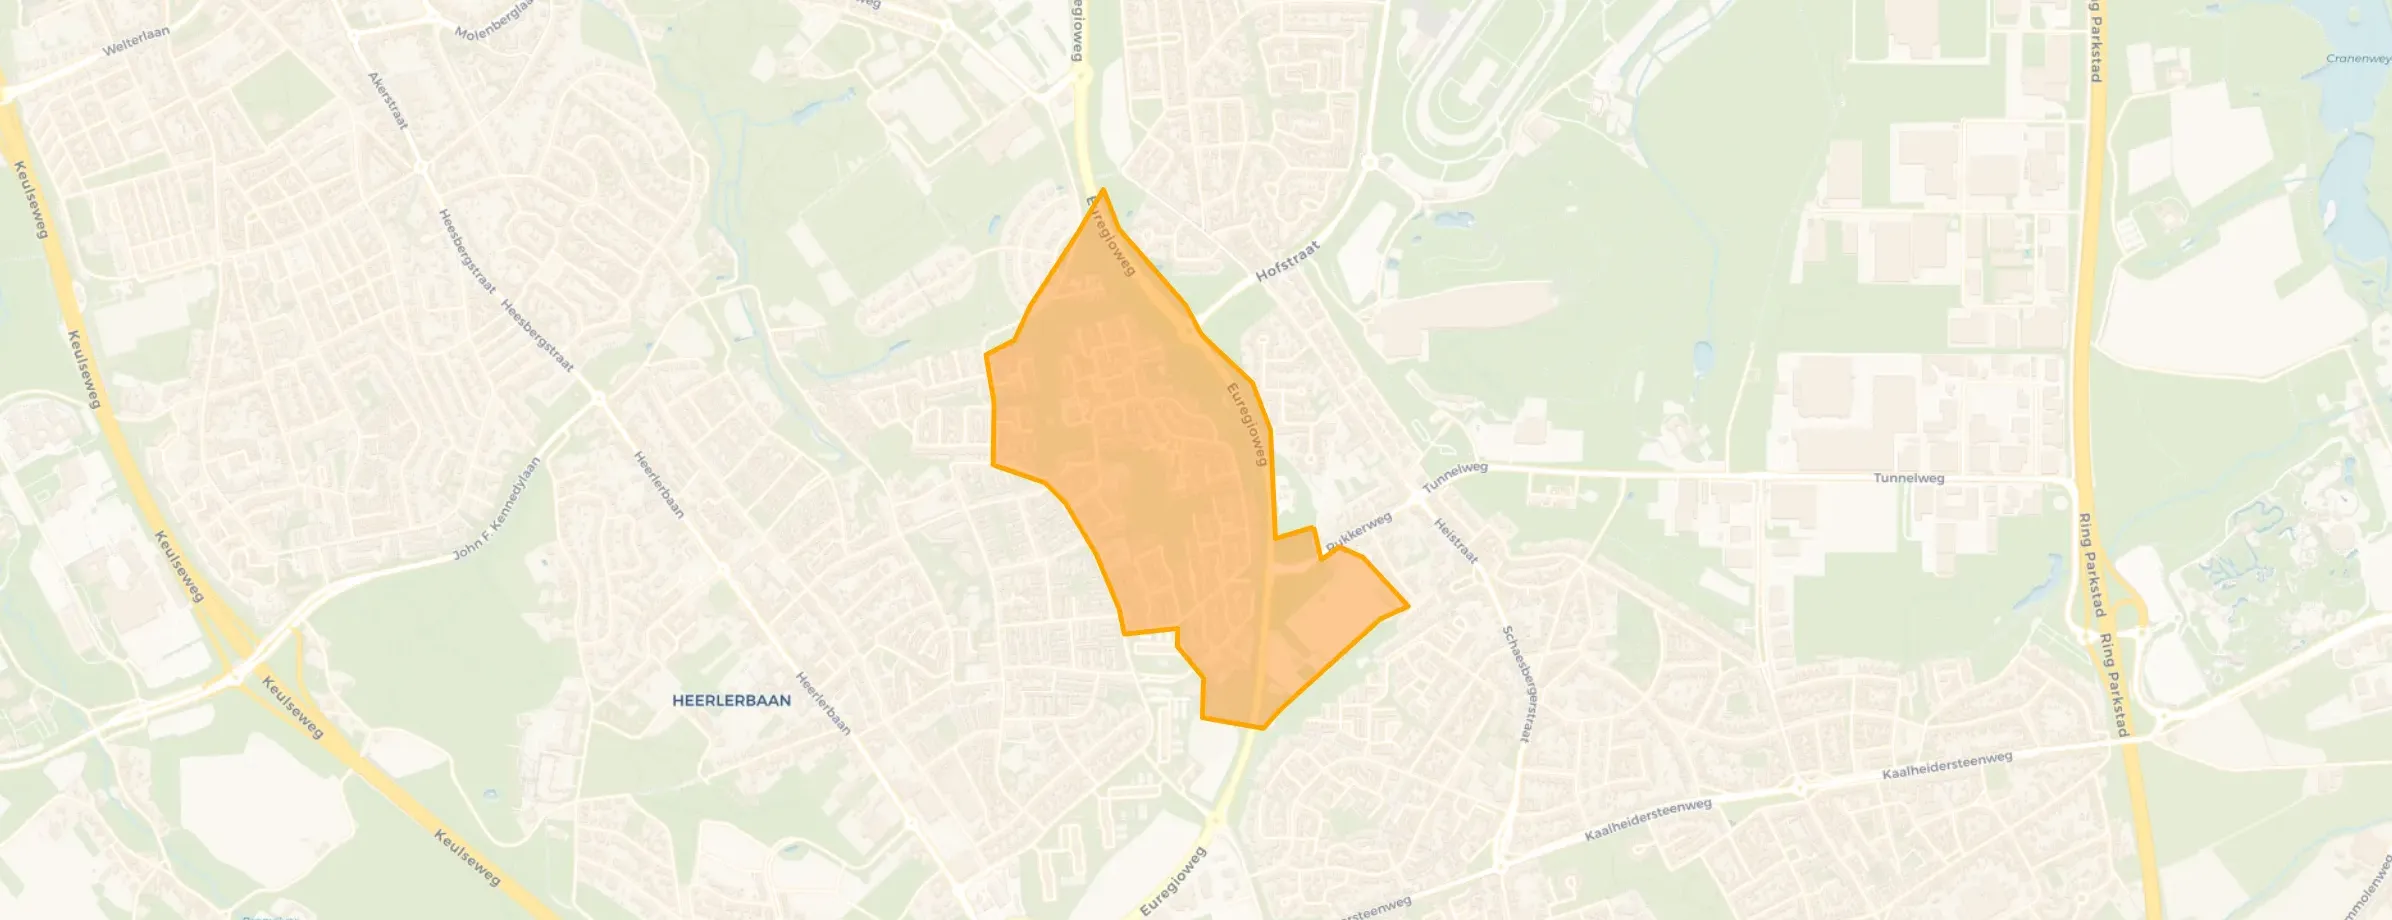
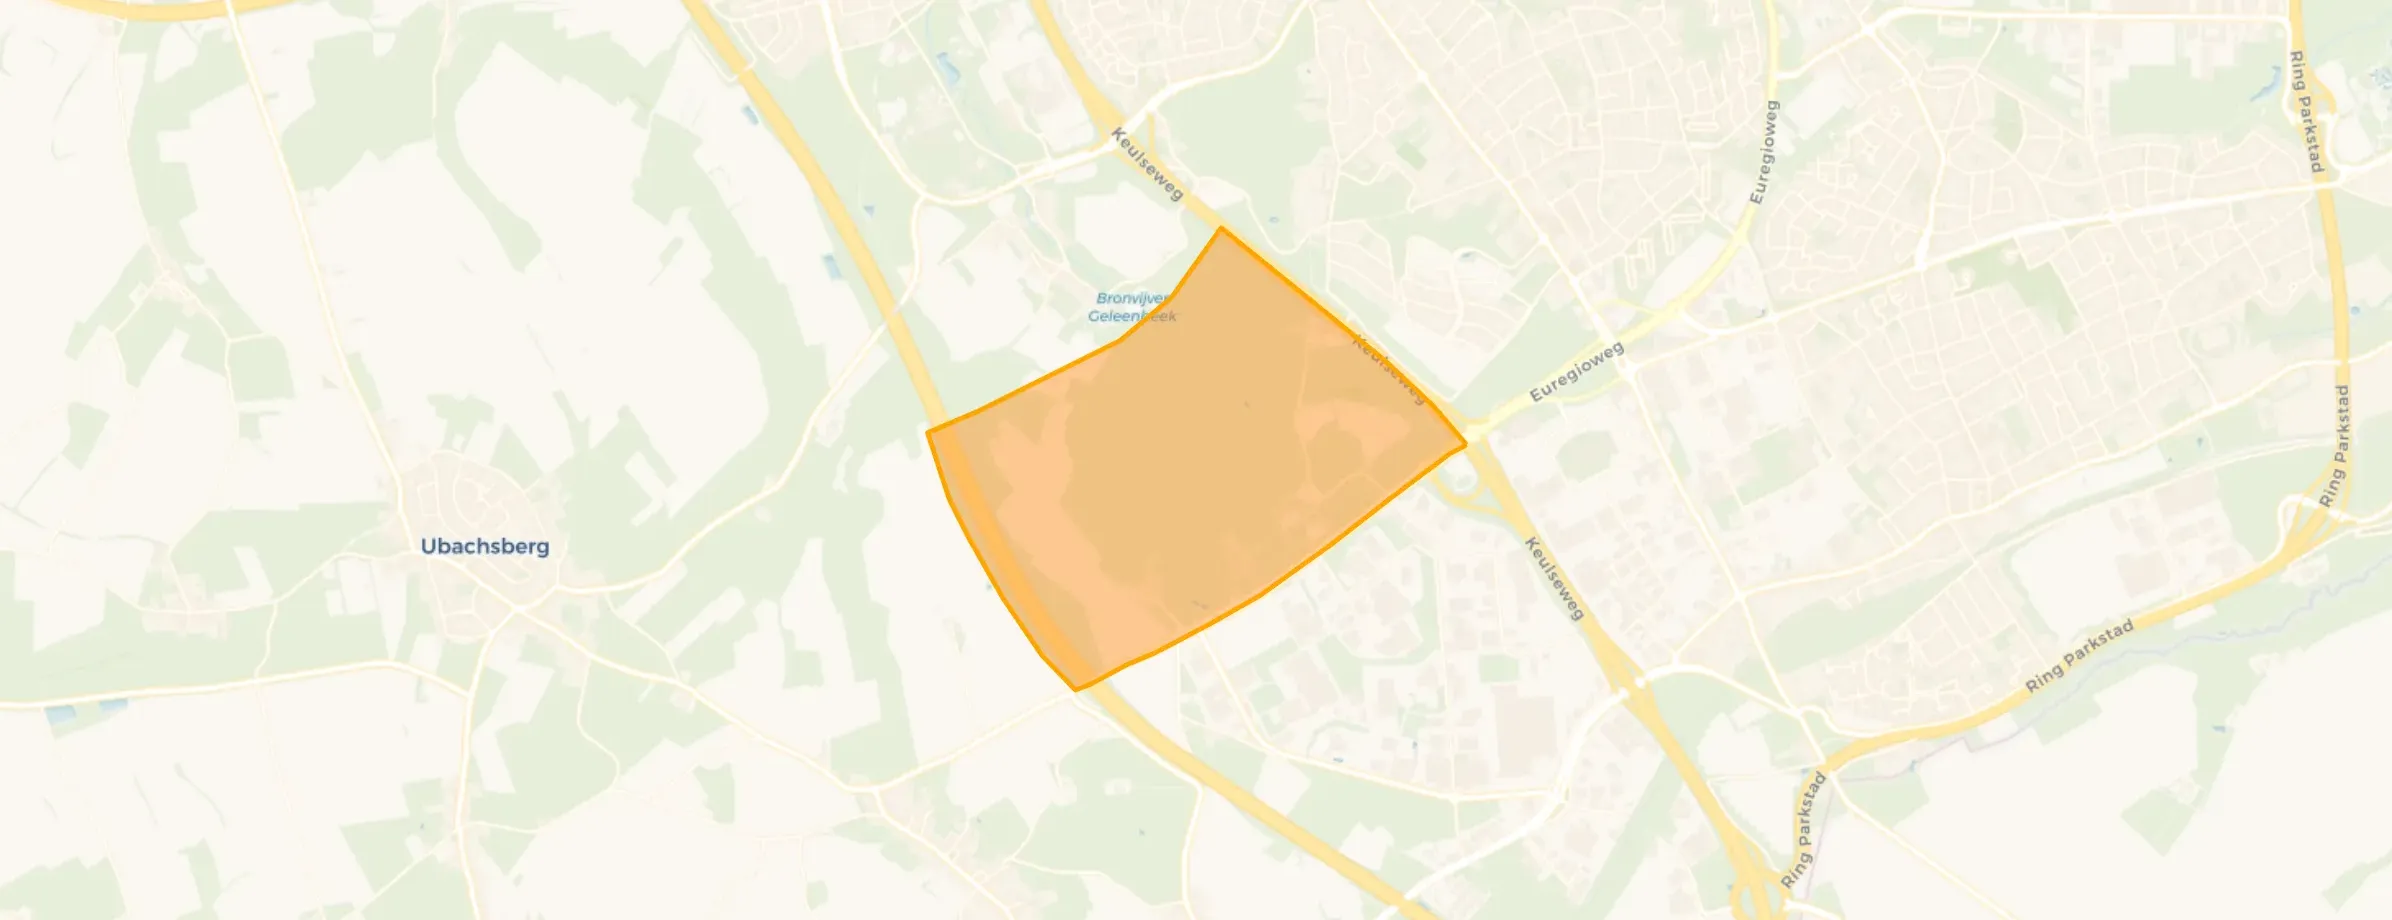
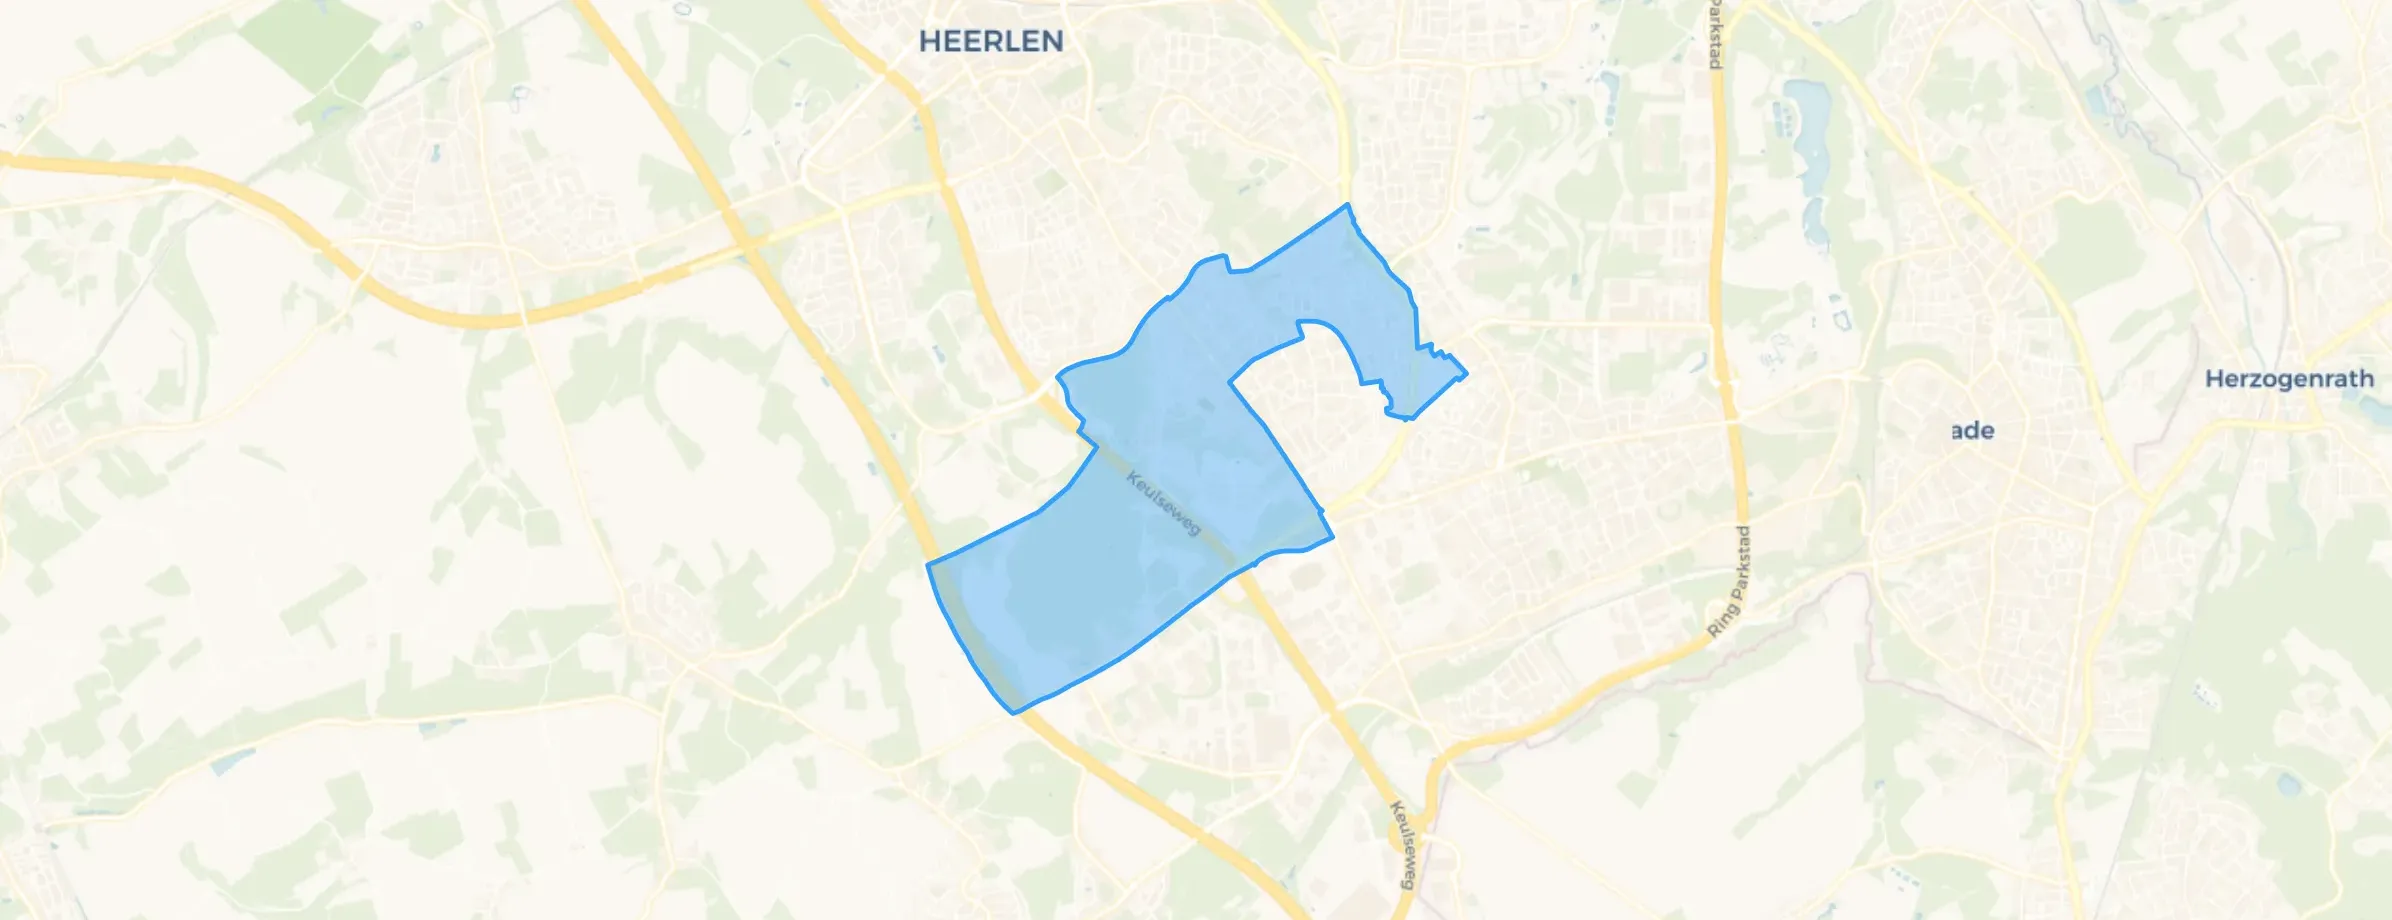
Heerlerbaan-Schil is located in the province of Limburg, in the municipality of Heerlen The district has a total area of 408 hectares, of which 408 hectares are land and 0 hectares are water. The district is coded as WK091741. The postcode area is 6416HG-6422PM.
Heerlerbaan-Schil has 5.795 residents. Of these, 49,8% are men and 50,2% are women. Most residents are 45 to 65 years (28,6%). The other age groups are 25,8% for '65 years or older', 21,8% for '25 to 45 years', 13,9% for '0 to 15 years' and 9,9% for '15 to 25 years'. Of the residents, 42,5% is unmarried, 41,7% is married, 9,3% is divorced and 6,6% is widowed. 4.380 residents originate from the Netherlands, 660 come from Europe and 755 come from countries outside Europe.
There are 2.610 households in Heerlerbaan-Schil. 33,5% of these are single-person households, 33,3% households without children and 33,1% households with children. The average household size is 2,1 persons. The national average is 2,1 persons.
In Heerlerbaan-Schil there are 4.600 income recipients. The average income per income recipient is €43.700, which is €1.500 (4%) higher than the national average of €42.200. Per resident, the average income is €36.700, which is €1.800 (5%) higher than the national average of €34.900. Most residents of Heerlerbaan-Schil are educated to an intermediate level. 41,5% have an intermediate education (HAVO, VWO or MBO 2-4), 33,6% have a university or higher professional education (HBO/WO) and 24,9% have a lower education (VMBO or MBO 1).
Of the 5.795 residents, around 67% are in paid employment, which amounts to 3.883 people. This is 5% lower than the national average of 72%. The majority of workers are in salaried employment (86%), while 14% are self-employed. In Heerlerbaan-Schil, 33% of residents receive a benefit. The largest group is those receiving a state pension (AOW). 1.340 people receive this benefit.
In Heerlerbaan-Schil there are 2.623 homes with an average assessed value (WOZ) of €323.000. Of these, around 97% are occupied and 3% unoccupied. Most homes are owner-occupied. This amounts to 34% rental homes and 66% owner-occupied homes. Of the homes, 67% privately owned, 18% owned by housing associations and 15% owned by other landlords. The most common construction periods in Heerlerbaan-Schil are 1980-1990 (32%) and 1990-2000 (16%).
There are currently no homes for sale in Heerlerbaan-Schil. The most recently listed home is Ruth Firststraat 15 by Leenen Vastgoed op Funda. No homes were sold in Heerlerbaan-Schil over the past year.
There are currently no homes for rent in Heerlerbaan-Schil. The most recent home is Parc Imstenrade 9, offered by Woonhuis Limburg op Pararius. No homes were let in Heerlerbaan-Schil over the past year.
No recent rental data available for Heerlerbaan-Schil.
In Heerlerbaan-Schil there are 1.637 addresses with a registered energy label. The most common labels are C (32%), B (23%) and A (23%). On average, an address in Heerlerbaan-Schil uses 2.820 kWh of electricity per year. This is 11% above the national average of 2.550 kWh. With an annual consumption of 780 m³ per address, natural gas consumption is 3% below the national average of 800 m³.
Giezenveld is a neighbourhood I look back on with mixed feelings. On the one hand, it's a quiet area with lots of greenery and playgrounds, making it quite attractive for young families. There are quite a few amenities nearby: a supermarket, schools within walking distance, and good connections to the centre of Heerlen. The bus stops are close by and usually on time, making it easy to stay mobile without a car. As for safety, I generally feel fine, although there have been moments when it felt less pleasant, especially in the evenings. It depends a lot on which street you live on. The community is quite mixed: some neighbours are very friendly and involved, while others are very private. There isn't a lot of social cohesion, but if you take the initiative yourself, you can build something up. Hygiene varies; some streets are well-maintained, others less so. You do see the municipal services regularly coming by to maintain the greenery. Overall, it's not a neighbourhood with much nuisance, but it's also not the most bustling or lively place. For those looking for peace and quiet with all basic amenities nearby, Giezenveld is a fine place to live.
Auto-translated to English by AIThe neighbourhood has a bad reputation
Auto-translated to English by AIIt's Heerlen, a neighbourhood where you never hear anything positive about liveability, safety and well-being, but luckily I still find Giezenveld (where I live) a familiar, pleasant and safe neighbourhood. Plenty of playgrounds for children, various supermarkets within walking distance and good accessibility with several buses per hour going along different sides.
Auto-translated to English by AIThe housing stock is mainly post-war — 55% was built between 1945 and 1990. In addition, the most common type is terraced houses (40%).
Over the past year a home for sale in Heerlerbaan-Schil was listed for an average of €444,388 (€2,834 per m²). That is 16% below the Dutch national average. Last quarter prices rose by 48%.
Residents give Heerlerbaan-Schil a 7.3 out of 10 based on 3 reviews. Especially accessibility (9.0) scores well; cleanliness (5.3) receives the lowest rating.
The housing supply in Heerlerbaan-Schil is remarkably efficient: 55% has an A, A+ or B label. The average natural gas consumption per household is 780 m³ per year.
From Heerlerbaan-Schil you can on average reach a supermarket at 0.8 km, a GP at 1.0 km, a railway station at 3.8 km, a primary school at 0.9 km (as the crow flies, source: CBS).
Right now you will find 28 homes for sale and 3 homes for rent in Heerlerbaan-Schil.