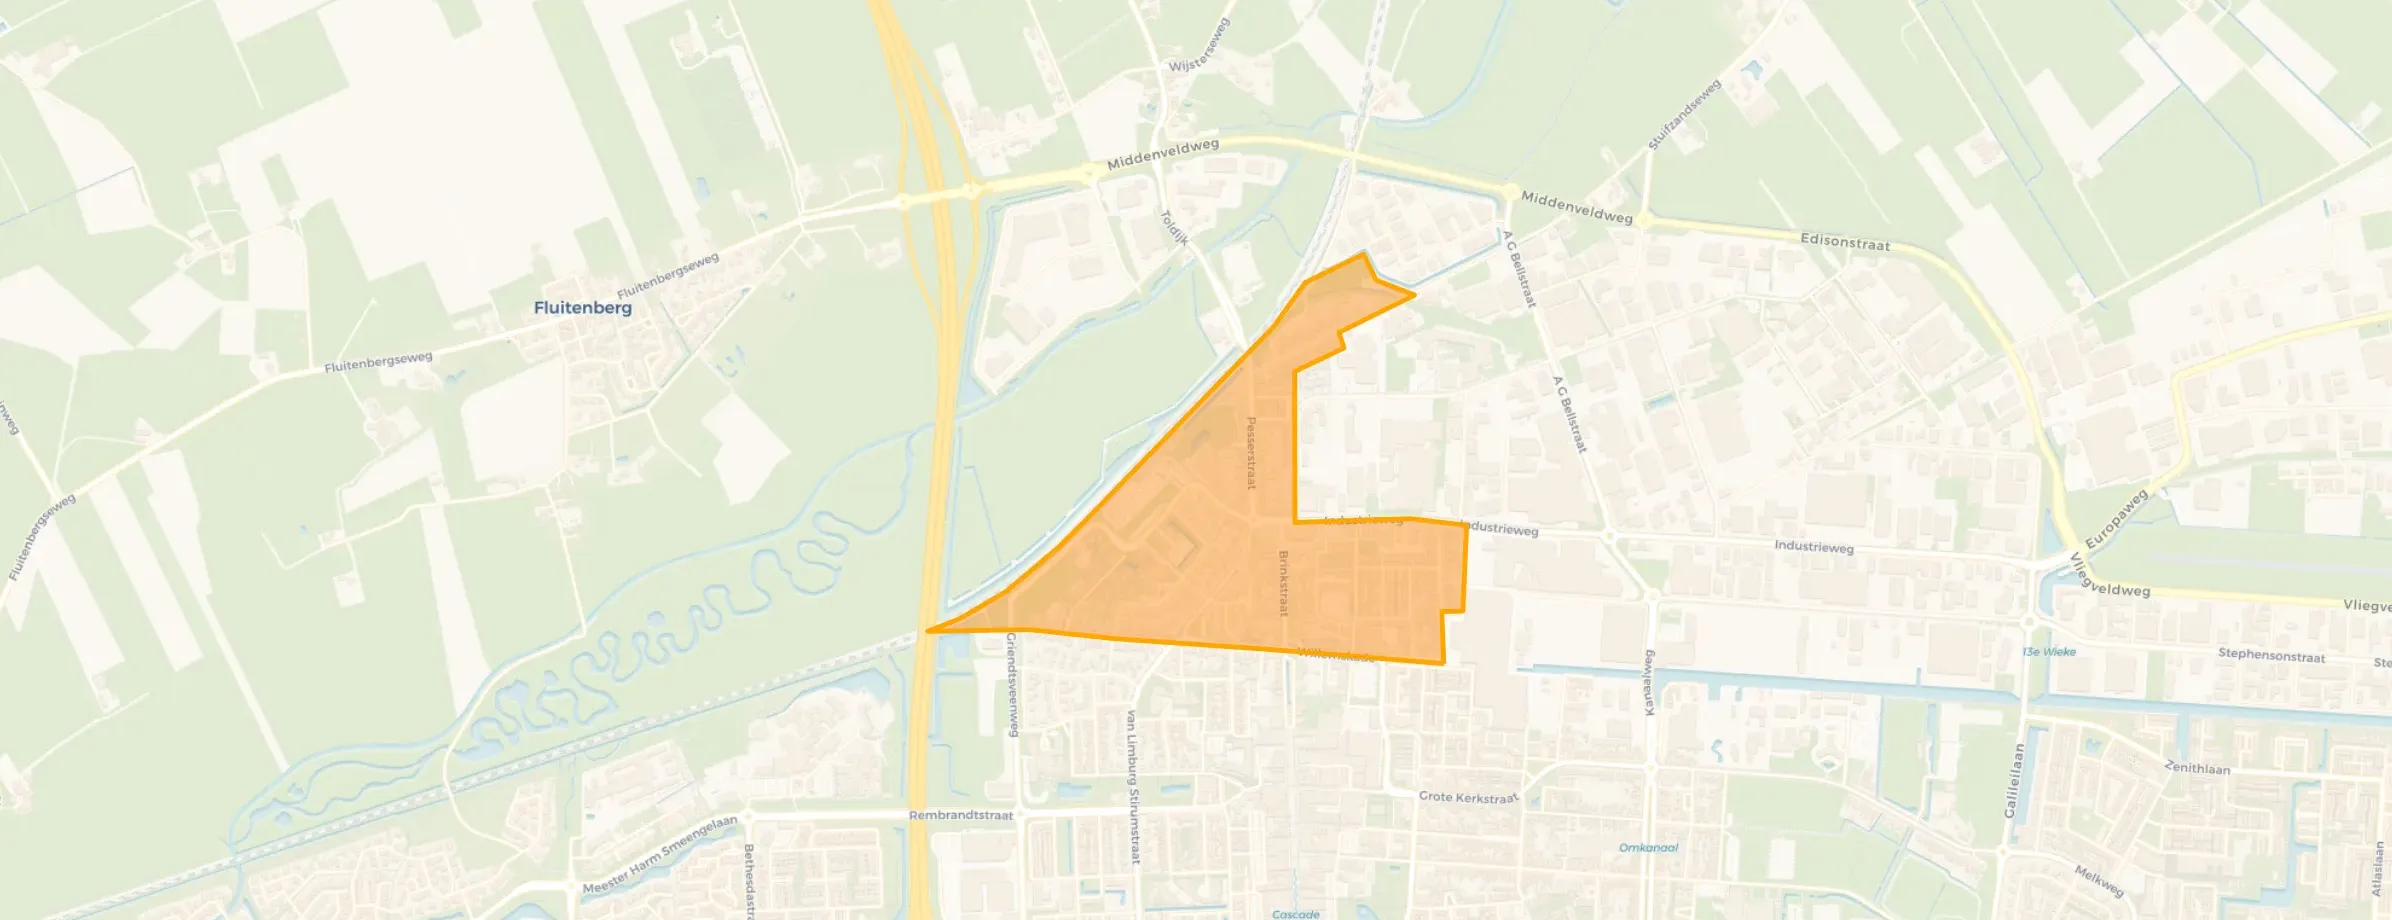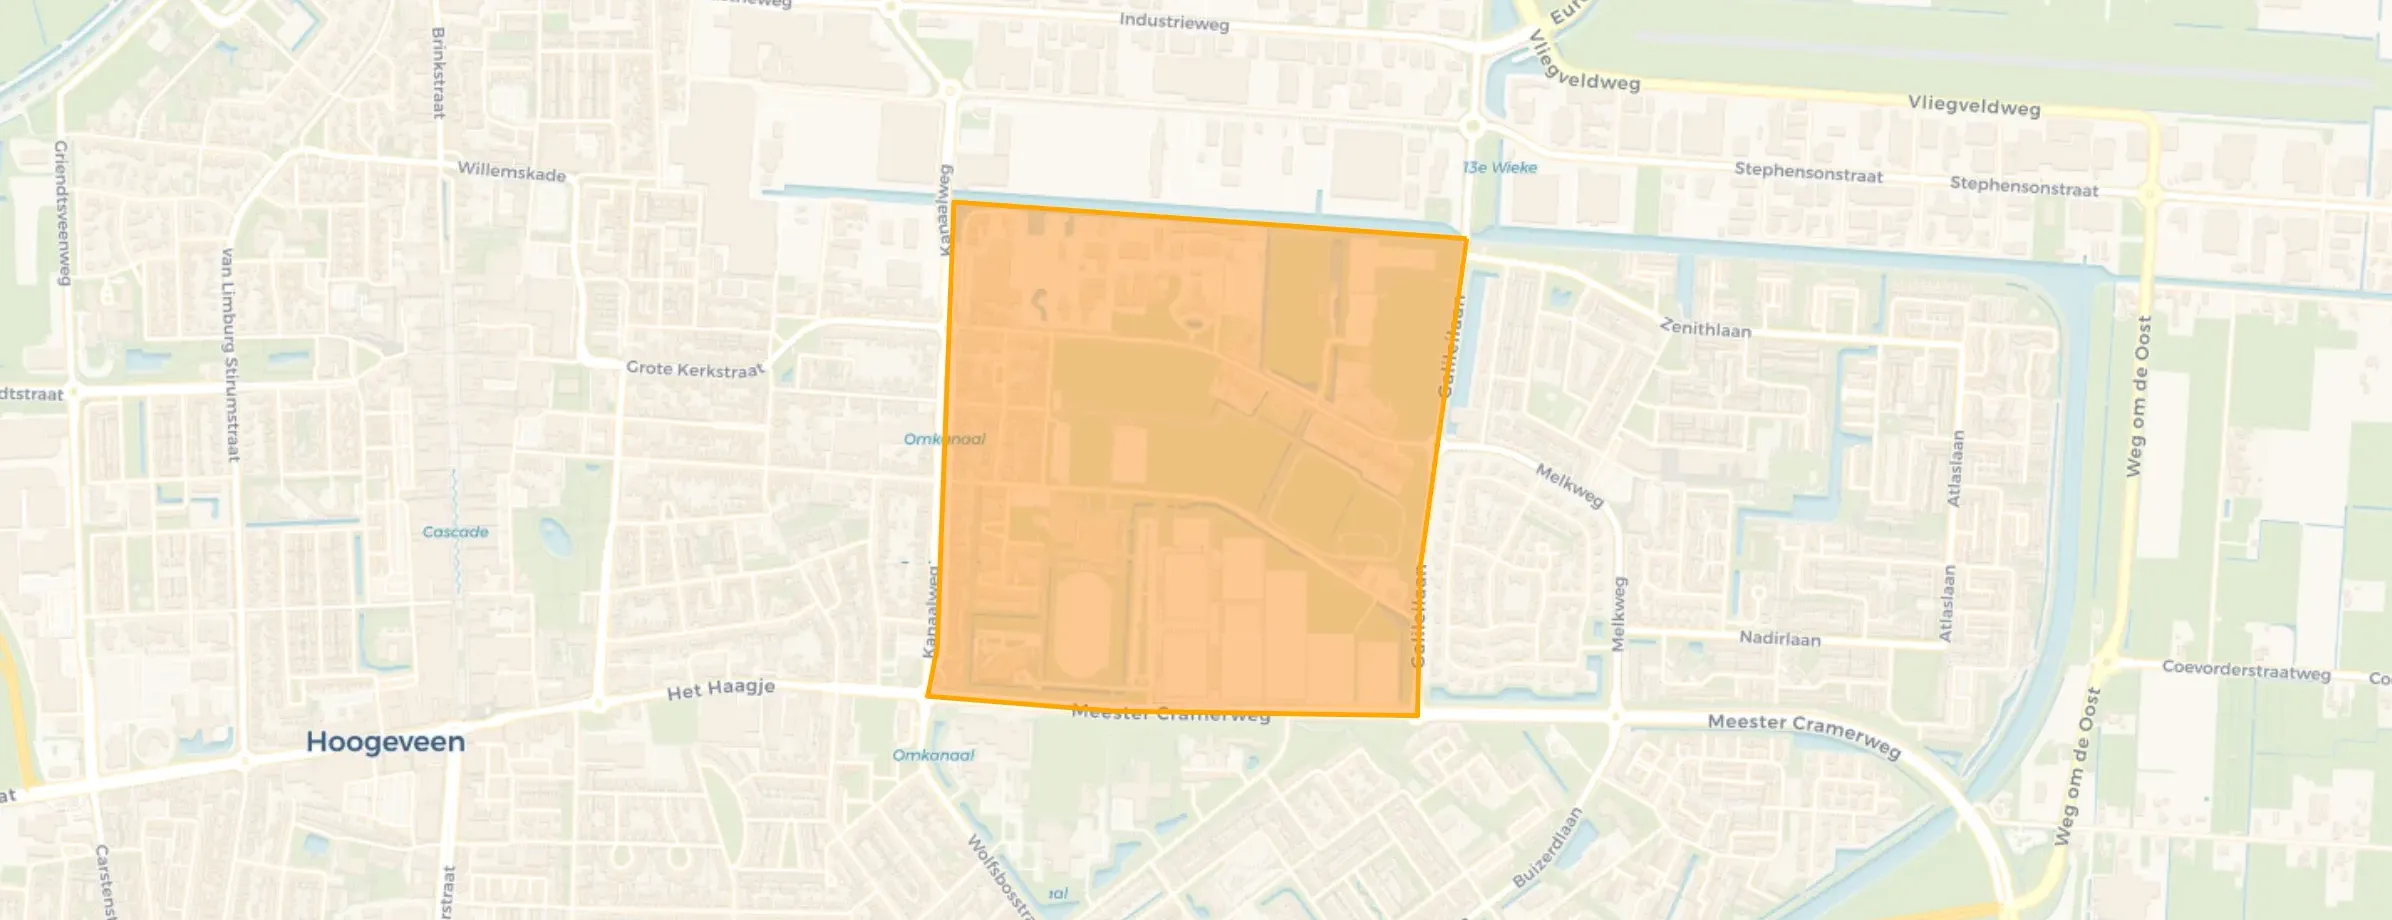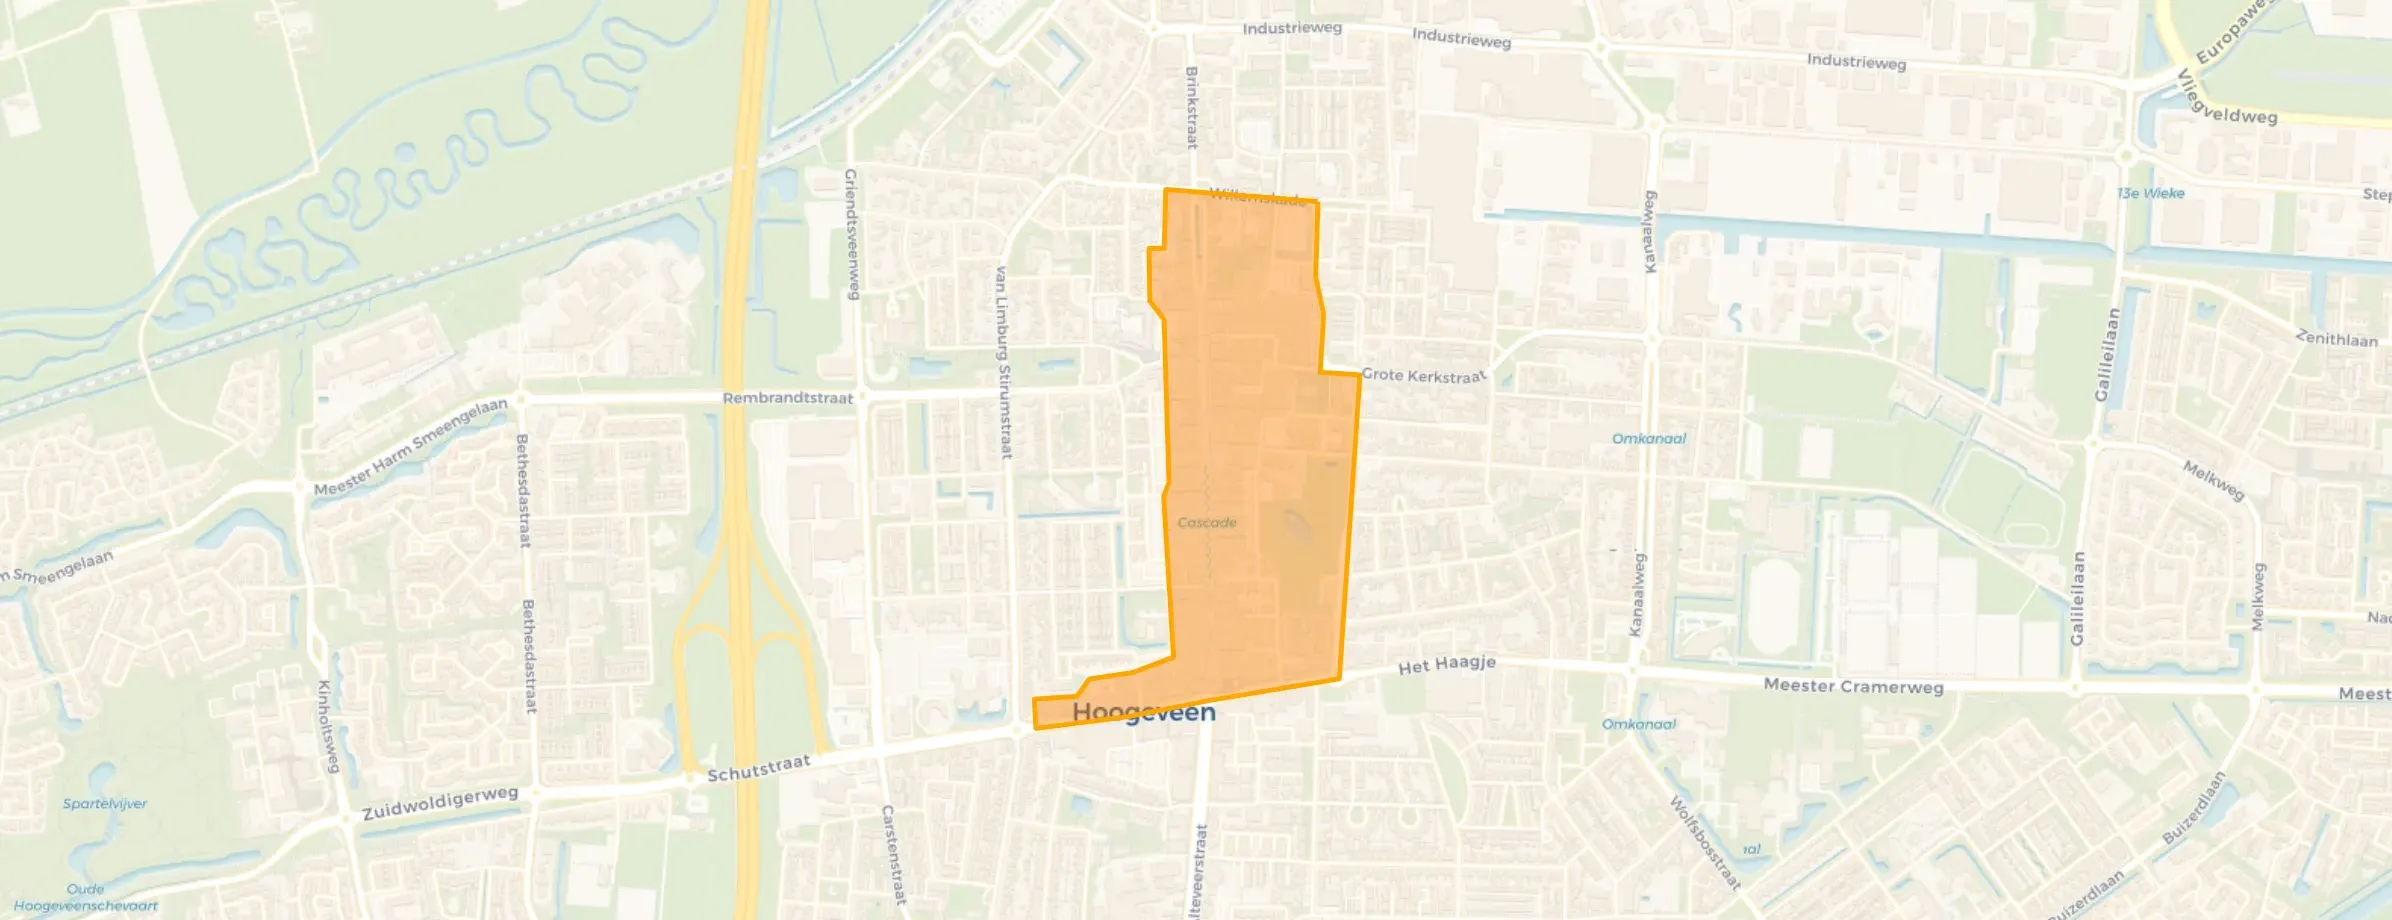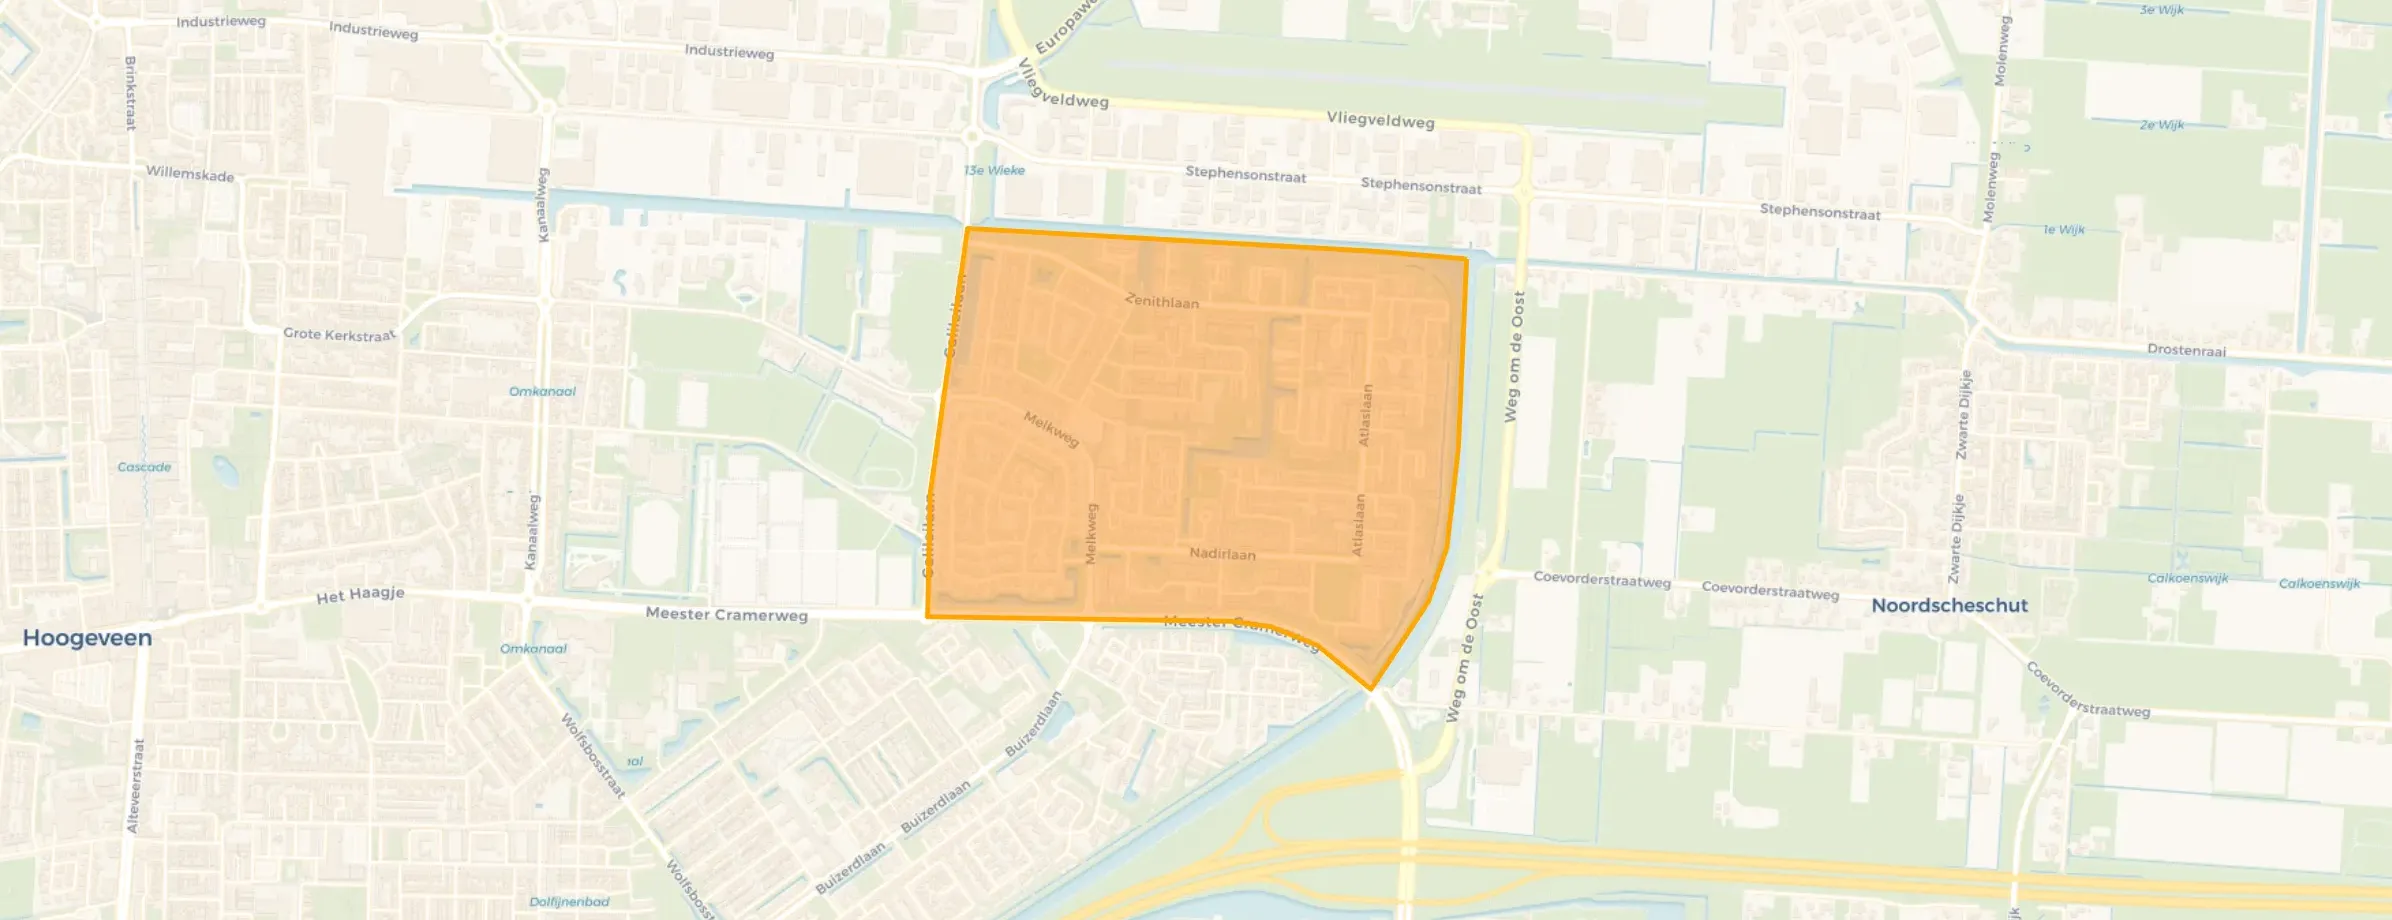
District in Hoogeveen
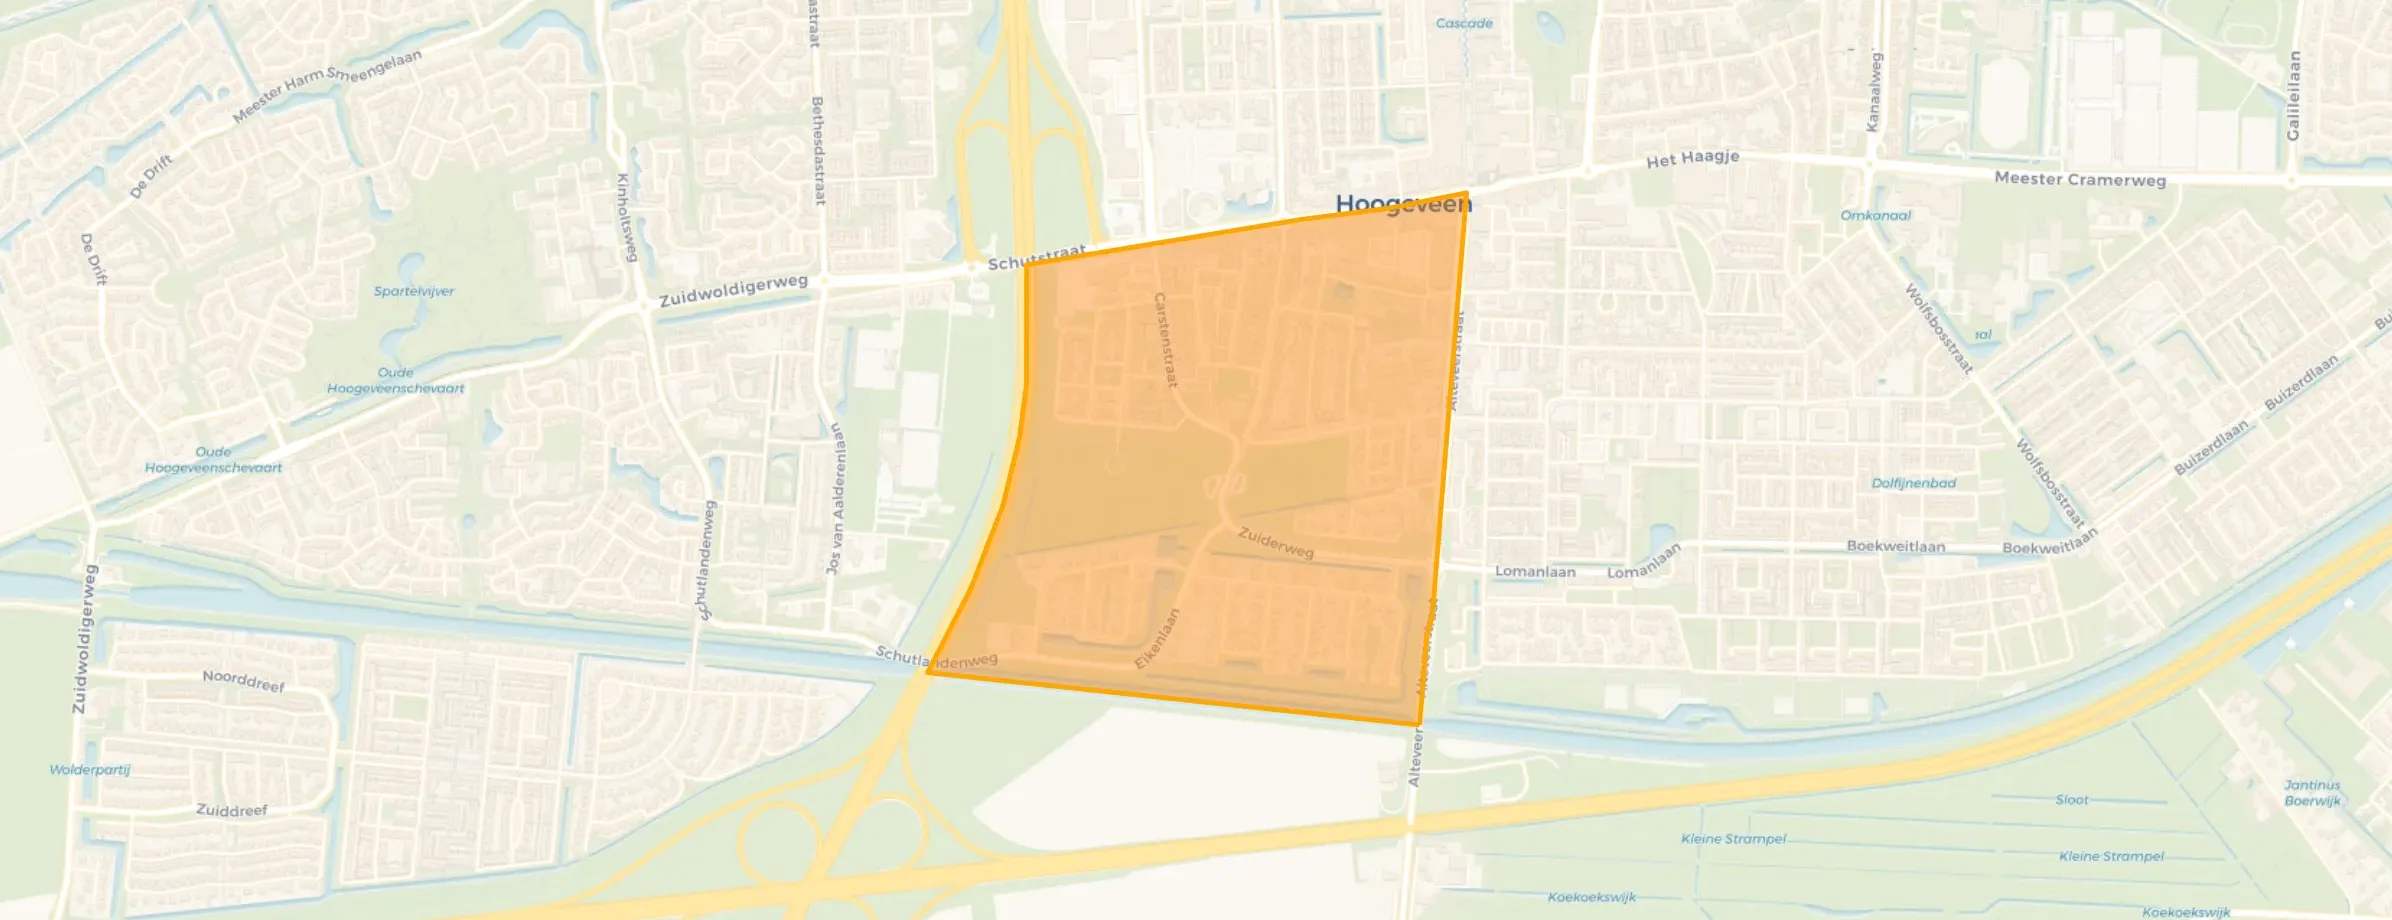
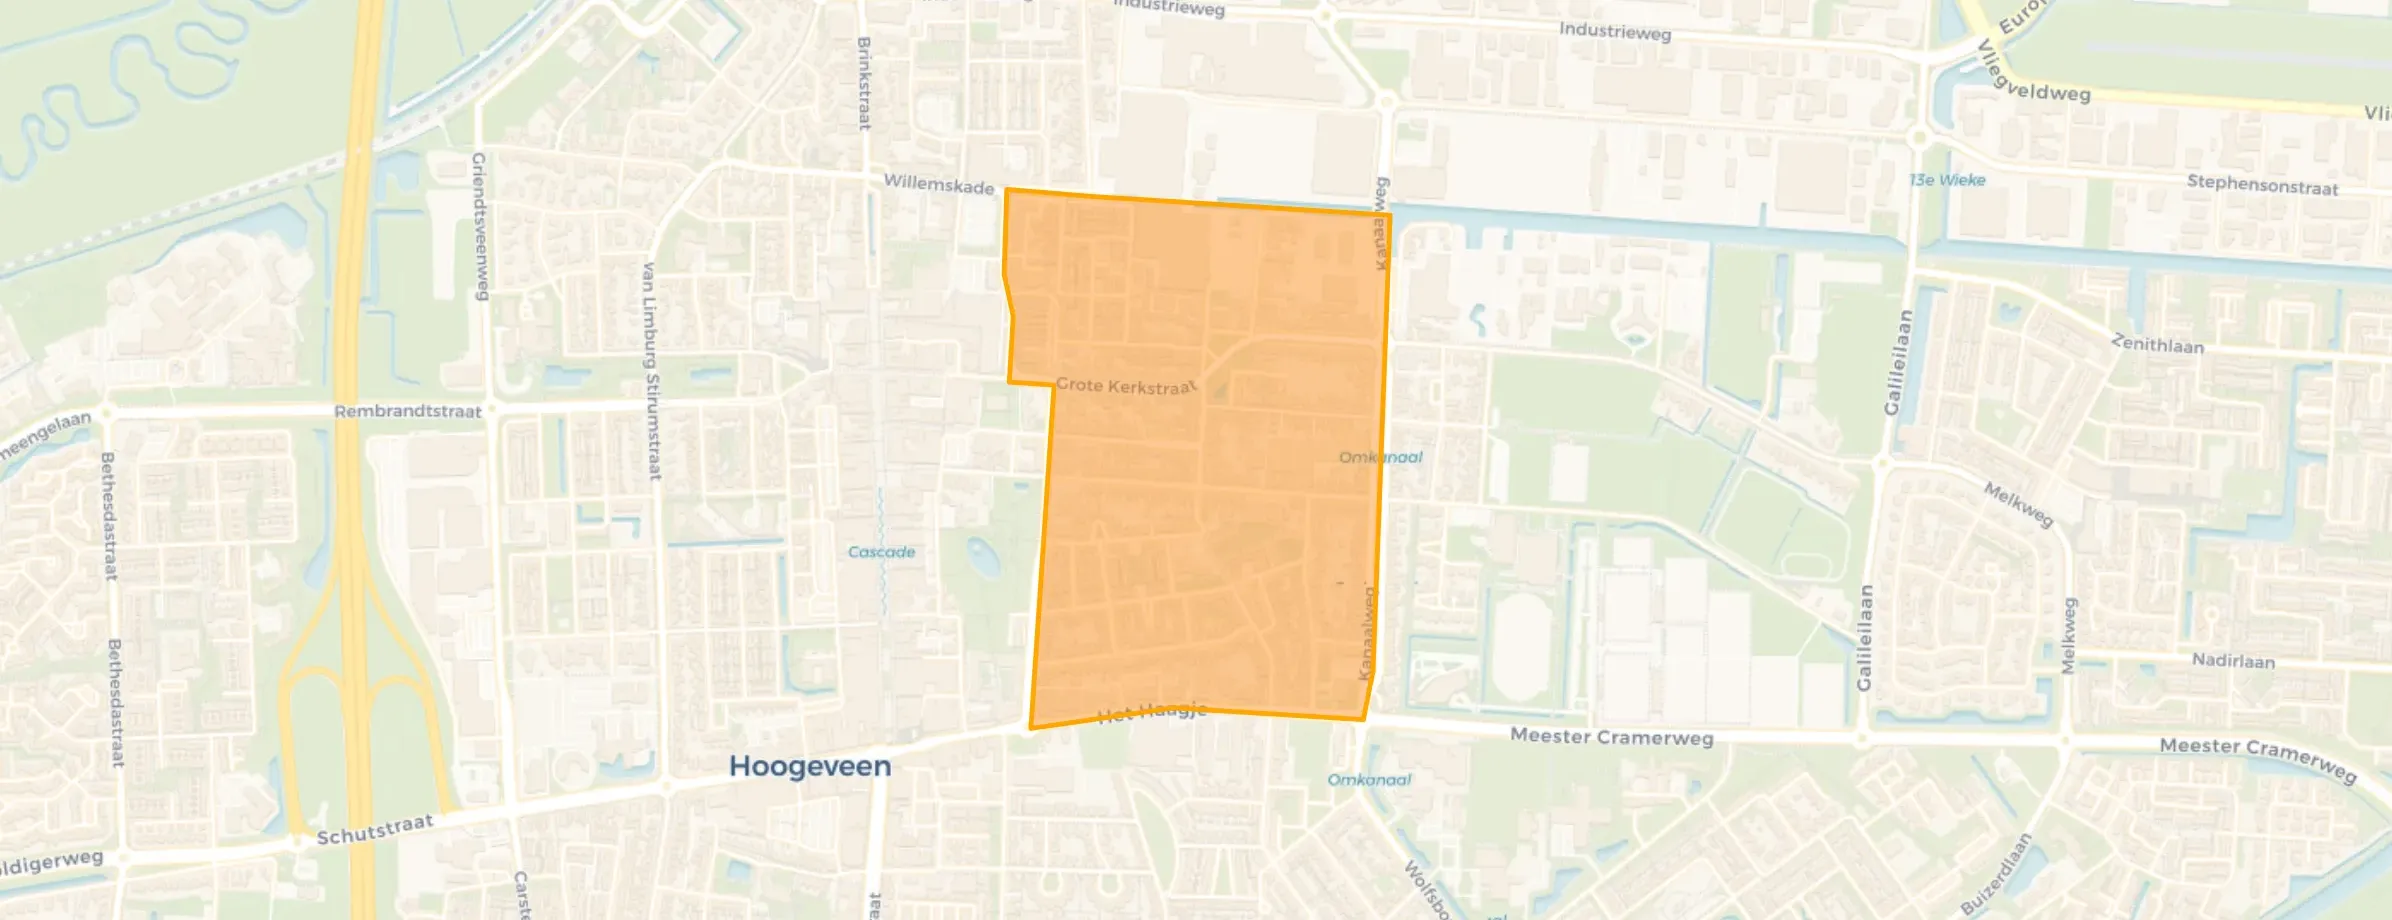
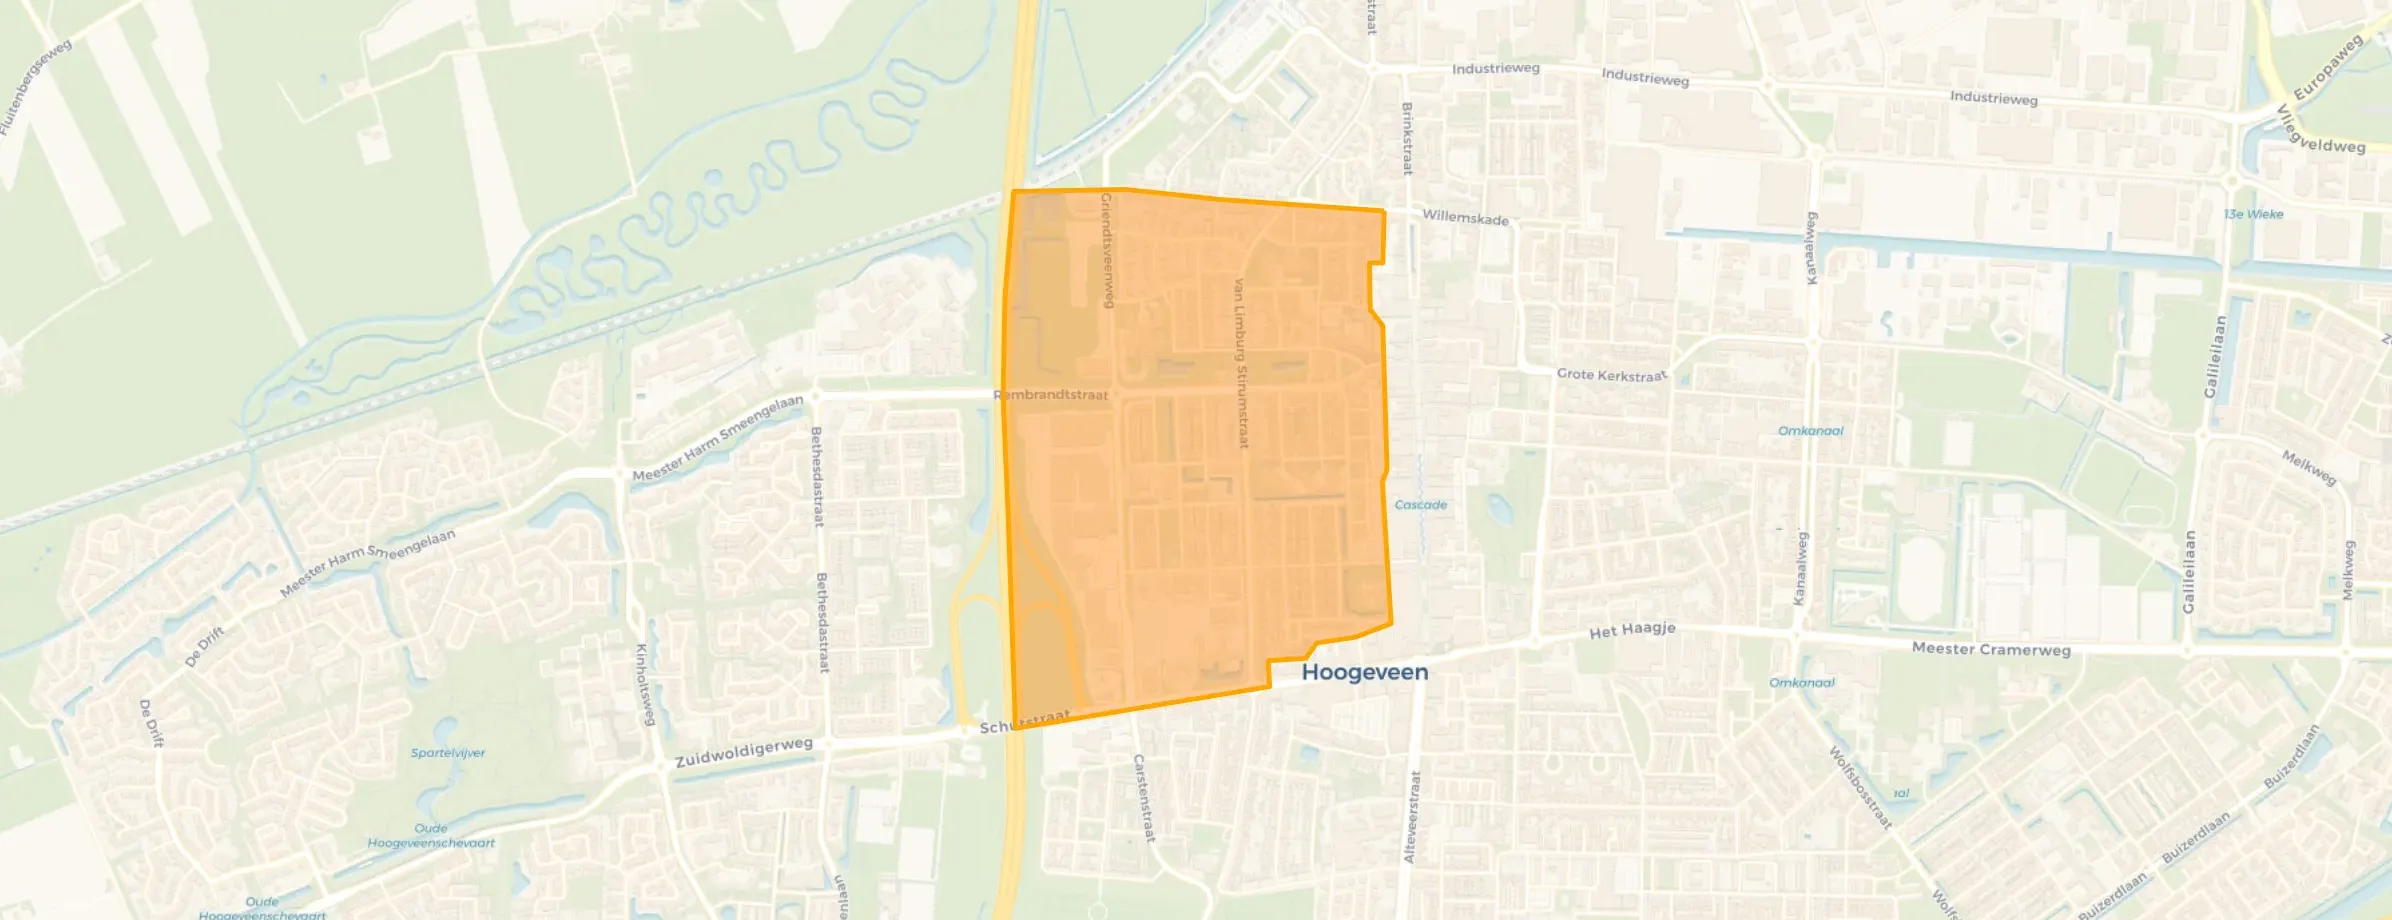
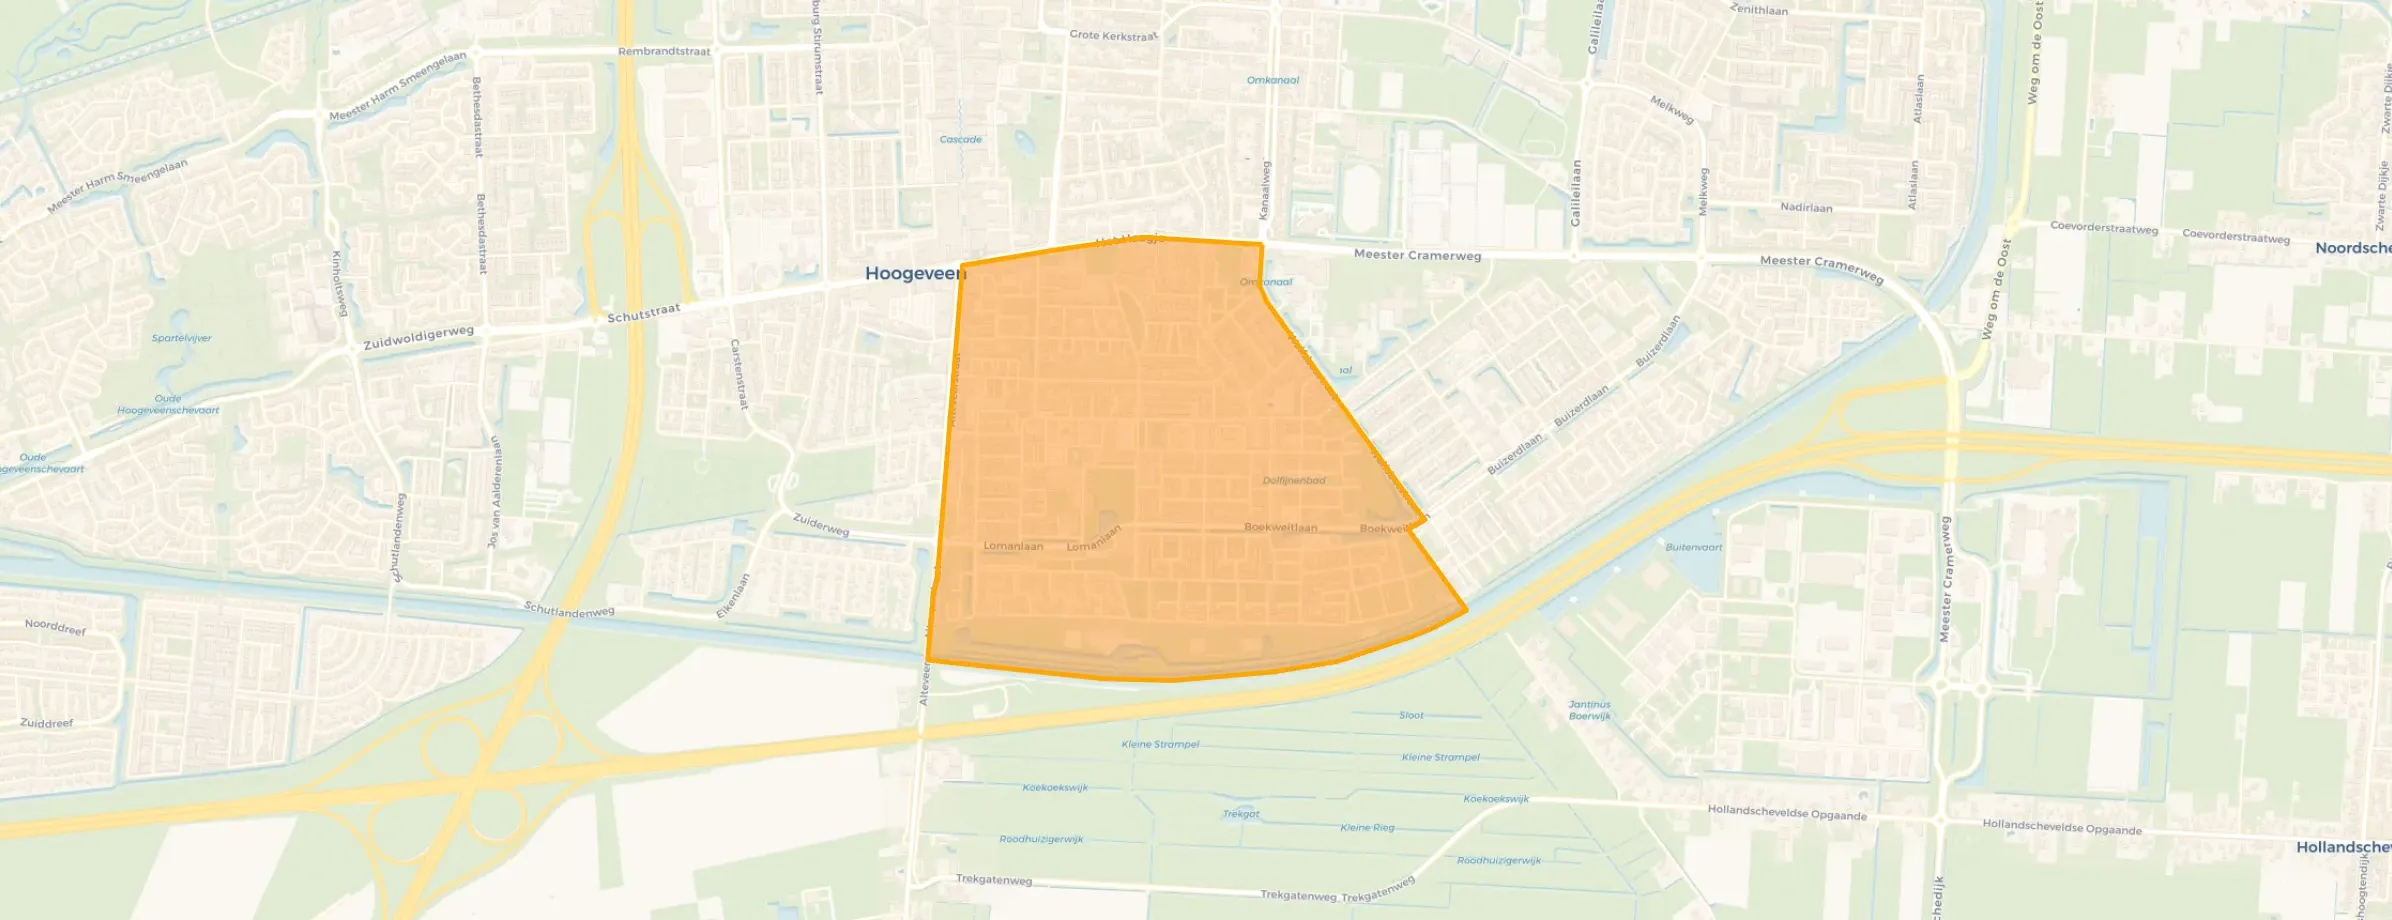
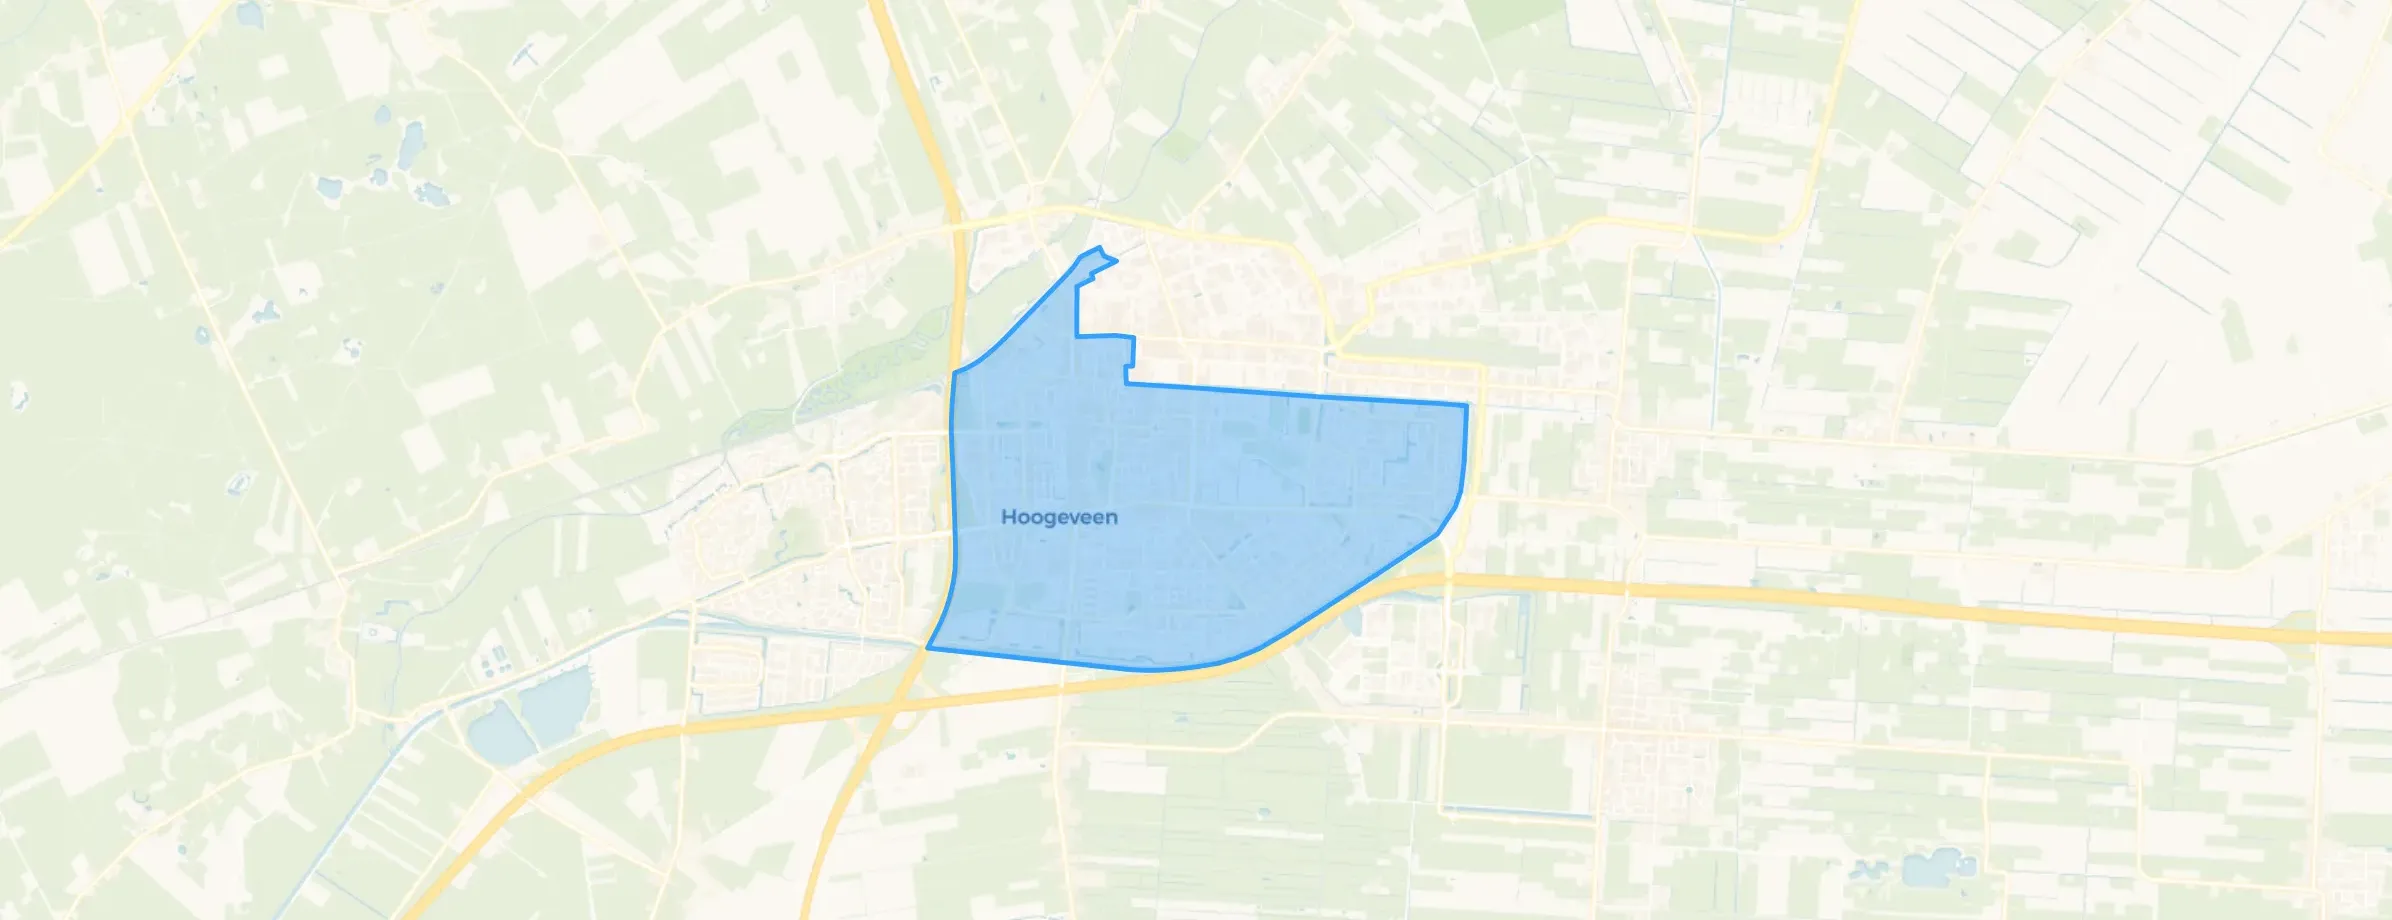
Hoogeveen is located in the province of Drenthe, in the municipality of Hoogeveen The district has a total area of 692 hectares, of which 680 hectares are land and 13 hectares are water. The district is coded as WK011850. The postcode area is 7901AA-7907EN.
Hoogeveen has 25.750 residents. Of these, 49,7% are men and 50,3% are women. Most residents are 45 to 65 years (24,9%). The other age groups are 24,9% for '65 years or older', 24,7% for '25 to 45 years', 13,6% for '0 to 15 years' and 12,0% for '15 to 25 years'. Of the residents, 48,4% is unmarried, 34,7% is married, 9,7% is divorced and 7,3% is widowed. 20.465 residents originate from the Netherlands, 1.845 come from Europe and 3.440 come from countries outside Europe.
There are 12.685 households in Hoogeveen. 45,1% of these are single-person households, 26,8% households without children and 28,1% households with children. The average household size is 2,0 persons. The national average is 2,1 persons.
In Hoogeveen there are 20.900 income recipients. The average income per income recipient is €32.800, which is €9.400 (22%) lower than the national average of €42.200. Per resident, the average income is €27.500, which is €7.400 (21%) lower than the national average of €34.900. Most residents of Hoogeveen are educated to an intermediate level. 46,0% have an intermediate education (HAVO, VWO or MBO 2-4), 38,5% have a lower education (VMBO or MBO 1) and 15,5% have a university or higher professional education (HBO/WO).
Of the 25.750 residents, around 68% are in paid employment, which amounts to 17.510 people. This is 4% lower than the national average of 72%. The majority of workers are in salaried employment (90%), while 10% are self-employed. In Hoogeveen, 34% of residents receive a benefit. The largest group is those receiving a state pension (AOW). 5.830 people receive this benefit.
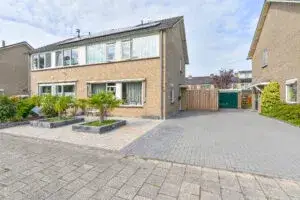
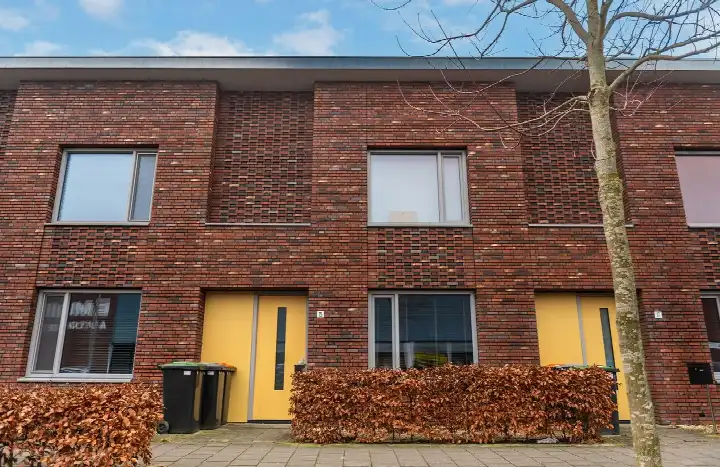
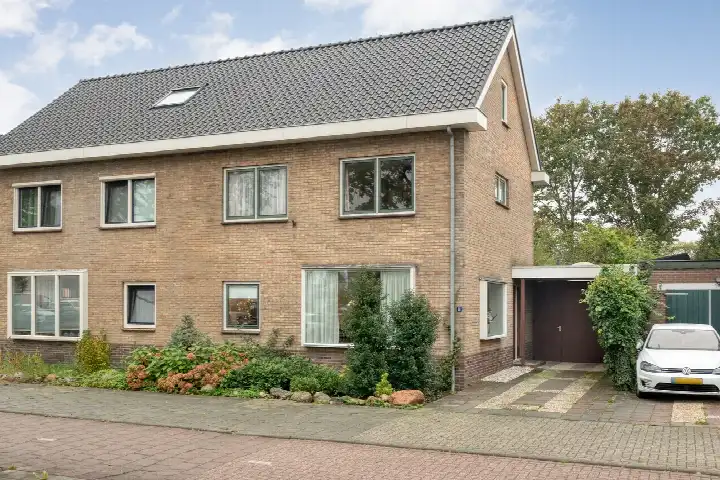
In Hoogeveen there are 13.307 homes with an average assessed value (WOZ) of €233.000. Of these, around 95% are occupied and 5% unoccupied. In Hoogeveen there are roughly as many rental as owner-occupied homes. This amounts to 52% rental homes and 48% owner-occupied homes. Of the homes, 48% privately owned, 40% owned by housing associations and 12% owned by other landlords. The most common construction periods in Hoogeveen are 1950-1970 (39%) and 1970-1980 (21%).
There are currently no homes for sale in Hoogeveen. The most recently listed home is Buizerdlaan 123 by Bruins Makelaardij op Funda. No homes were sold in Hoogeveen over the past year.
There are currently no homes for rent in Hoogeveen. The most recent home is Pottingastraat 62, offered by www.thuiskompas.nl. No homes were let in Hoogeveen over the past year.
No recent rental data available for Hoogeveen.
In Hoogeveen there are 10.474 addresses with a registered energy label. The most common labels are A (36%), C (23%) and B (11%). On average, an address in Hoogeveen uses 2.250 kWh of electricity per year. This is 12% below the national average of 2.550 kWh. Natural gas consumption, at 830 m³ per year, is 4% above the national average of 800 m³.
Nice neighbourhood where people look out for each other, help each other and tolerate each other. Sometimes there is a bit of nuisance from youth, but it never lasts long and never gets out of hand because the neighbourhood keeps an eye on things so the police don't have to get involved. Only a shame that the houses are old and in need of replacement. That's the only downside.
Auto-translated to English by AIAll amenities in the neighbourhood for now, but if the council gets its way it will get worse. Many shops have already left the Tamboerpassage because the council preferred them to move to the Hoofdstraat, despite the fact that many residents who are often not very mobile now have to walk a long way from many shops. As for the eye-catcher; it is meant for empty cans and drink cartons but is filled at least several times a week by antisocial neighbours who dump large rubbish bags full of junk in it, making the opening unusable and the rubbish ending up on the grass.
Auto-translated to English by AIThere used to be many more things to do, such as playgrounds and schoolyards, but over time everything has been removed to make way for houses. The neighbourhood has many different cultures and everyone gets along with each other. This neighbourhood is also very close to a swimming pool and shops, such as a supermarket, physiotherapy, childcare, and even several schools.
Auto-translated to English by AIParts of the neighbourhood have become run-down, the shopping centre is old and ugly, lots of loitering youths. A number of flats are really ready to be demolished. Clearly a poorer neighbourhood of Hoogeveen compared to other areas where I have lived before. The centre and station are nicely close by, bus services are also good and there is quite a lot of greenery in the area.
Auto-translated to English by AIEverything good
Auto-translated to English by AISee above
Auto-translated to English by AIThe housing stock is mainly post-war — 70% was built between 1945 and 1990. In addition, the most common type is flats (41%).
Over the past year a home for sale in Hoogeveen was listed for an average of €347,412 (€3,241 per m²). That is 34% below the Dutch national average. Last quarter prices fell by 5%.
A rental home in Hoogeveen cost an average of €1,083 per month (€12 per m²). That is 50% below the national average.
Residents give Hoogeveen a 6.4 out of 10 based on 6 reviews. Accessibility stands out with a 7.2; cleanliness lags behind with a 5.7.
From Hoogeveen you can on average reach a supermarket at 0.6 km, a GP at 1.0 km, a railway station at 2.6 km, a primary school at 0.6 km (as the crow flies, source: CBS).
Right now you will find 105 homes for sale and 15 homes for rent in Hoogeveen.