District in Uithoorn
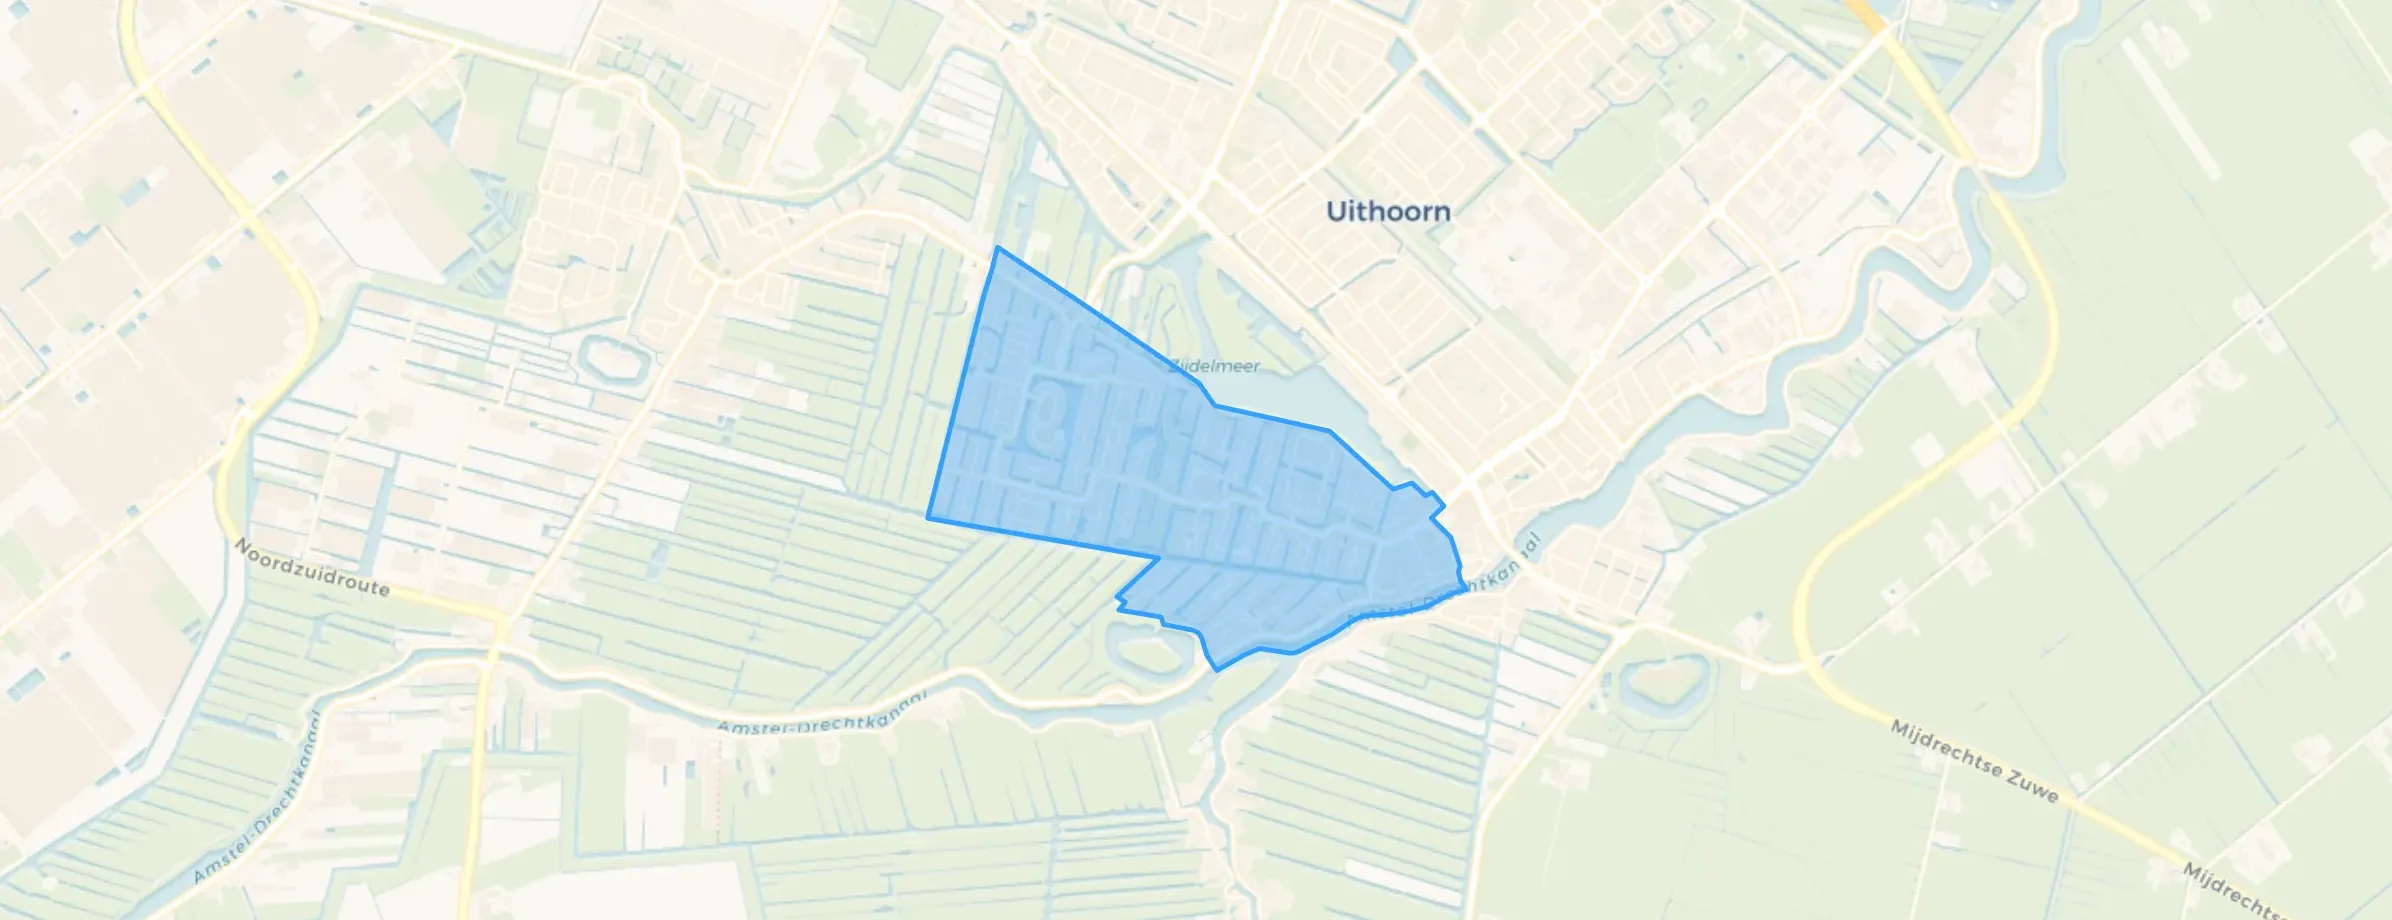
Meerwijk is located in the province of Noord-Holland, in the municipality of Uithoorn The district has a total area of 106 hectares, of which 94 hectares are land and 12 hectares are water. The district is coded as WK045165. The postcode area is 1423AB-1424NH.
Meerwijk has 5.550 residents. Of these, 50,0% are men and 50,1% are women. Most residents are 45 to 65 years (34,4%). The other age groups are 20,6% for '25 to 45 years', 20,0% for '65 years or older', 13,6% for '0 to 15 years' and 11,4% for '15 to 25 years'. Of the residents, 44,1% is unmarried, 45,1% is married, 6,6% is divorced and 4,1% is widowed. 4.210 residents originate from the Netherlands, 425 come from Europe and 915 come from countries outside Europe.
There are 2.405 households in Meerwijk. 29,5% of these are single-person households, 30,4% households without children and 40,1% households with children. The average household size is 2,3 persons.
In Meerwijk there are 4.600 income recipients. The average income per income recipient is €45.300, which is €9.500 (27%) higher than the national average of €35.800. Per resident, the average income is €37.800, which is €8.600 (29%) higher than the national average of €29.200. Most residents of Meerwijk are highly educated. 41,6% have a university or higher professional education (HBO/WO), 39,5% have an intermediate education (HAVO, VWO or MBO 2-4) and 18,9% have a lower education (VMBO or MBO 1).
Of the 5.550 residents, around 69% are in paid employment, which amounts to 3.830 people. This is 4% higher than the national average of 65%. The majority of workers are in salaried employment (86%), while 14% are self-employed. In Meerwijk, 23% of residents receive a benefit. The largest group is those receiving a state pension (AOW). 950 people receive this benefit.
In Meerwijk there are 2.387 homes with an average assessed value (WOZ) of €456.000. Of these, around 99% are occupied and 1% unoccupied. Most homes are owner-occupied. This amounts to 26% rental homes and 74% owner-occupied homes. Of the homes, 74% privately owned, 21% owned by housing associations and 5% owned by other landlords. The most common construction periods in Meerwijk are 1980-1990 (62%) and 1990-2000 (35%).
There are currently no homes for sale in Meerwijk. The most recently listed home is Noorse Lijster 3 by Goedhart Makelaars op Funda. No homes were sold in Meerwijk over the past year.
There are currently no homes for rent in Meerwijk. The most recent home is Grift 63, offered by Voorma & Millenaar Makelaardij op Pararius. No homes were let in Meerwijk over the past year.
No recent rental data available for Meerwijk.
In Meerwijk there are 2.398 addresses with a registered energy label. The most common labels are C (55%), B (33%) and A (8%). On average, an address in Meerwijk uses 2.800 kWh of electricity per year. This is 0% below the national average of 2.810 kWh. With an annual consumption of 1.020 m³ per address, natural gas consumption is 20% below the national average of 1.280 m³.
good neighbourhood many shops/supermarkets good pizzeria italian/turkish 10/10 both
Auto-translated to English by AIIt's a lovely neighbourhood to live in and fun to grow up in, but the connection to other places is very poor and there's little for young people to do to develop themselves.
Auto-translated to English by AIThe people in the neighbourhood are all very kind and polite, and nothing unpleasant ever happens. Waste is properly separated and cleaned up, and there is quite a lot of greenery. However, I would like to see more variety in plants for biodiversity.
Auto-translated to English by AIIn front of our house it's beautifully green. Sometimes you see turtles ? or hedgehogs ? walking in front of our house. In terms of green/nature, living in De Kwakel is fantastic.
Auto-translated to English by AII've lived there for a year and I generally think Meerwijk is beautiful! I feel comfortable with all my neighbours and a few students from the KKC who live here. Everyone is kind and welcoming to me.
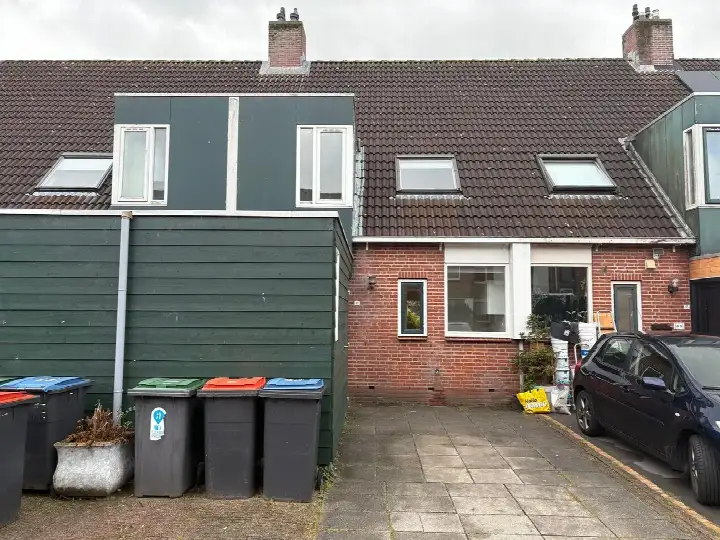
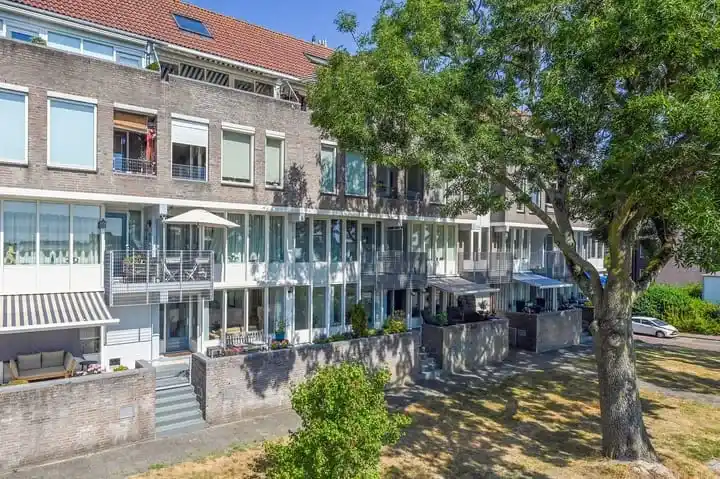
Auto-translated to English by AIThe housing stock is mainly post-war — 58% was built between 1945 and 1990. In addition, the most common type is terraced houses (56%).
Over the past year a home for sale in Meerwijk was listed for an average of €545,904 (€4,727 per m²).
A rental home in Meerwijk cost an average of €2,341 per month (€20 per m²).
Residents give Meerwijk a 8.0 out of 10 based on 5 reviews. The strongest score is for nature and greenery (9.2), the weakest for education (7.0).
Wijk Meerwijk has 5,550 residents. The largest age group is 45 to 65 years (34%). Many families: 40% of the households have children.
The housing supply in Meerwijk is remarkably efficient: 57% has an A, A+ or B label. The average natural gas consumption per household is 1,020 m³ per year.
From Meerwijk you can on average reach a supermarket at 0.9 km, a GP at 2.0 km, a railway station at 12.3 km, a primary school at 0.9 km (as the crow flies, source: CBS).
Right now you will find 14 homes for sale and 2 homes for rent in Meerwijk.