District in Waterland
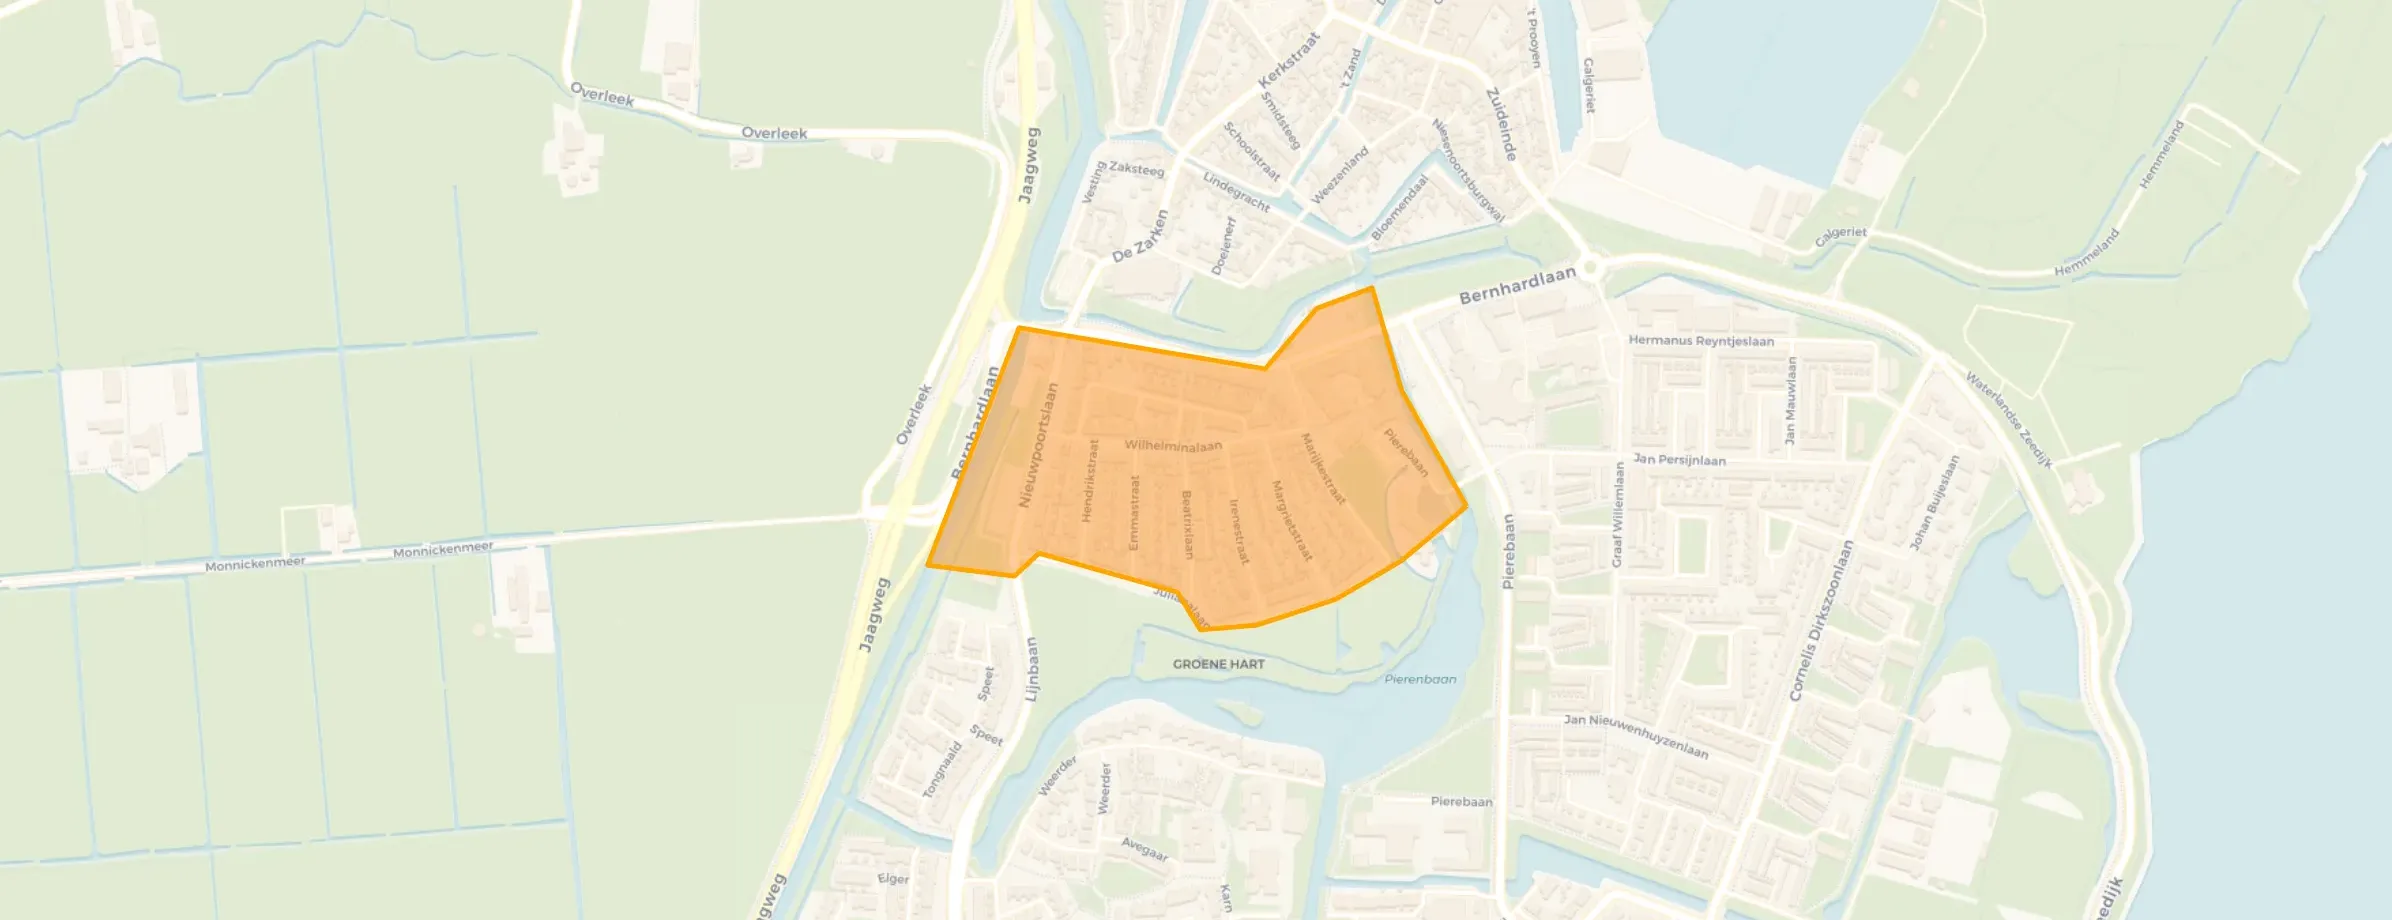
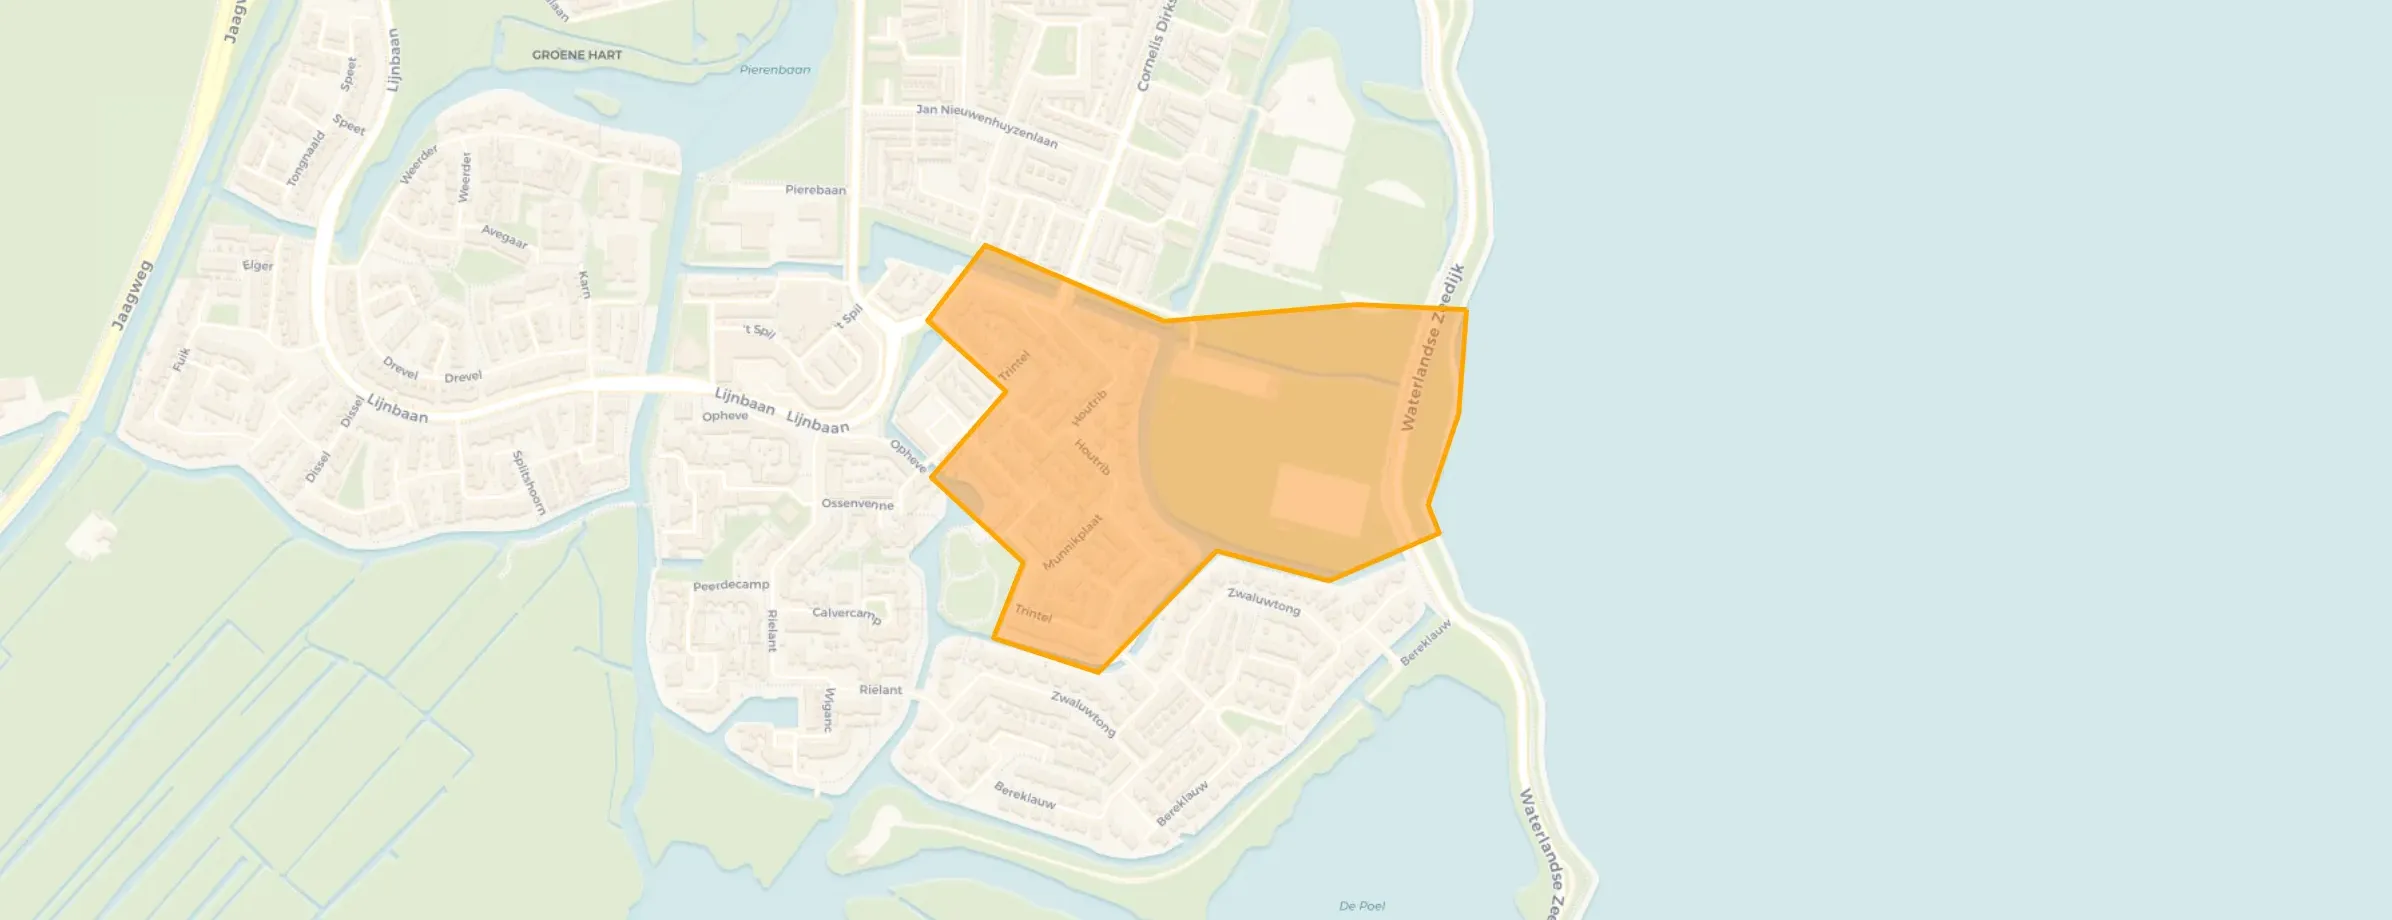
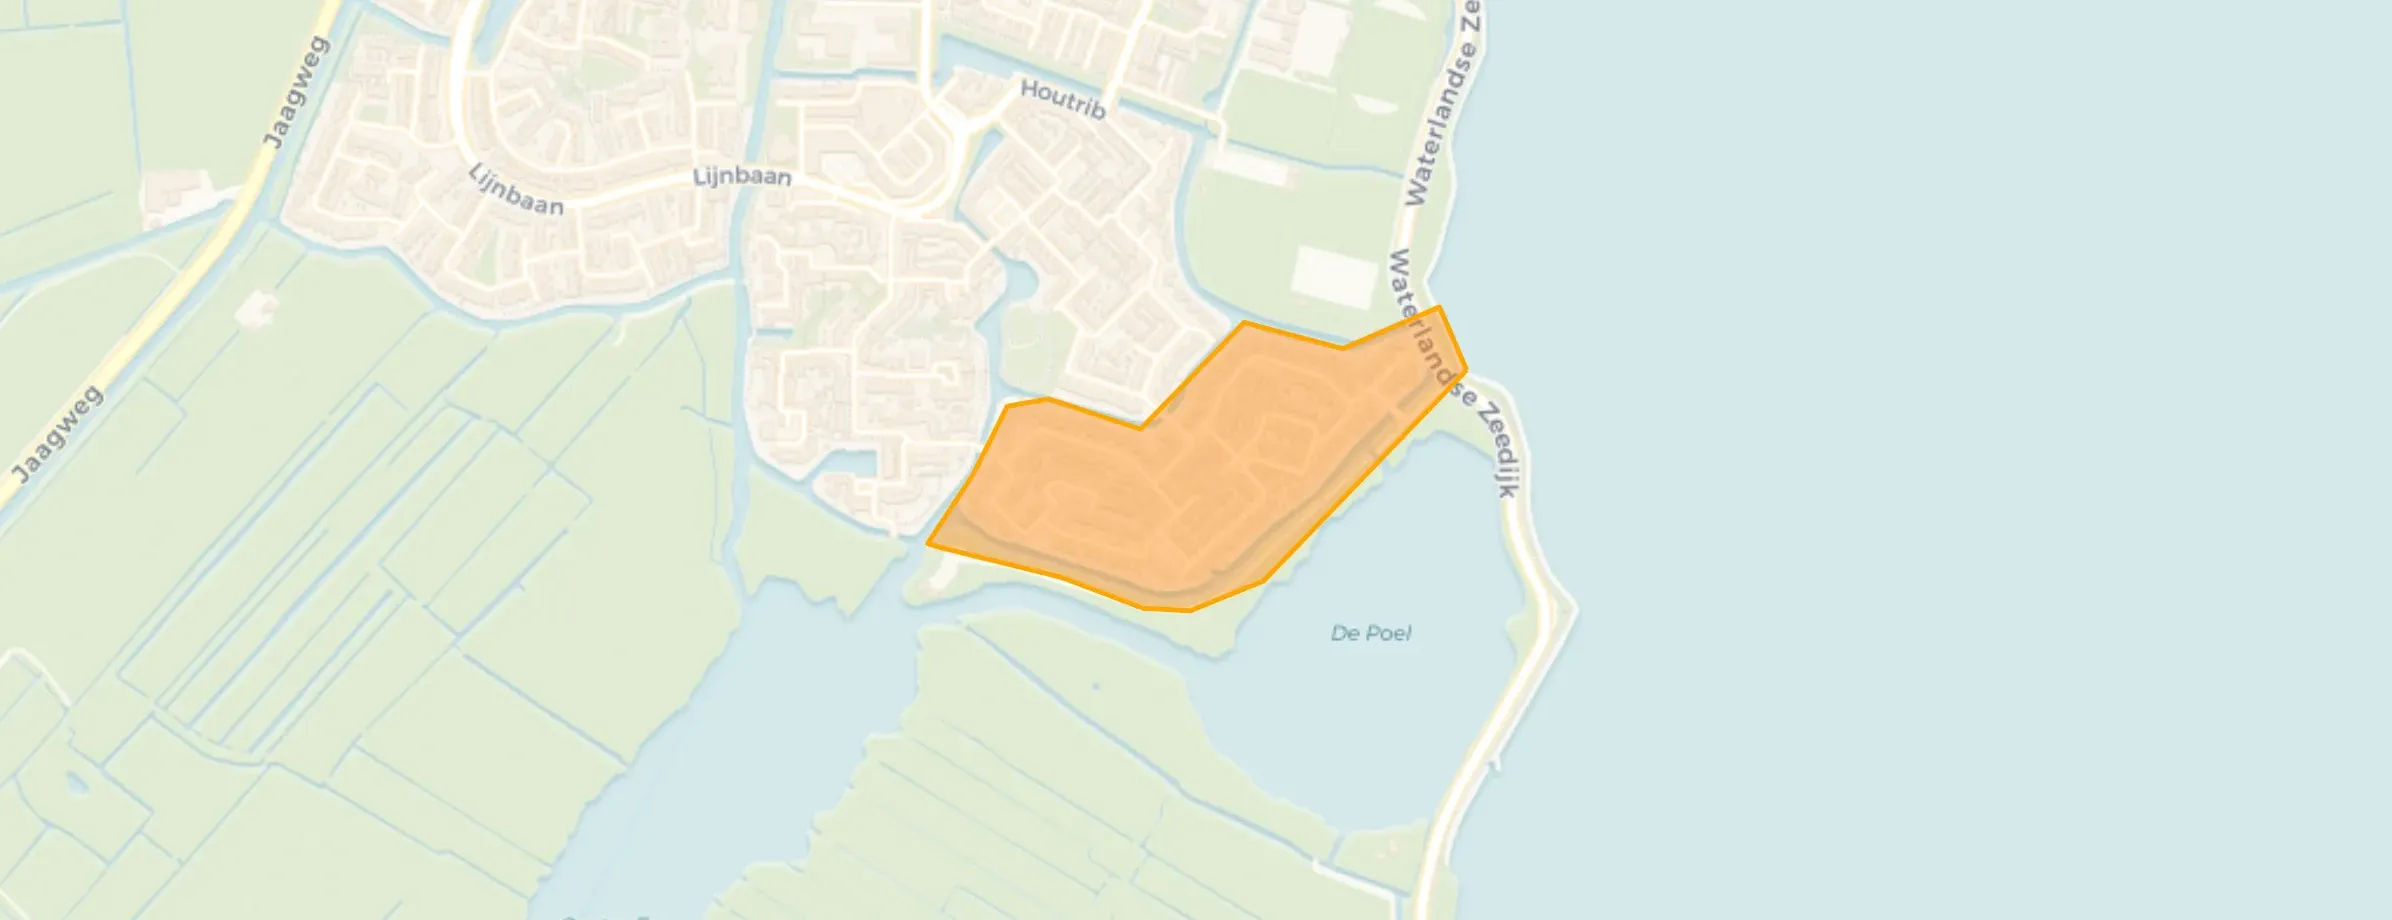
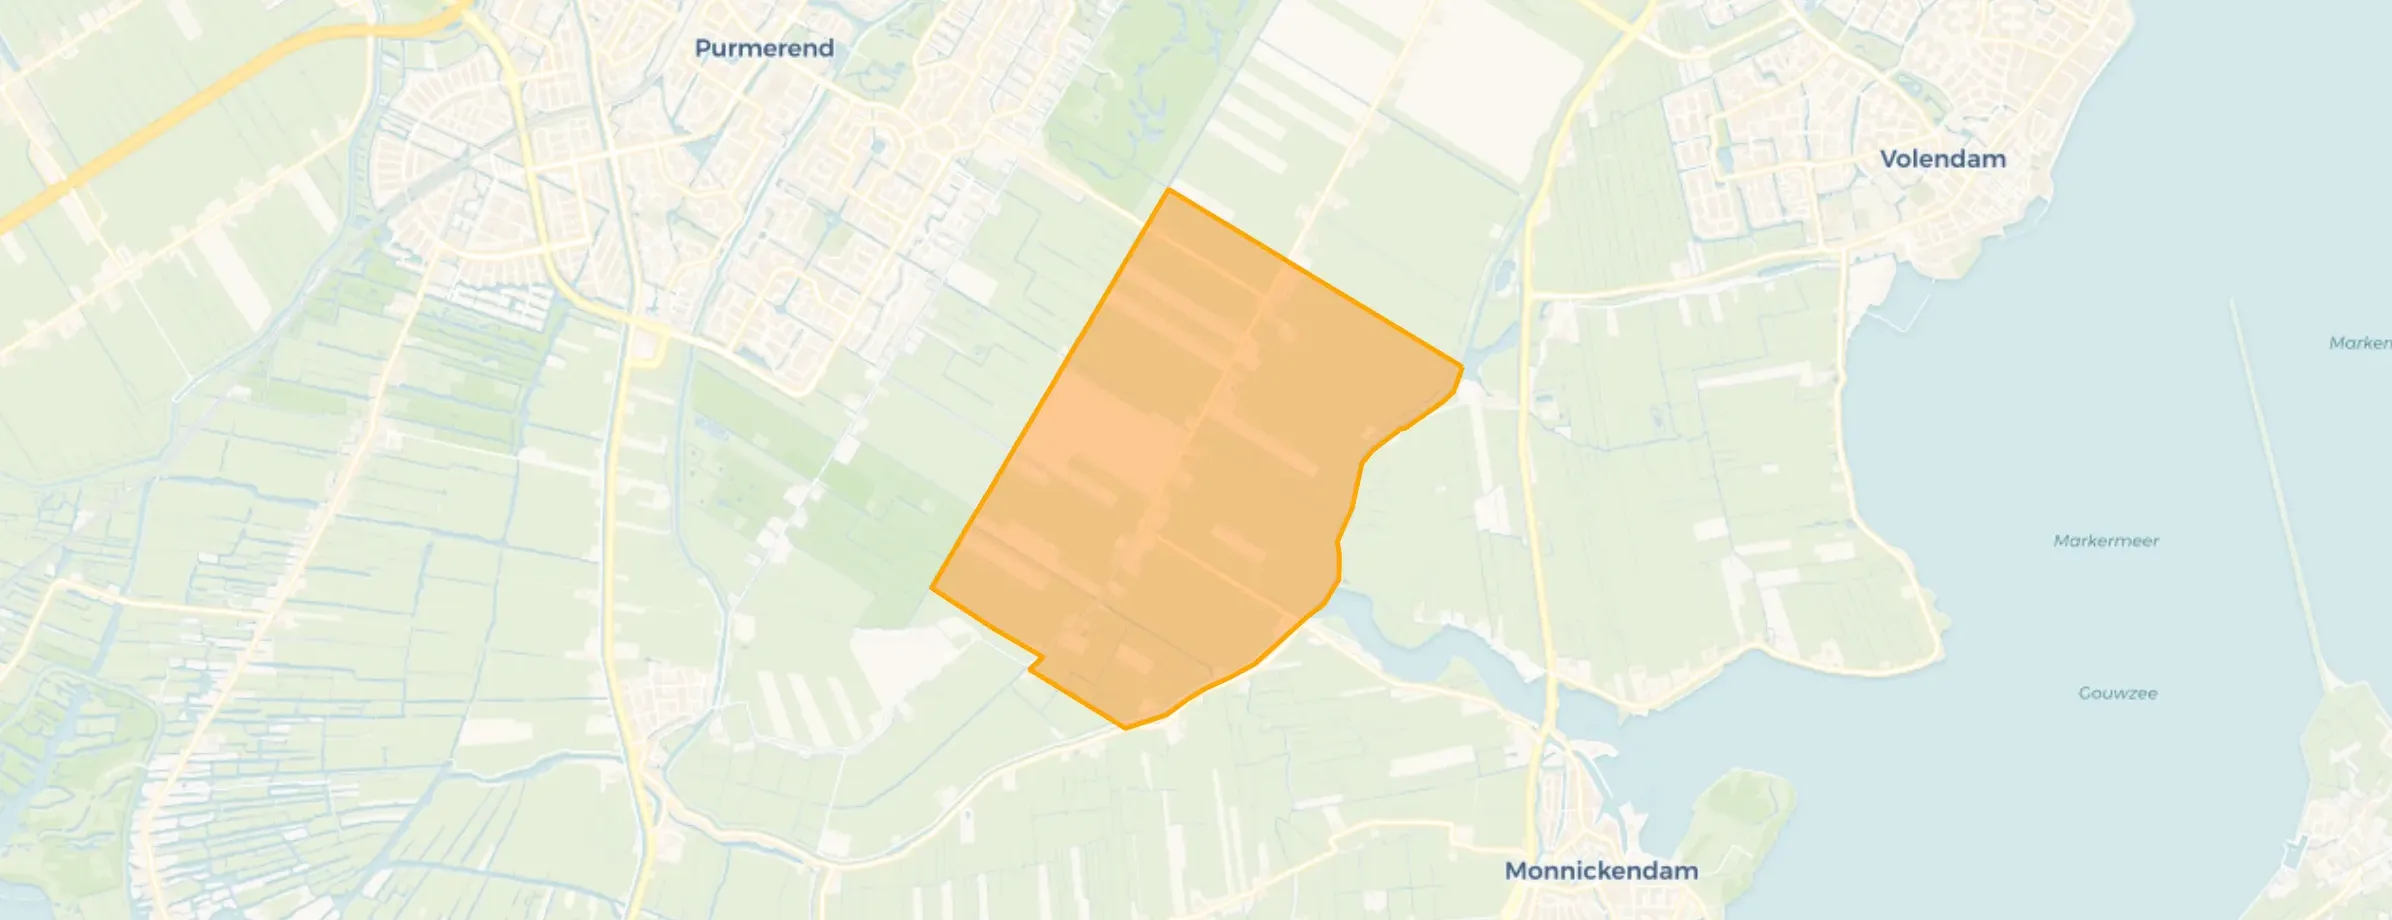
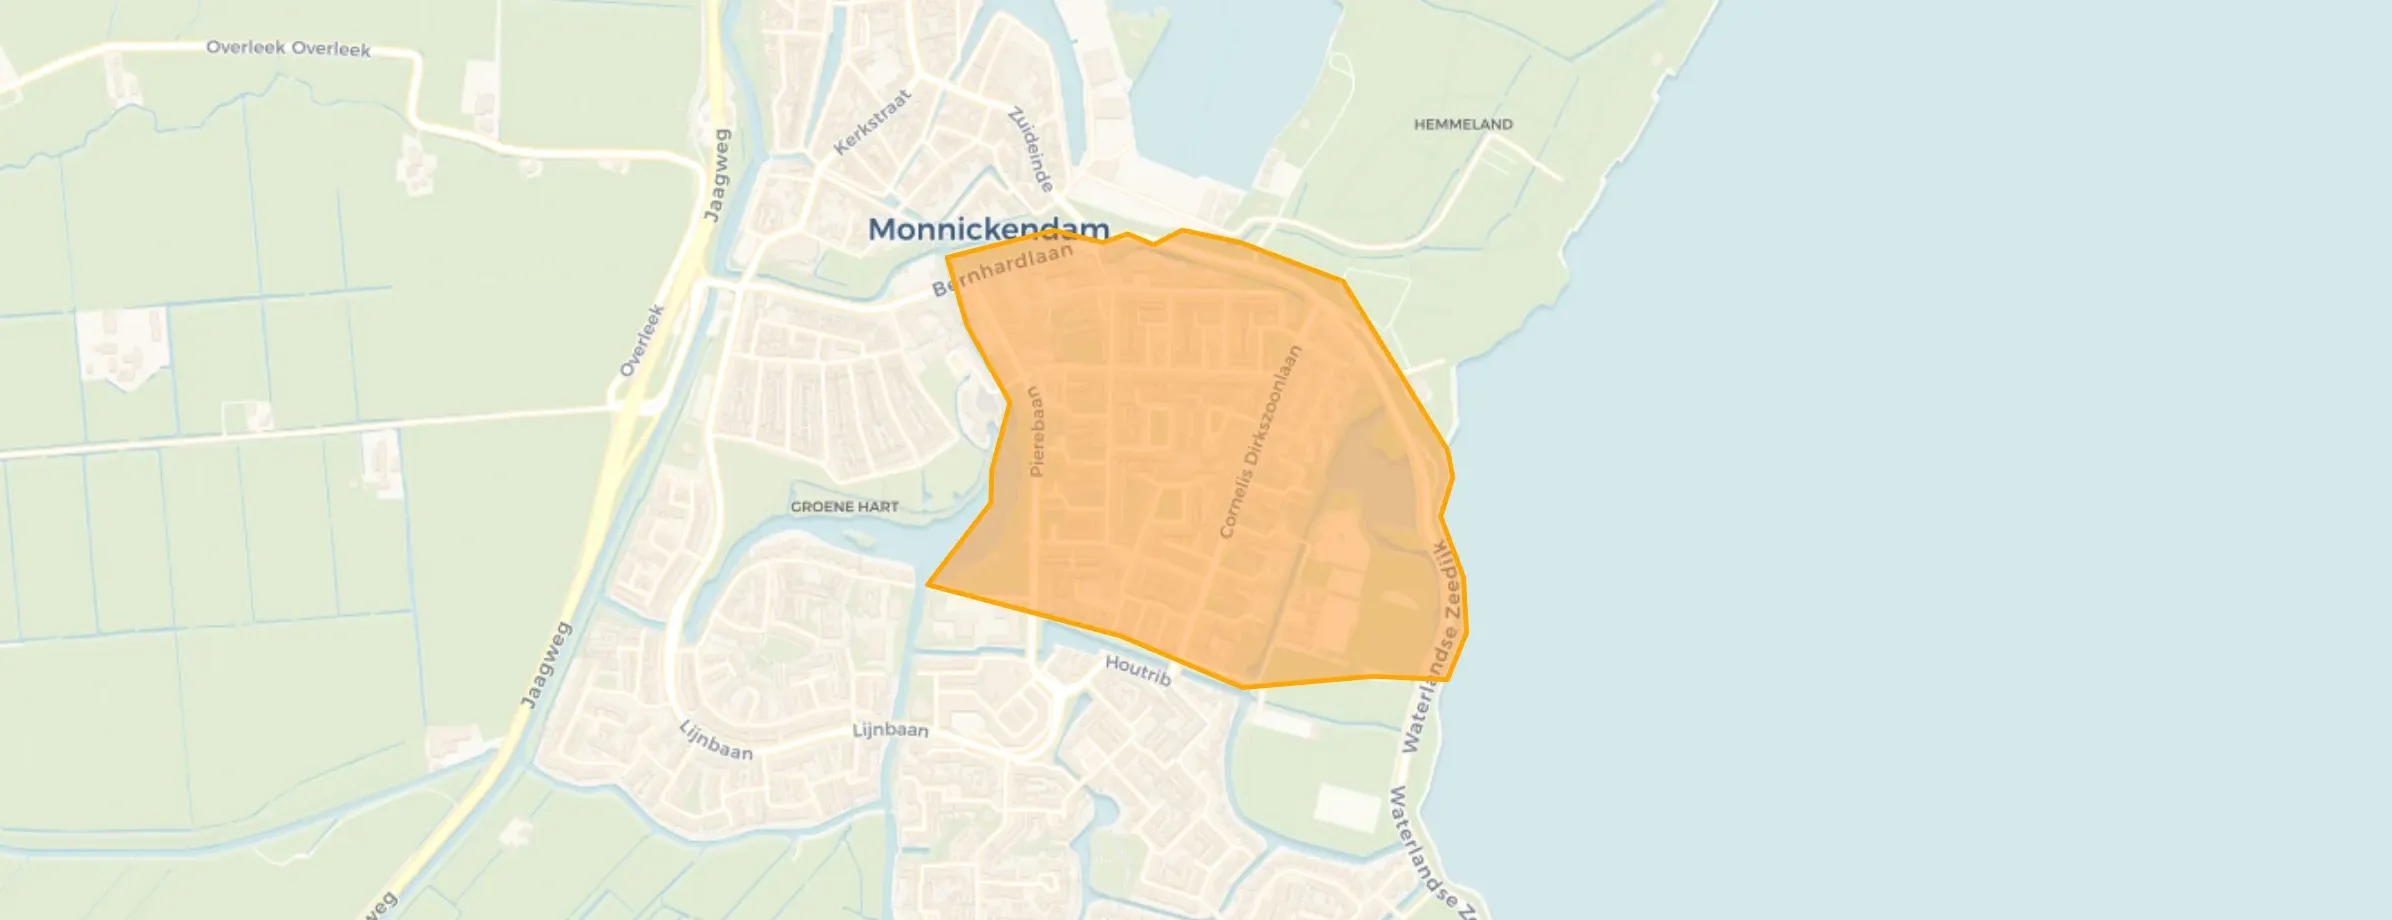
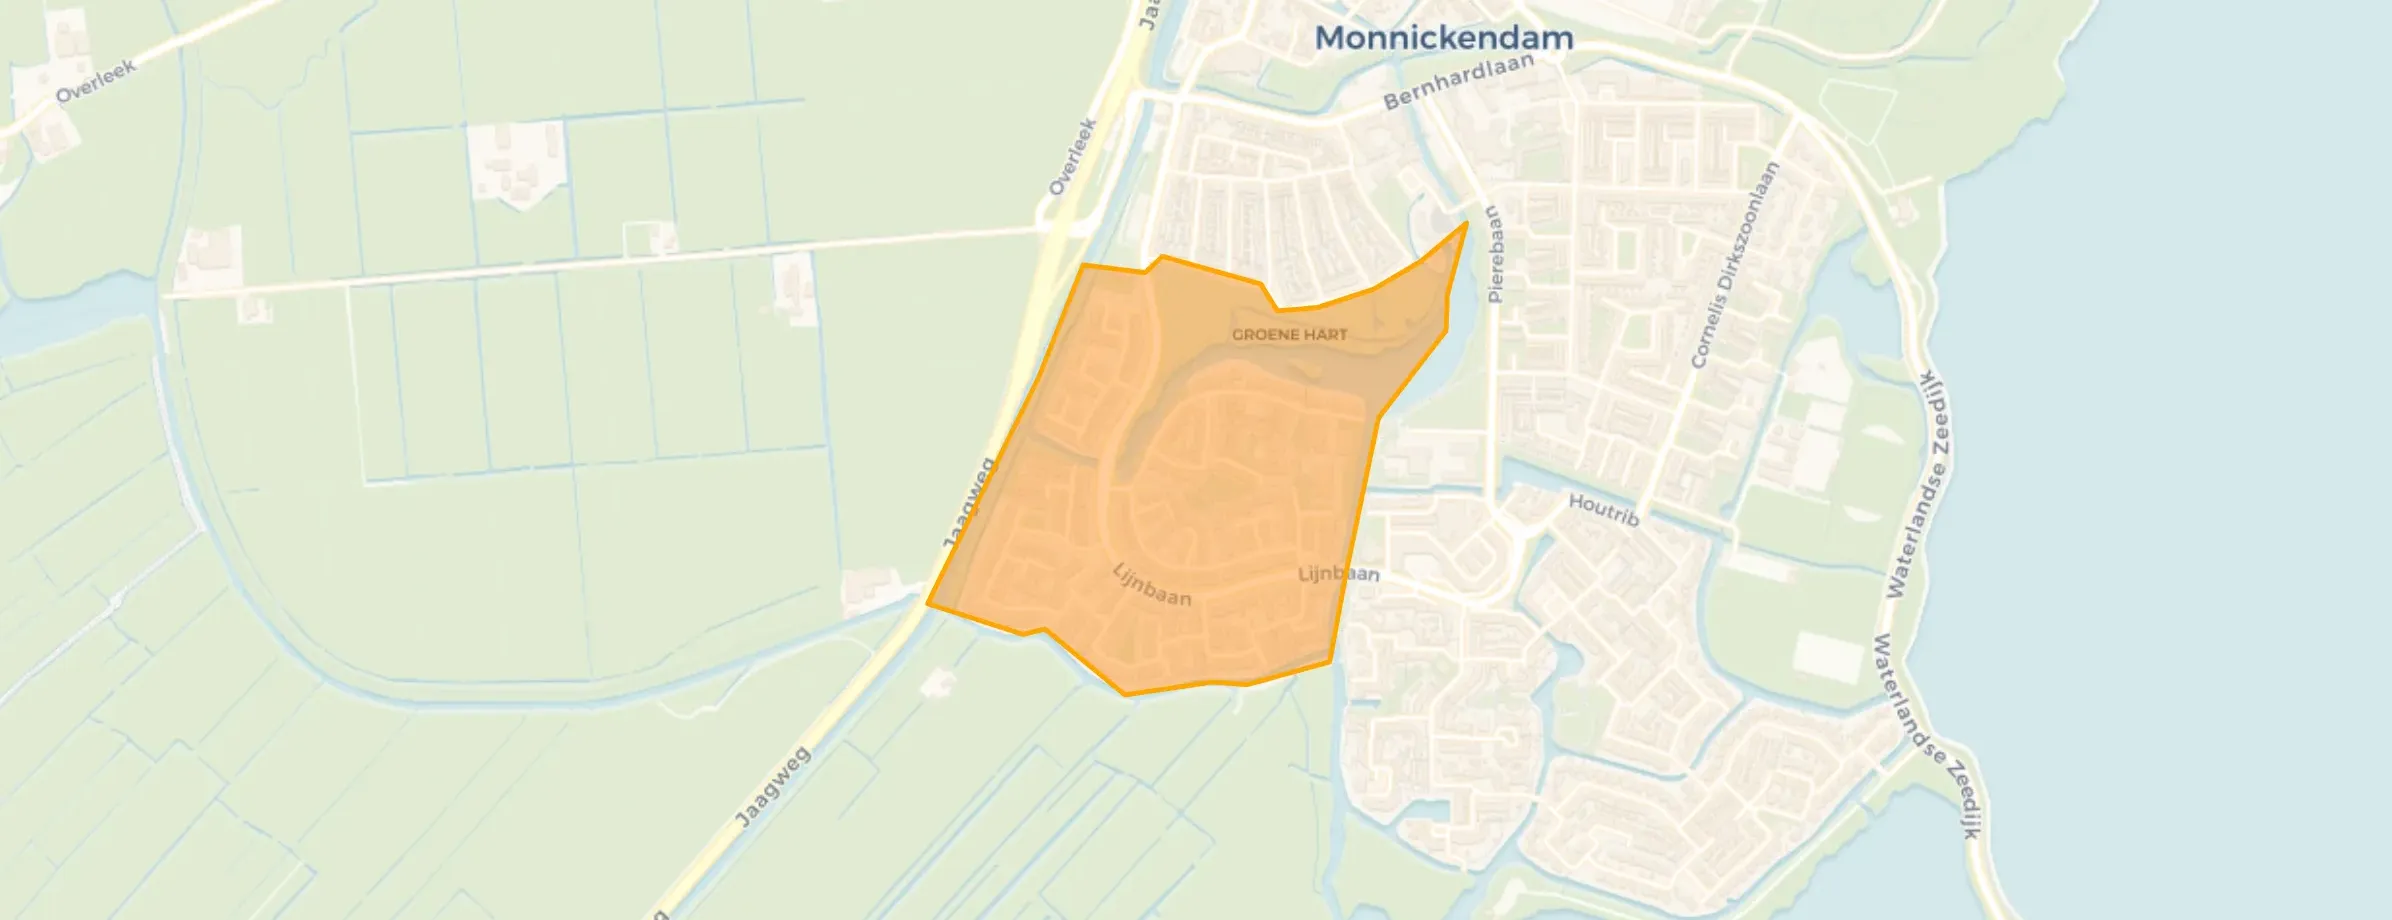
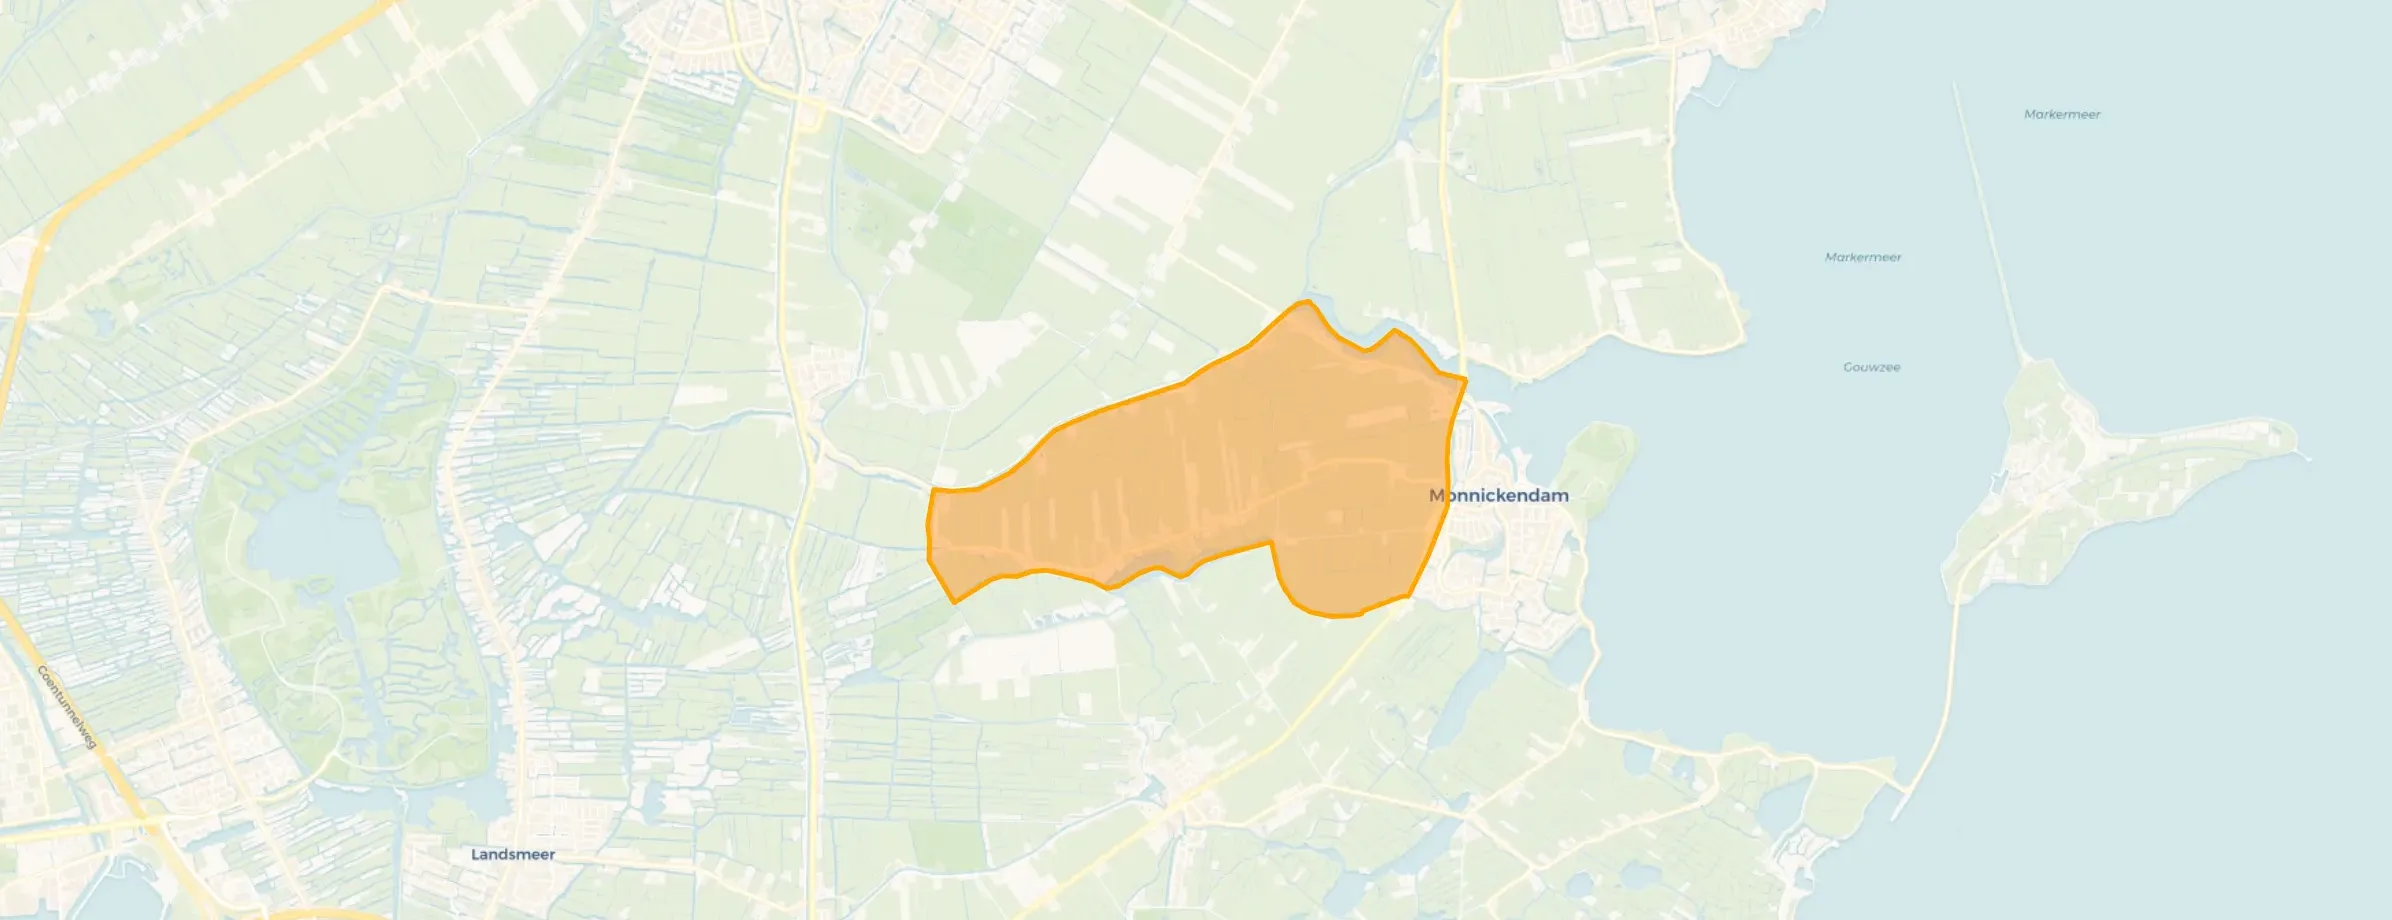
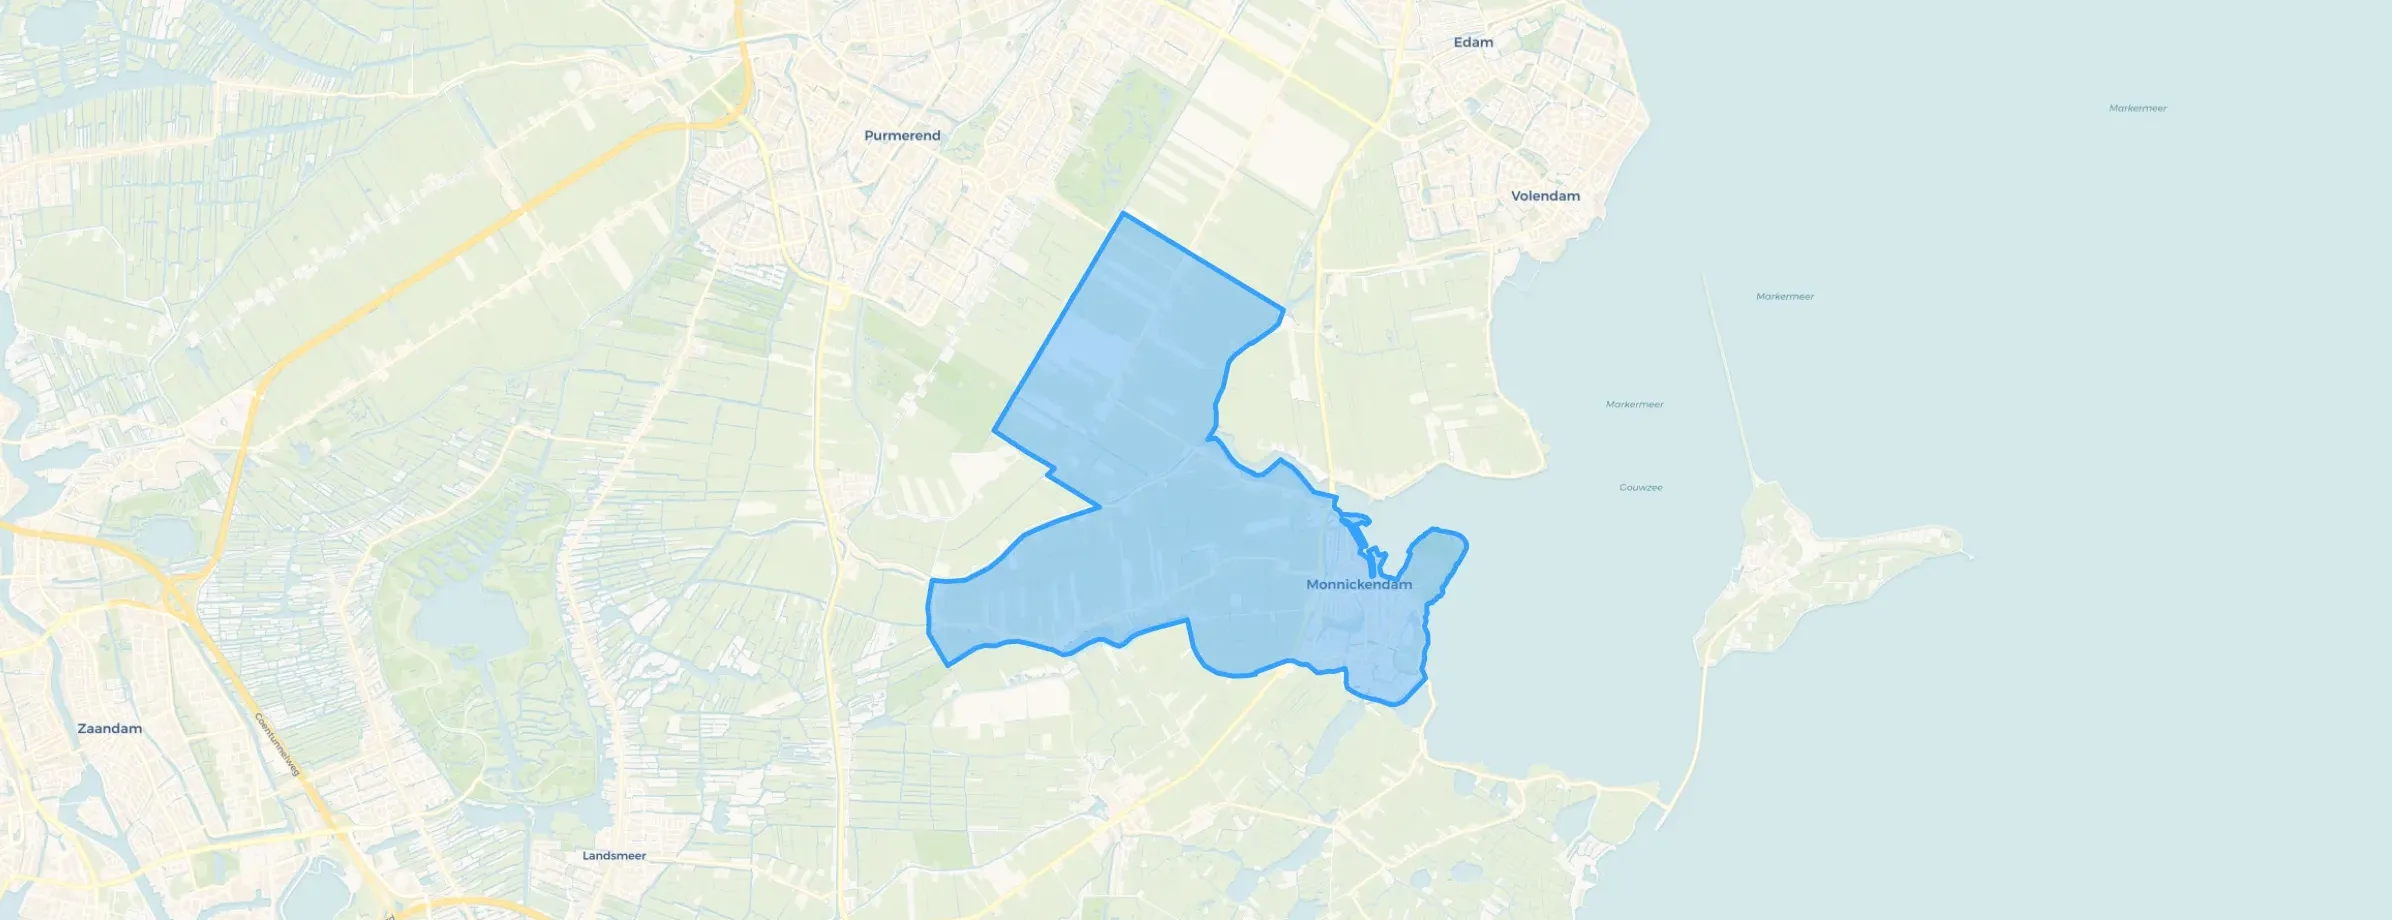
Monnickendam is located in the province of Noord-Holland, in the municipality of Waterland The district has a total area of 1.523 hectares, of which 1.463 hectares are land and 60 hectares are water. The district is coded as WK085200. The postcode area is 1141AA-1482AM.
Monnickendam has 9.960 residents. Of these, 48,4% are men and 51,6% are women. Most residents are 65 years or older (27,7%). The other age groups are 27,5% for '45 to 65 years', 19,9% for '25 to 45 years', 14,2% for '0 to 15 years' and 10,7% for '15 to 25 years'. Of the residents, 45,0% is unmarried, 41,9% is married, 6,8% is divorced and 6,3% is widowed. 7.965 residents originate from the Netherlands, 915 come from Europe and 1.080 come from countries outside Europe.
There are 4.510 households in Monnickendam. 34,1% of these are single-person households, 32,0% households without children and 33,8% households with children. The average household size is 2,2 persons. The national average is 2,1 persons.
In Monnickendam there are 8.100 income recipients. The average income per income recipient is €43.400, which is €1.200 (3%) higher than the national average of €42.200. Per resident, the average income is €36.000, which is €1.100 (3%) higher than the national average of €34.900. Most residents of Monnickendam are educated to an intermediate level. 35,6% have an intermediate education (HAVO, VWO or MBO 2-4), 34,7% have a university or higher professional education (HBO/WO) and 29,7% have a lower education (VMBO or MBO 1).
Of the 9.960 residents, around 70% are in paid employment, which amounts to 6.972 people. This is 2% lower than the national average of 72%. The majority of workers are in salaried employment (79%), while 21% are self-employed. In Monnickendam, 31% of residents receive a benefit. The largest group is those receiving a state pension (AOW). 2.510 people receive this benefit.
In Monnickendam there are 4.238 homes with an average assessed value (WOZ) of €430.000. Of these, around 96% are occupied and 4% unoccupied. Most homes are owner-occupied. This amounts to 34% rental homes and 66% owner-occupied homes. Of the homes, 66% privately owned, 29% owned by housing associations and 5% owned by other landlords. The most common construction periods in Monnickendam are 1950-1970 (27%) and 1970-1980 (23%).
There are currently no homes for sale in Monnickendam. The most recently listed home is Munnikplaat 17 by PROP3RTY. No homes were sold in Monnickendam over the past year.
There are currently no homes for rent in Monnickendam. The most recent home is Overleek 25DE-VOGELKOOI, offered by RELO Wonen Verhuurmakelaar & Vastgoedbeheer op Vastgoed Nederland. No homes were let in Monnickendam over the past year.
No recent rental data available for Monnickendam.
In Monnickendam there are 2.672 addresses with a registered energy label. The most common labels are A (34%), C (25%) and B (18%). On average, an address in Monnickendam uses 2.540 kWh of electricity per year. This is 0% below the national average of 2.550 kWh. Natural gas consumption, at 920 m³ per year, is 15% above the national average of 800 m³.
Neighbours, bus stop, supermarket, chemist & greengrocer are nearby & make me happy.
Auto-translated to English by AIDownside is often number 2 of dog near the pavement. Please clean up after yourself when walking your pet.
Auto-translated to English by AII have lived in 't Spil my whole life and experience the neighbourhood as pleasant and familiar; the atmosphere with the neighbours is good, for example, a neighbourhood day is organised which many neighbours attend, bringing the neighbourhood into more contact with each other. It is also very nice that the shopping centre is within walking distance and that everything I need is nearby. The area is fairly well maintained with a vegetable garden. Sometimes there is litter on the street, but the municipality ensures it is removed as quickly as possible. The only thing that could be better is that people throw less rubbish on the street, so the municipality has time for more important things.
Auto-translated to English by AINorth Holland district social through and through. Direct neighbours get along well, others greet too.
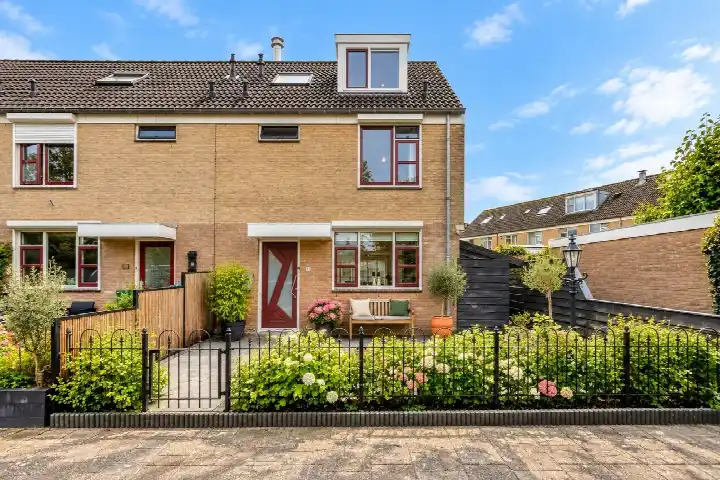
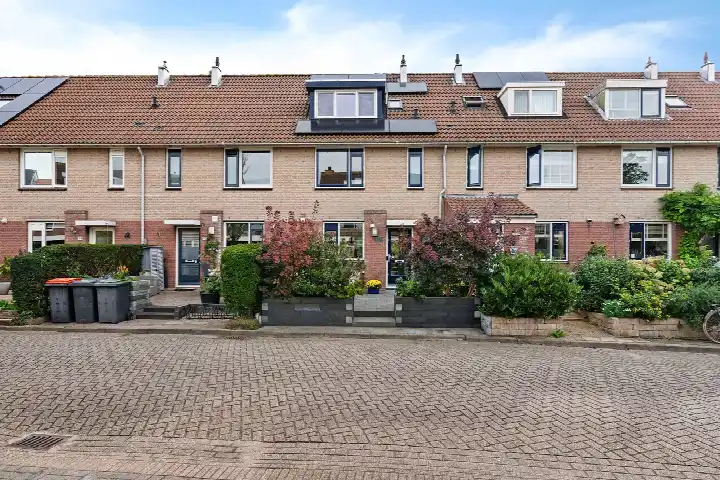
Auto-translated to English by AIThe housing stock is mainly post-war — 60% was built between 1945 and 1990. In addition, the most common type is terraced houses (44%).
Over the past year a home for sale in Monnickendam was listed for an average of €587,056 (€5,299 per m²). That is 11% above the Dutch national average. Last quarter prices fell by 13%.
A rental home in Monnickendam cost an average of €1,952 per month (€19 per m²). That is 10% below the national average.
Residents give Monnickendam a 7.4 out of 10 based on 4 reviews. Especially amenities (8.0) scores well; cleanliness (6.3) receives the lowest rating.
The housing supply in Monnickendam is remarkably efficient: 57% has an A, A+ or B label. The average natural gas consumption per household is 920 m³ per year.
From Monnickendam you can on average reach a supermarket at 0.8 km, a GP at 0.9 km, a railway station at 10.6 km, a primary school at 0.7 km (as the crow flies, source: CBS).
Right now you will find 47 homes for sale and 5 homes for rent in Monnickendam. A home for sale here is listed for an average of 77 days — relatively long for the current market.