District in Dordrecht
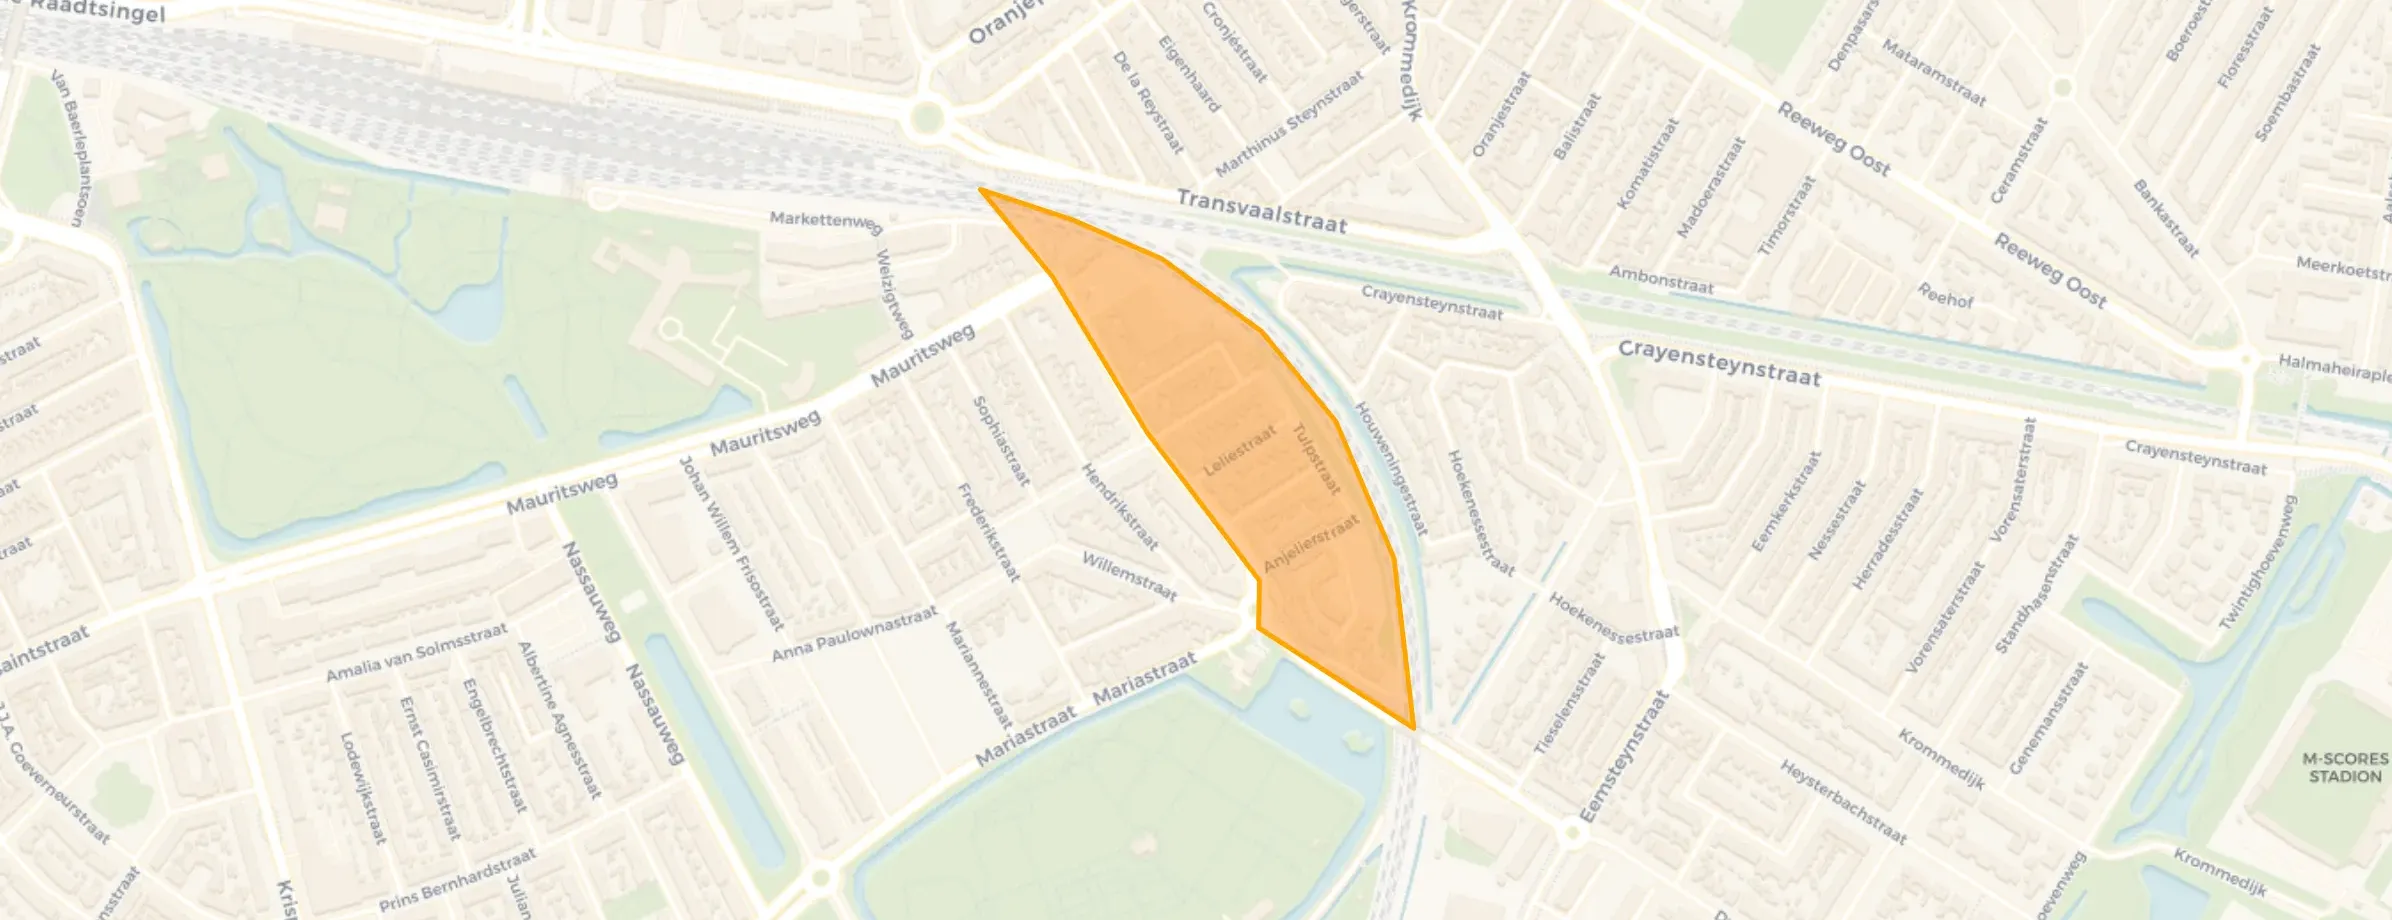
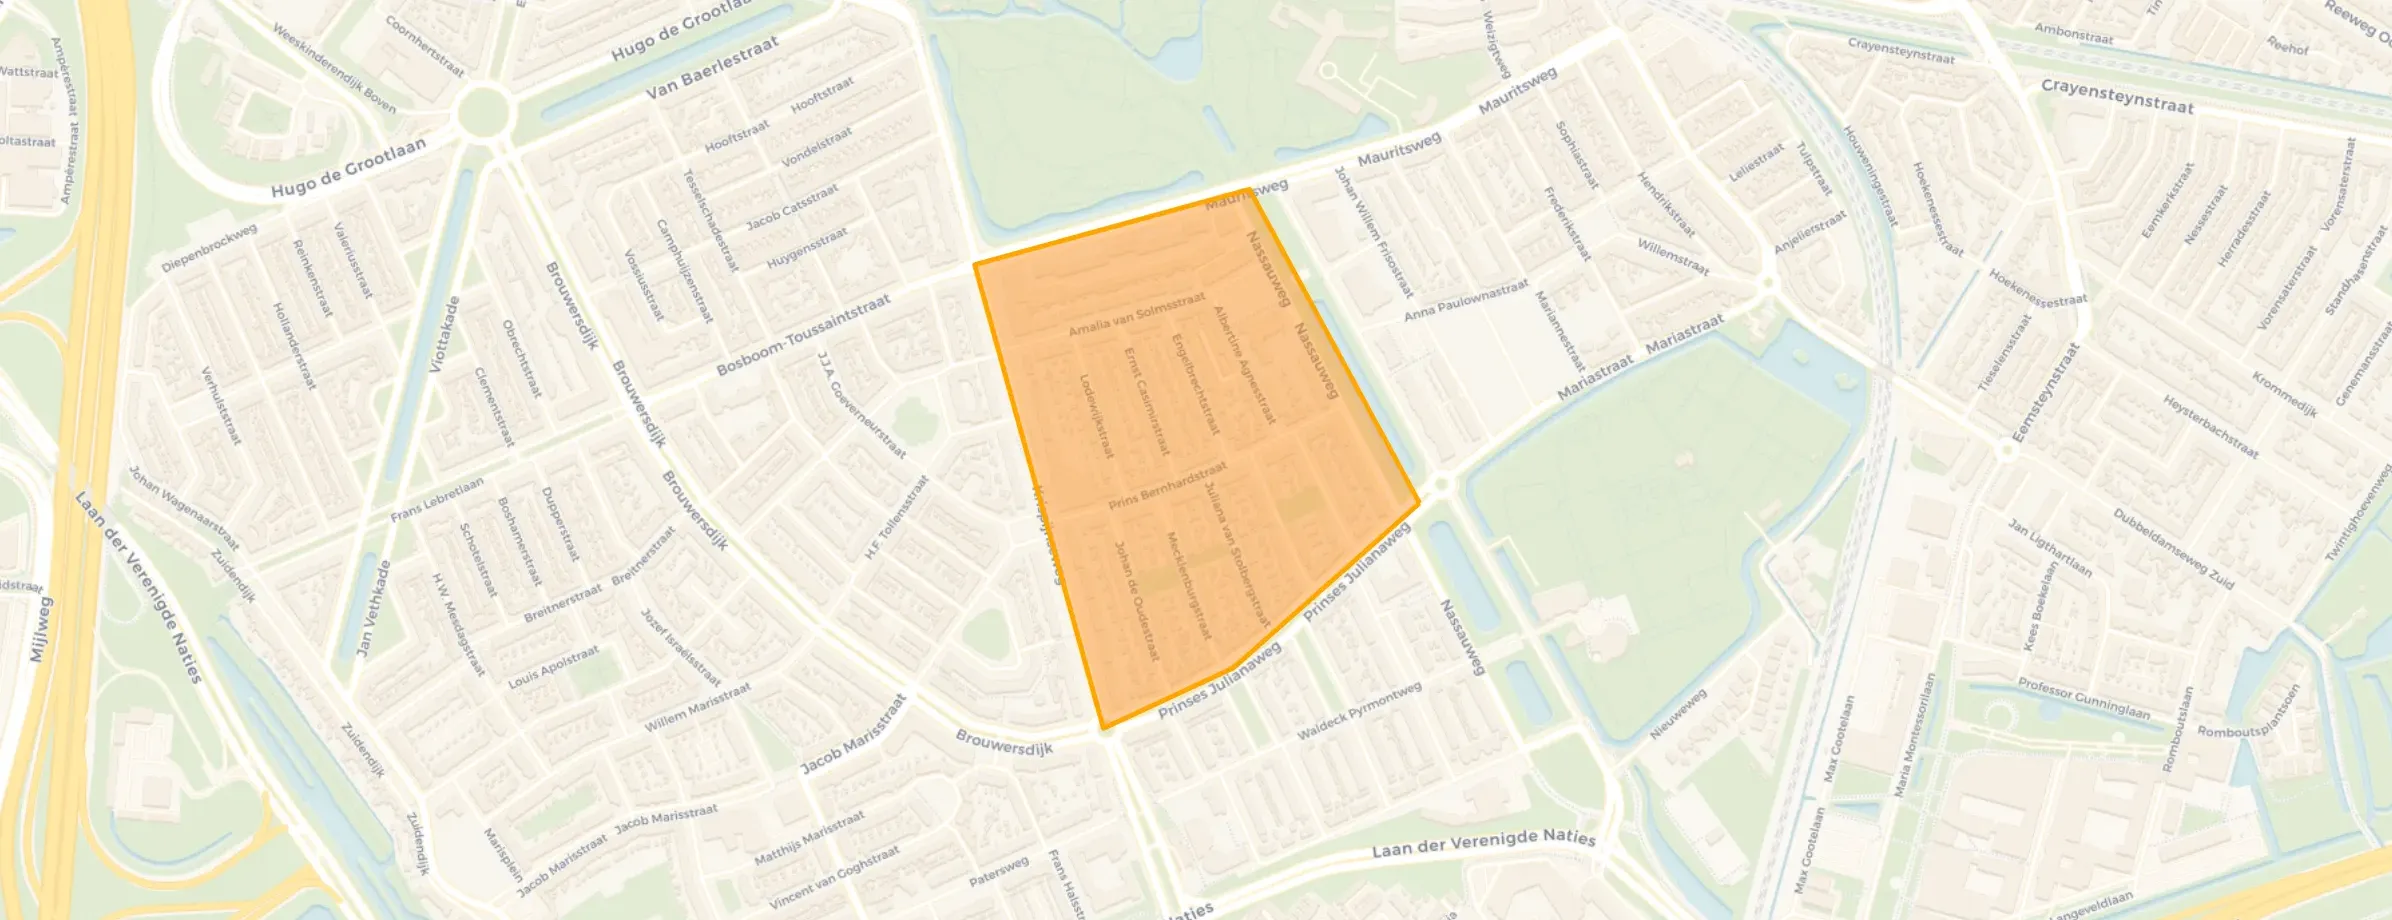
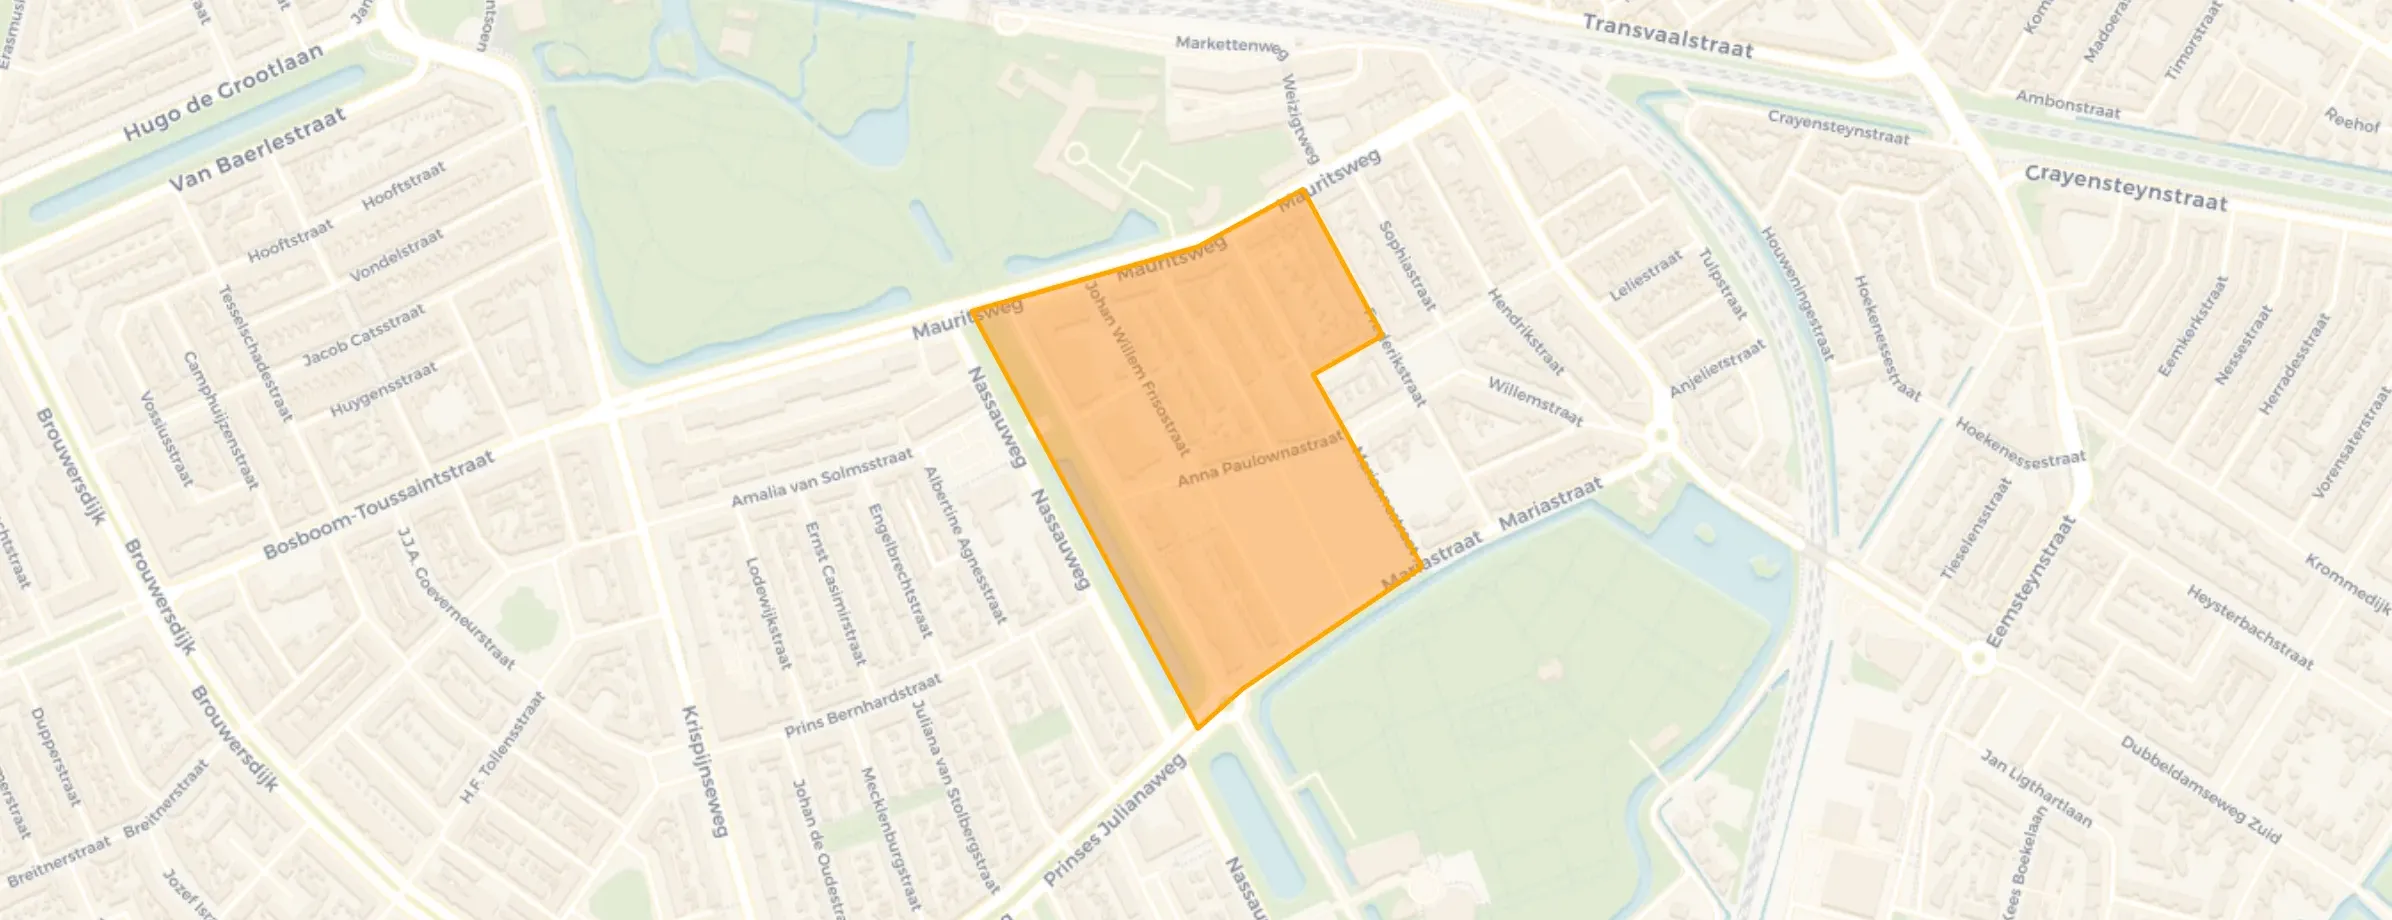
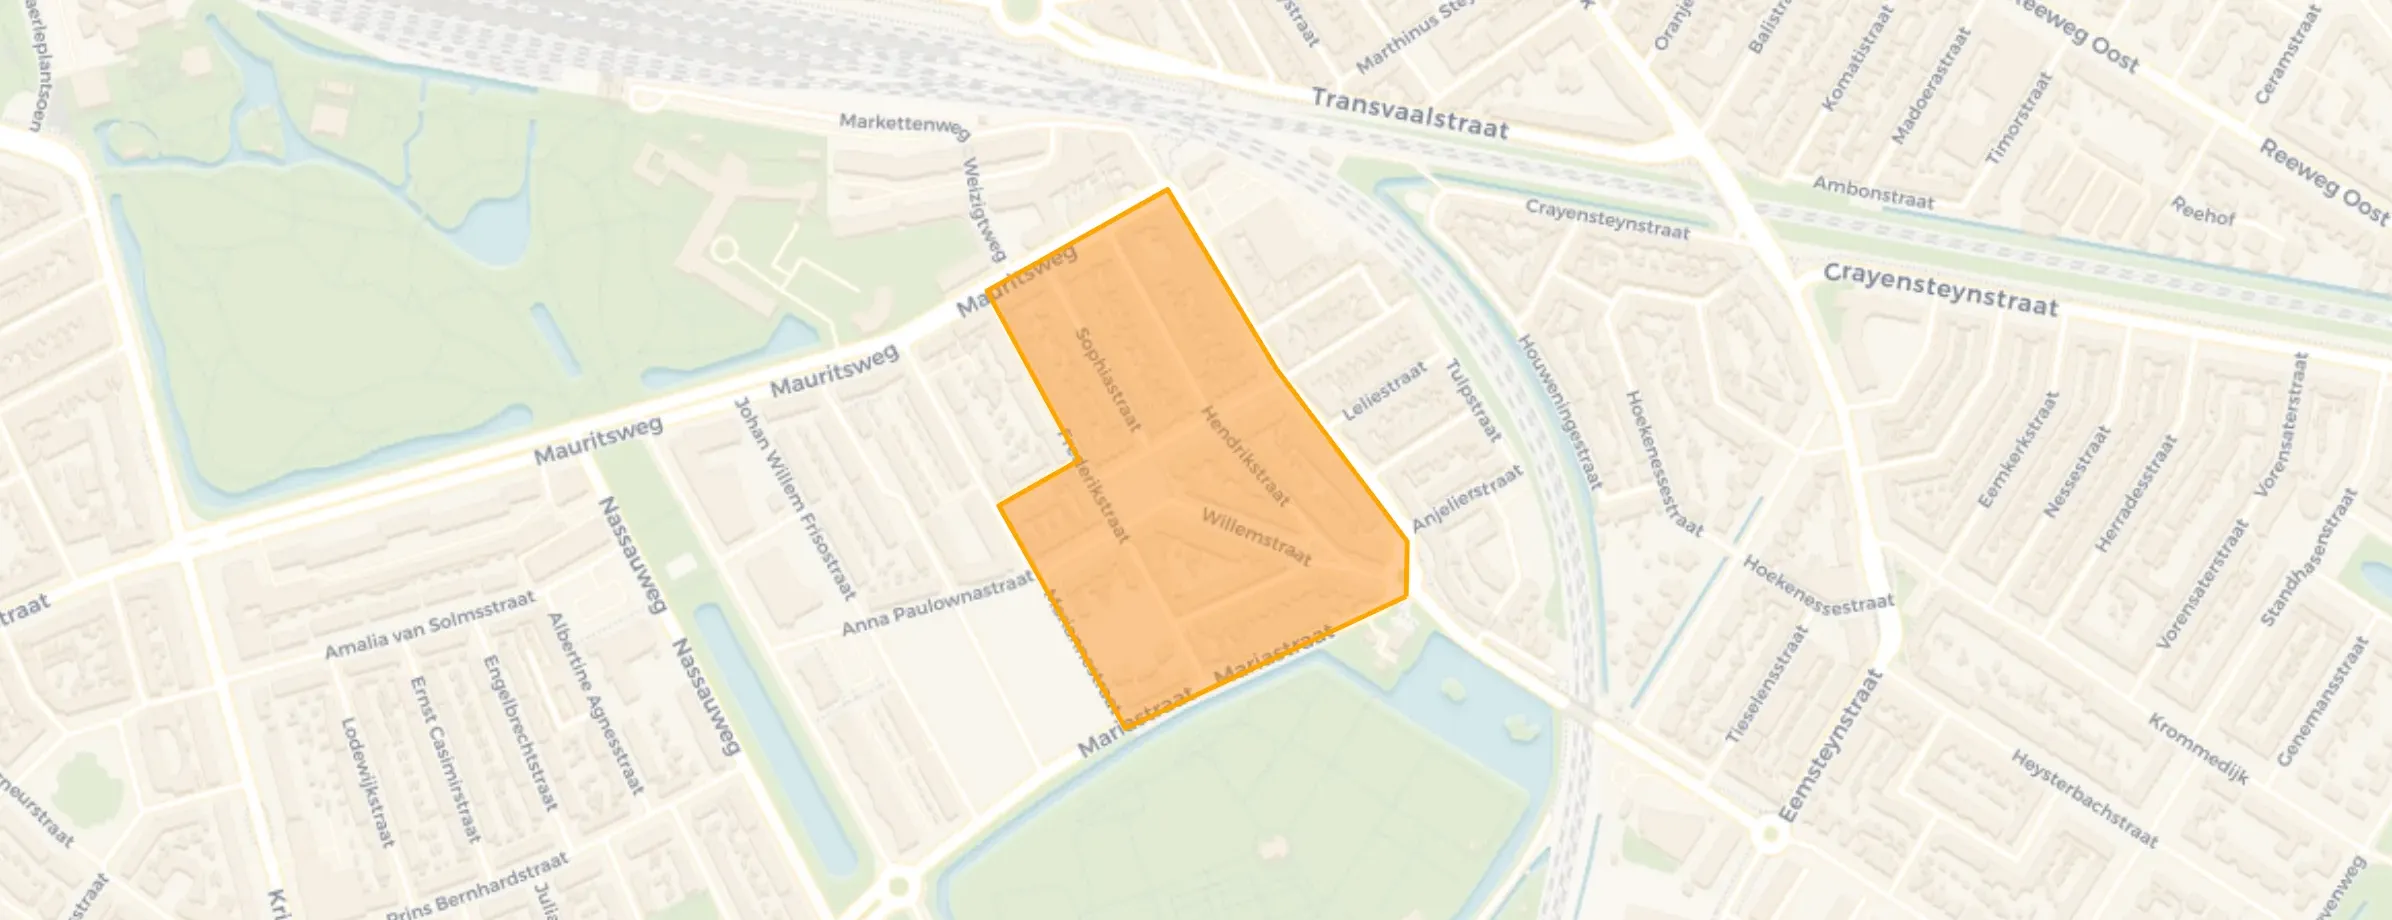
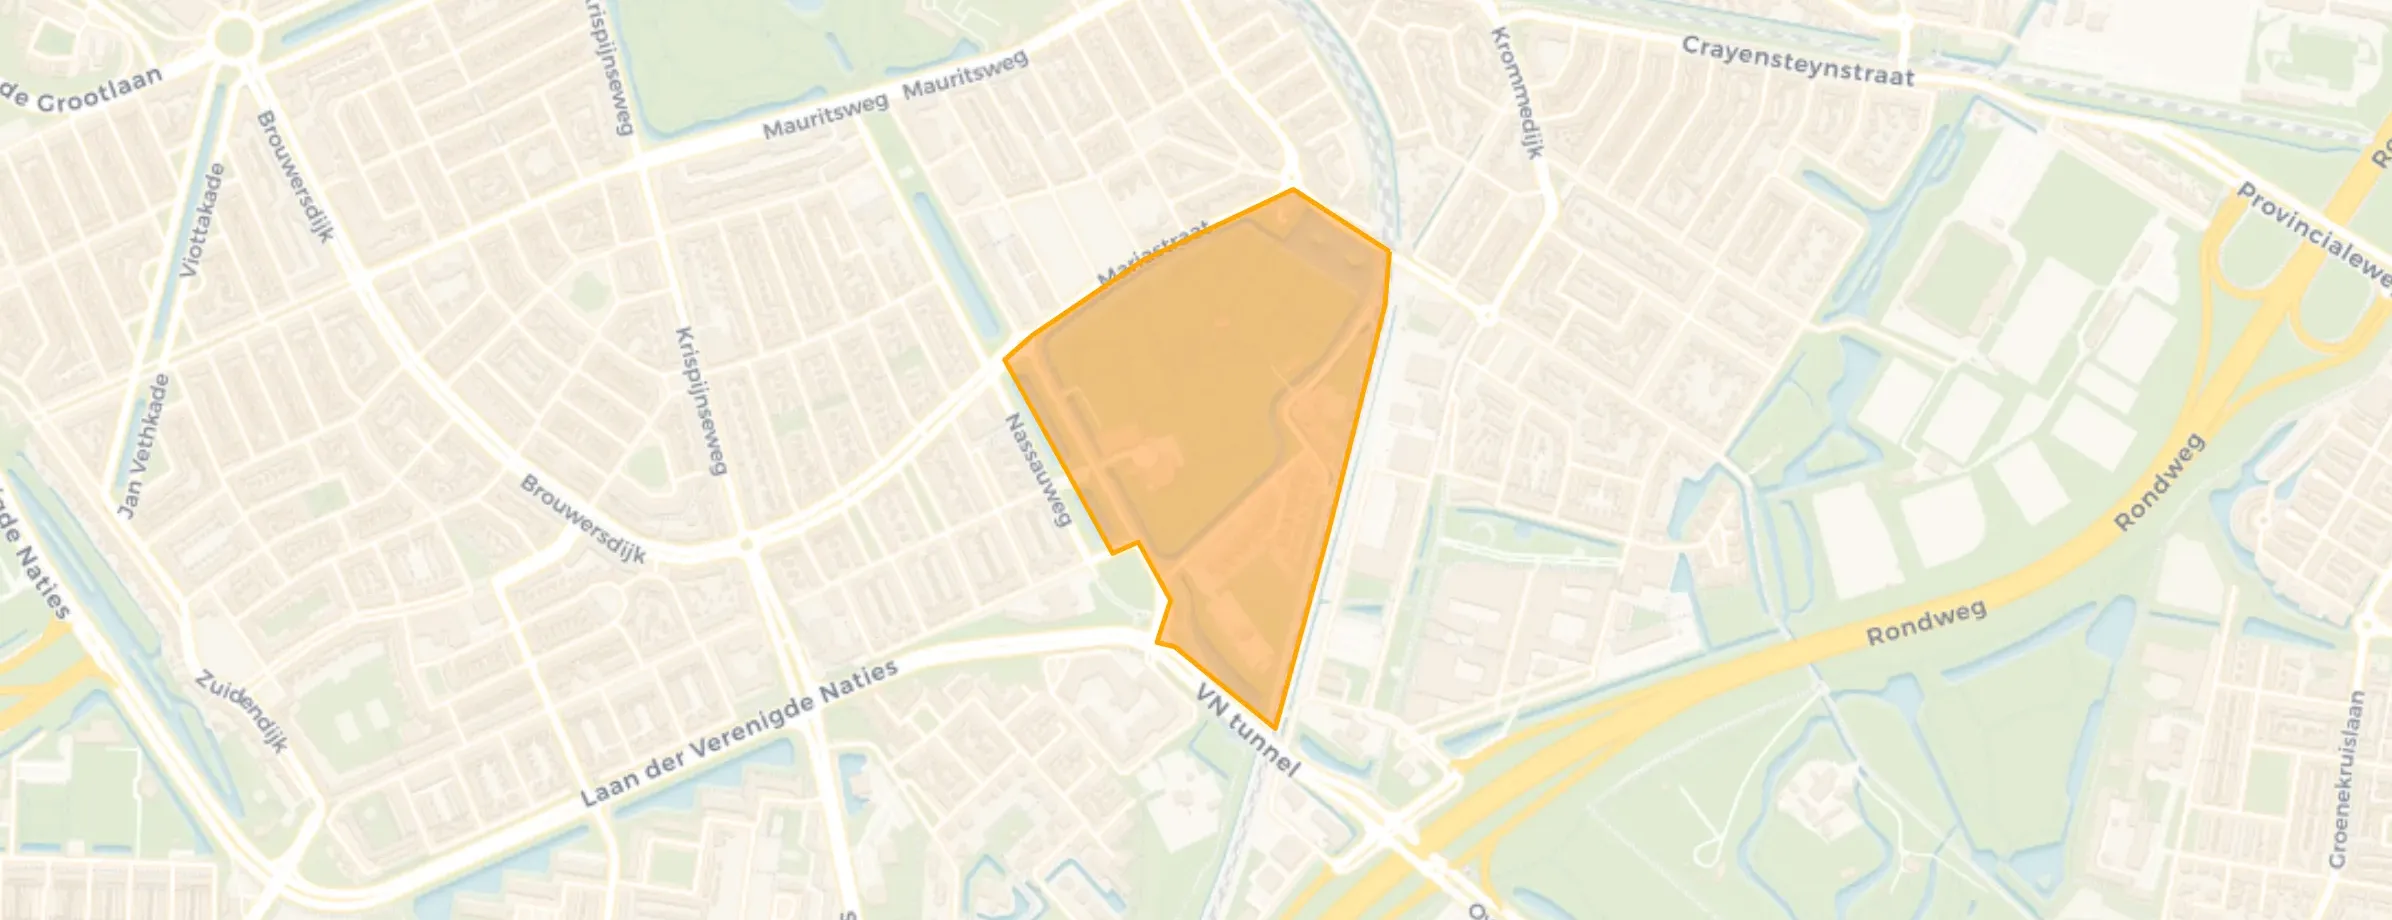
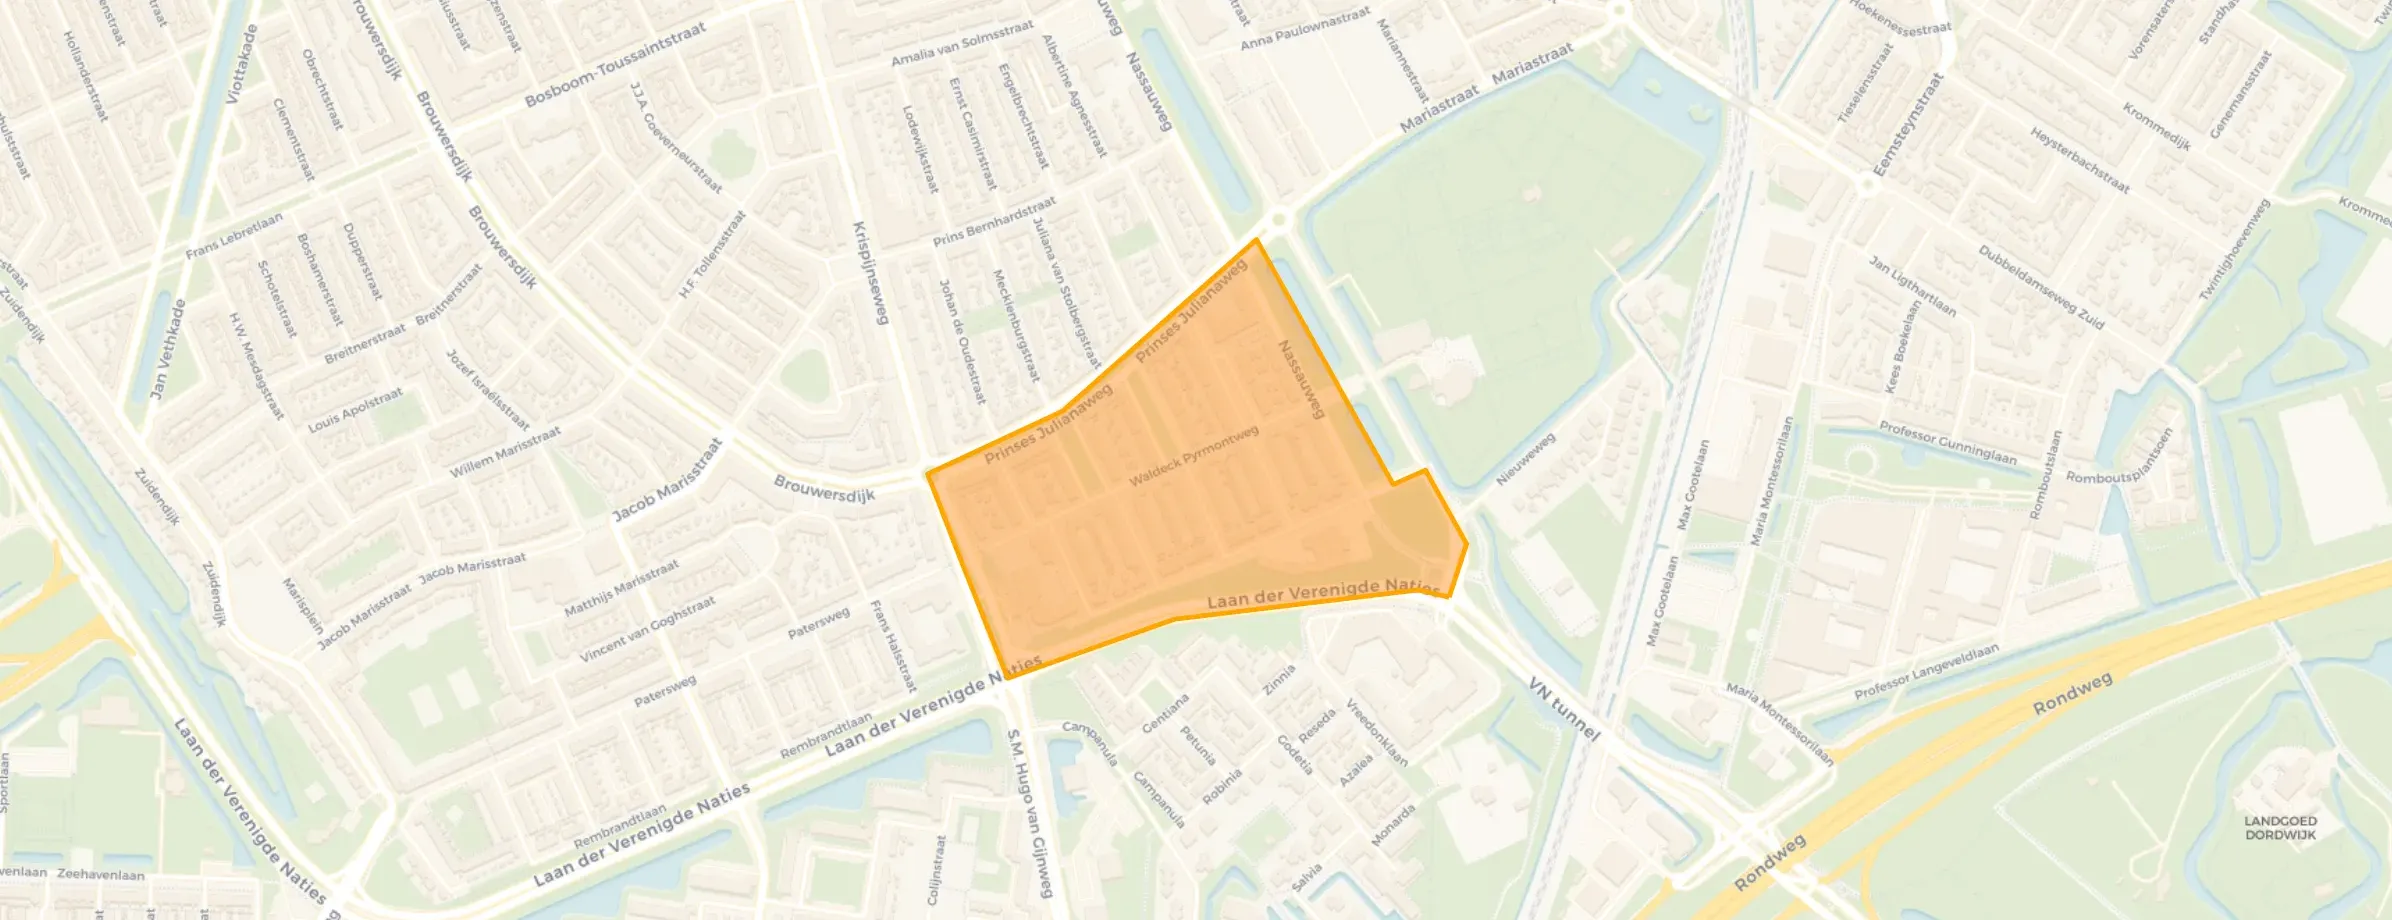
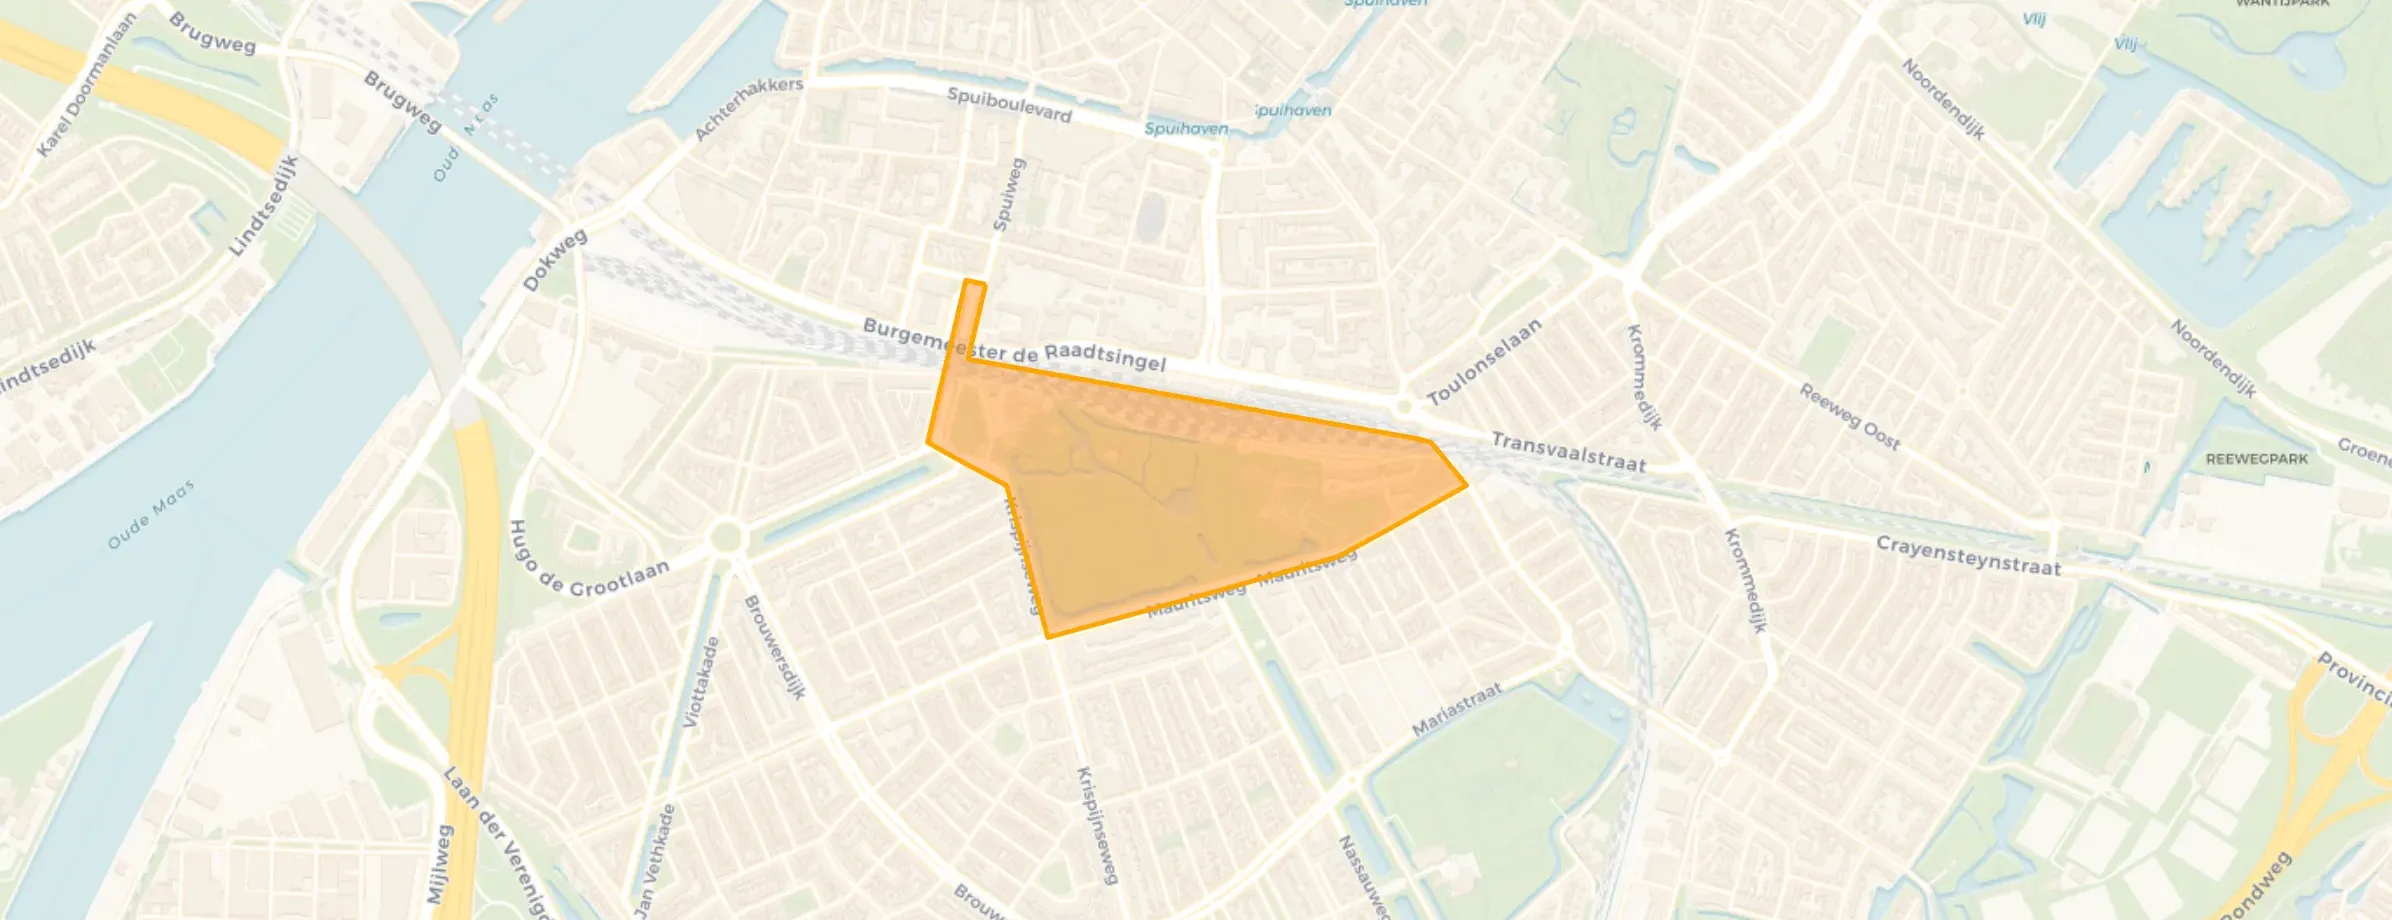
Nieuw-krispijn is located in the province of Zuid-Holland, in the municipality of Dordrecht The district has a total area of 97 hectares, of which 95 hectares are land and 2 hectares are water. The district is coded as WK050504. The postcode area is 3314BH-3314ZZ.
Nieuw-krispijn has 4.915 residents. Of these, 47,8% are men and 52,2% are women. Most residents are 25 to 45 years (29,4%). The other age groups are 24,4% for '45 to 65 years', 19,4% for '65 years or older', 15,1% for '0 to 15 years' and 11,8% for '15 to 25 years'. Of the residents, 53,2% is unmarried, 31,4% is married, 9,9% is divorced and 5,4% is widowed. 2.570 residents originate from the Netherlands, 580 come from Europe and 1.765 come from countries outside Europe.
There are 2.425 households in Nieuw-krispijn. 46,2% of these are single-person households, 23,9% households without children and 29,9% households with children. The average household size is 2,0 persons.
In Nieuw-krispijn there are 3.900 income recipients. The average income per income recipient is €30.200, which is €5.600 (16%) lower than the national average of €35.800. Per resident, the average income is €24.600, which is €4.600 (16%) lower than the national average of €29.200. Most residents of Nieuw-krispijn are educated to an intermediate level. 43,2% have an intermediate education (HAVO, VWO or MBO 2-4), 35,9% have a lower education (VMBO or MBO 1) and 20,9% have a university or higher professional education (HBO/WO).
Of the 4.915 residents, around 57% are in paid employment, which amounts to 2.802 people. This is 8% lower than the national average of 65%. The majority of workers are in salaried employment (87%), while 13% are self-employed. In Nieuw-krispijn, 30% of residents receive a benefit. The largest group is those receiving a state pension (AOW). 860 people receive this benefit.
In Nieuw-krispijn there are 2.652 homes with an average assessed value (WOZ) of €219.000. Of these, around 92% are occupied and 8% unoccupied. Most homes are rental properties. This amounts to 63% rental homes and 37% owner-occupied homes. Of the homes, 37% privately owned, 45% owned by housing associations and 18% owned by other landlords. The most common construction periods in Nieuw-krispijn are 1950-1970 (36%) and 1900-1925 (18%).
There are currently no homes for sale in Nieuw-krispijn. The most recently listed home is Anna van Burenstraat 6 by Home 4 You Makelaars. No homes were sold in Nieuw-krispijn over the past year.
There are currently no homes for rent in Nieuw-krispijn. The most recent home is Leliestraat 29, offered by Huurkracht. No homes were let in Nieuw-krispijn over the past year.
No recent rental data available for Nieuw-krispijn.
In Nieuw-krispijn there are 2.697 addresses with a registered energy label. The most common labels are C (18%), B (17%) and D (16%). On average, an address in Nieuw-krispijn uses 2.170 kWh of electricity per year. This is 23% below the national average of 2.810 kWh. With an annual consumption of 830 m³ per address, natural gas consumption is 35% below the national average of 1.280 m³.
My neighbourhood is often dismissed by outsiders as a deprived area. That word alone conjures up images of problems, statistics and stigma. But those who actually live here know that the story is much more layered than that. The flats and terraced houses are not new, sometimes even a bit worn. Stairwells bear the marks of years of use and in some places maintenance leaves something to be desired. Yet people live here who do their best every day to make something of it. Families who have lived on the same street for generations, young people playing football on the square until it gets dark, and elderly people watching everything from their balcony, missing nothing. You hear multiple languages mixed together here. Not because people live alongside each other, but because the neighbourhood is a mix of cultures, backgrounds and stories. Sometimes it clashes, sometimes it rubs, but often a form of togetherness emerges that you see less in 'nicer' neighbourhoods. Everyone knows who lives on the street, who needs help and who you'd better avoid. There are problems too. That cannot be denied. Unemployment, money worries and occasional nuisance are part of daily life. Police and enforcement patrol the area more often than in other neighbourhoods. But that doesn't mean there are no norms or values here. Calling each other out on behaviour doesn't always happen by the book.
Auto-translated to English by AII've been living in this neighbourhood with pleasure for 19 years. Over the years, most feel like family. The nice thing is that we help each other when someone is renovating. If you need something, you can always ask each other. And if you've forgotten some groceries, there's always someone who has them. And if the door is open, you don't have to ring, you just walk in. Everyone looks out for each other here. And we're close to the park and the train and bus. In 15 minutes' walk you're in the city centre.
Auto-translated to English by AI
The housing stock is predominantly pre-war — 51% of the homes date from before 1945. In addition, the most common type is flats (57%).
Over the past year a home for sale in Nieuw-krispijn was listed for an average of €302,593 (€3,693 per m²).
A considerable share of the supply in Nieuw-krispijn is less efficient: 49% has an E, F or G label. The average natural gas consumption per household is 830 m³ per year.
From Nieuw-krispijn you can on average reach a supermarket at 0.4 km, a GP at 0.6 km, a railway station at 1.8 km, a primary school at 0.4 km (as the crow flies, source: CBS).
Right now you will find 18 homes for sale and 3 homes for rent in Nieuw-krispijn.

Buurtje.nl uses cookies to make the site work and to improve it. In doing so, we process data such as your IP address and the pages you visit.
We use this data for three purposes: running the website (functional), measuring visits so we can improve Buurtje.nl (analytics), and — if you allow it — tailoring ads to your interests (marketing).
How we handle your data is described in our privacy policy. You can change your preferences at any time via 'Cookie preferences' at the bottom of every page.
Choose per category which cookies we may place. Read more in our privacy policy.