District in Leeuwarden
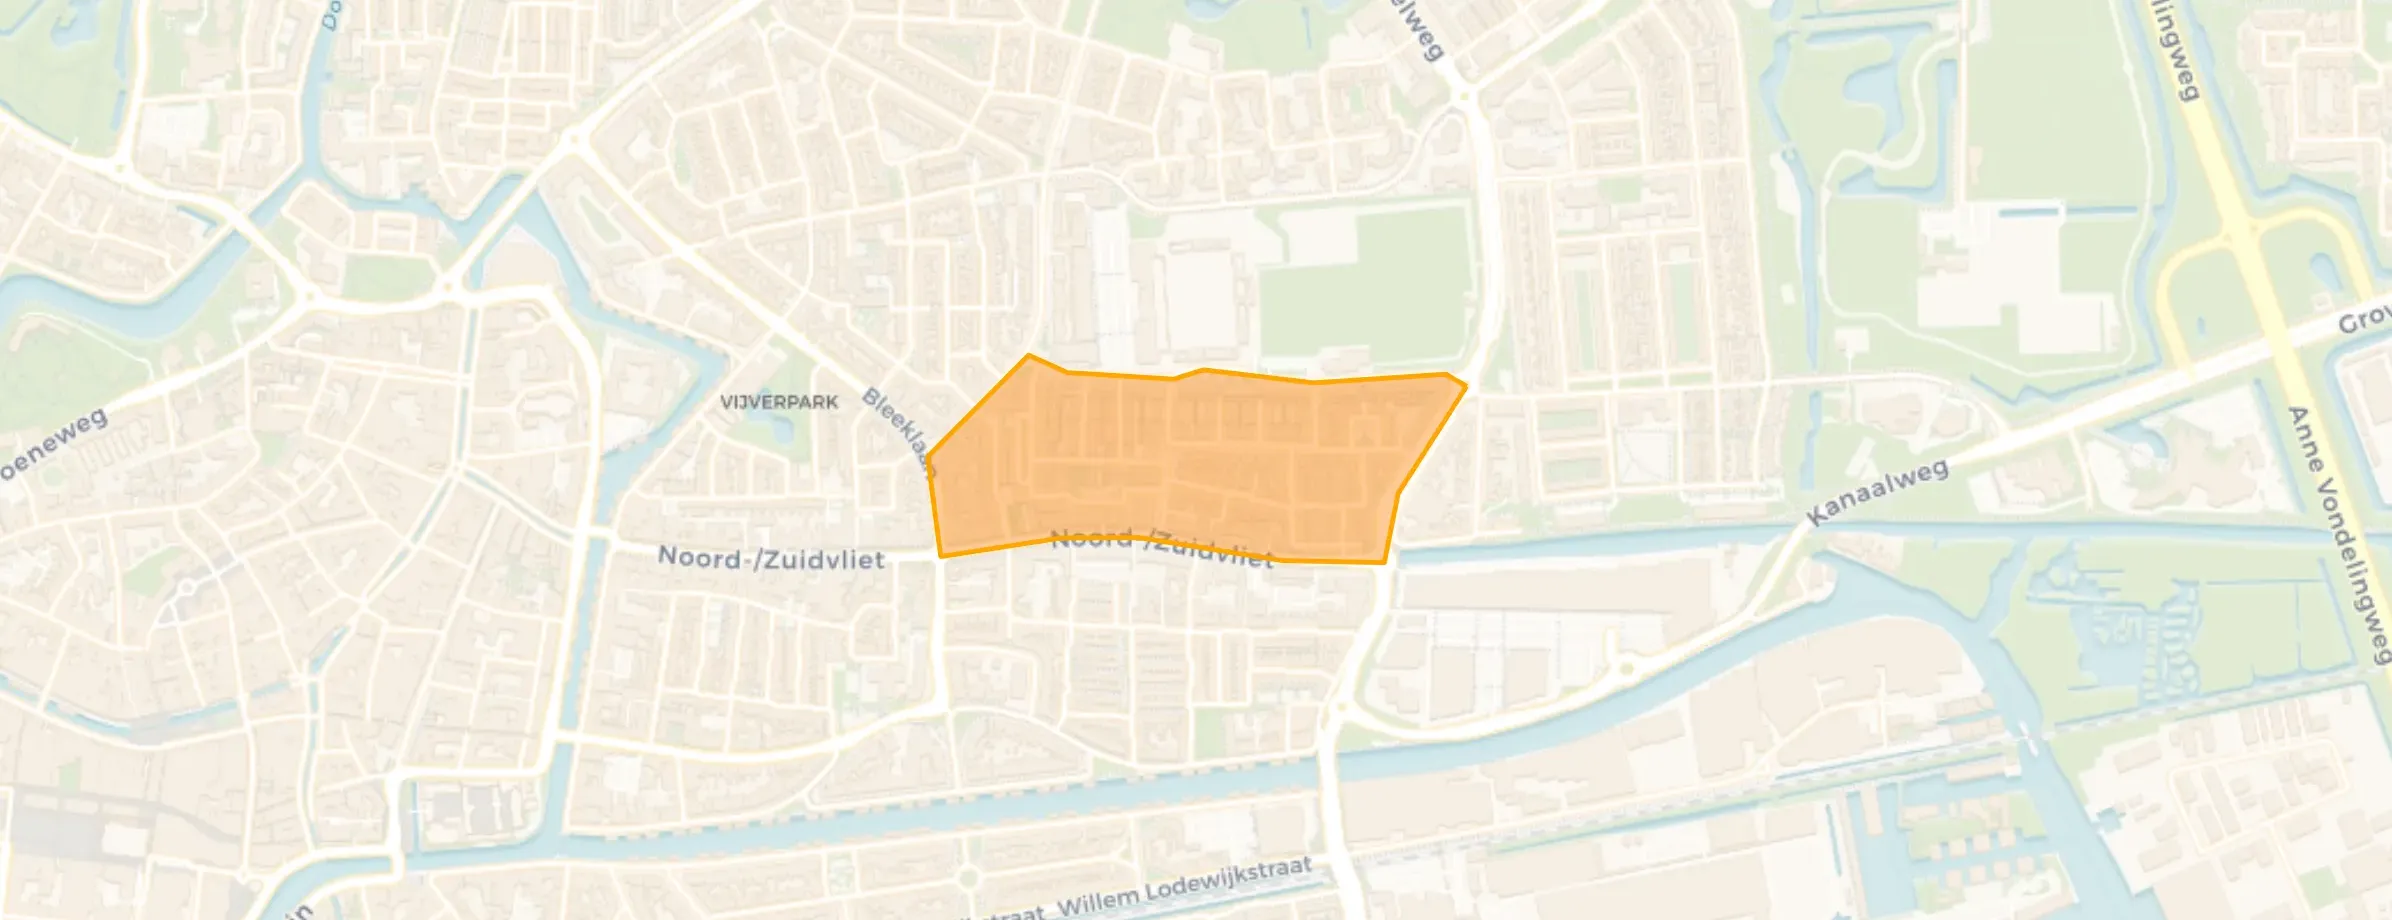
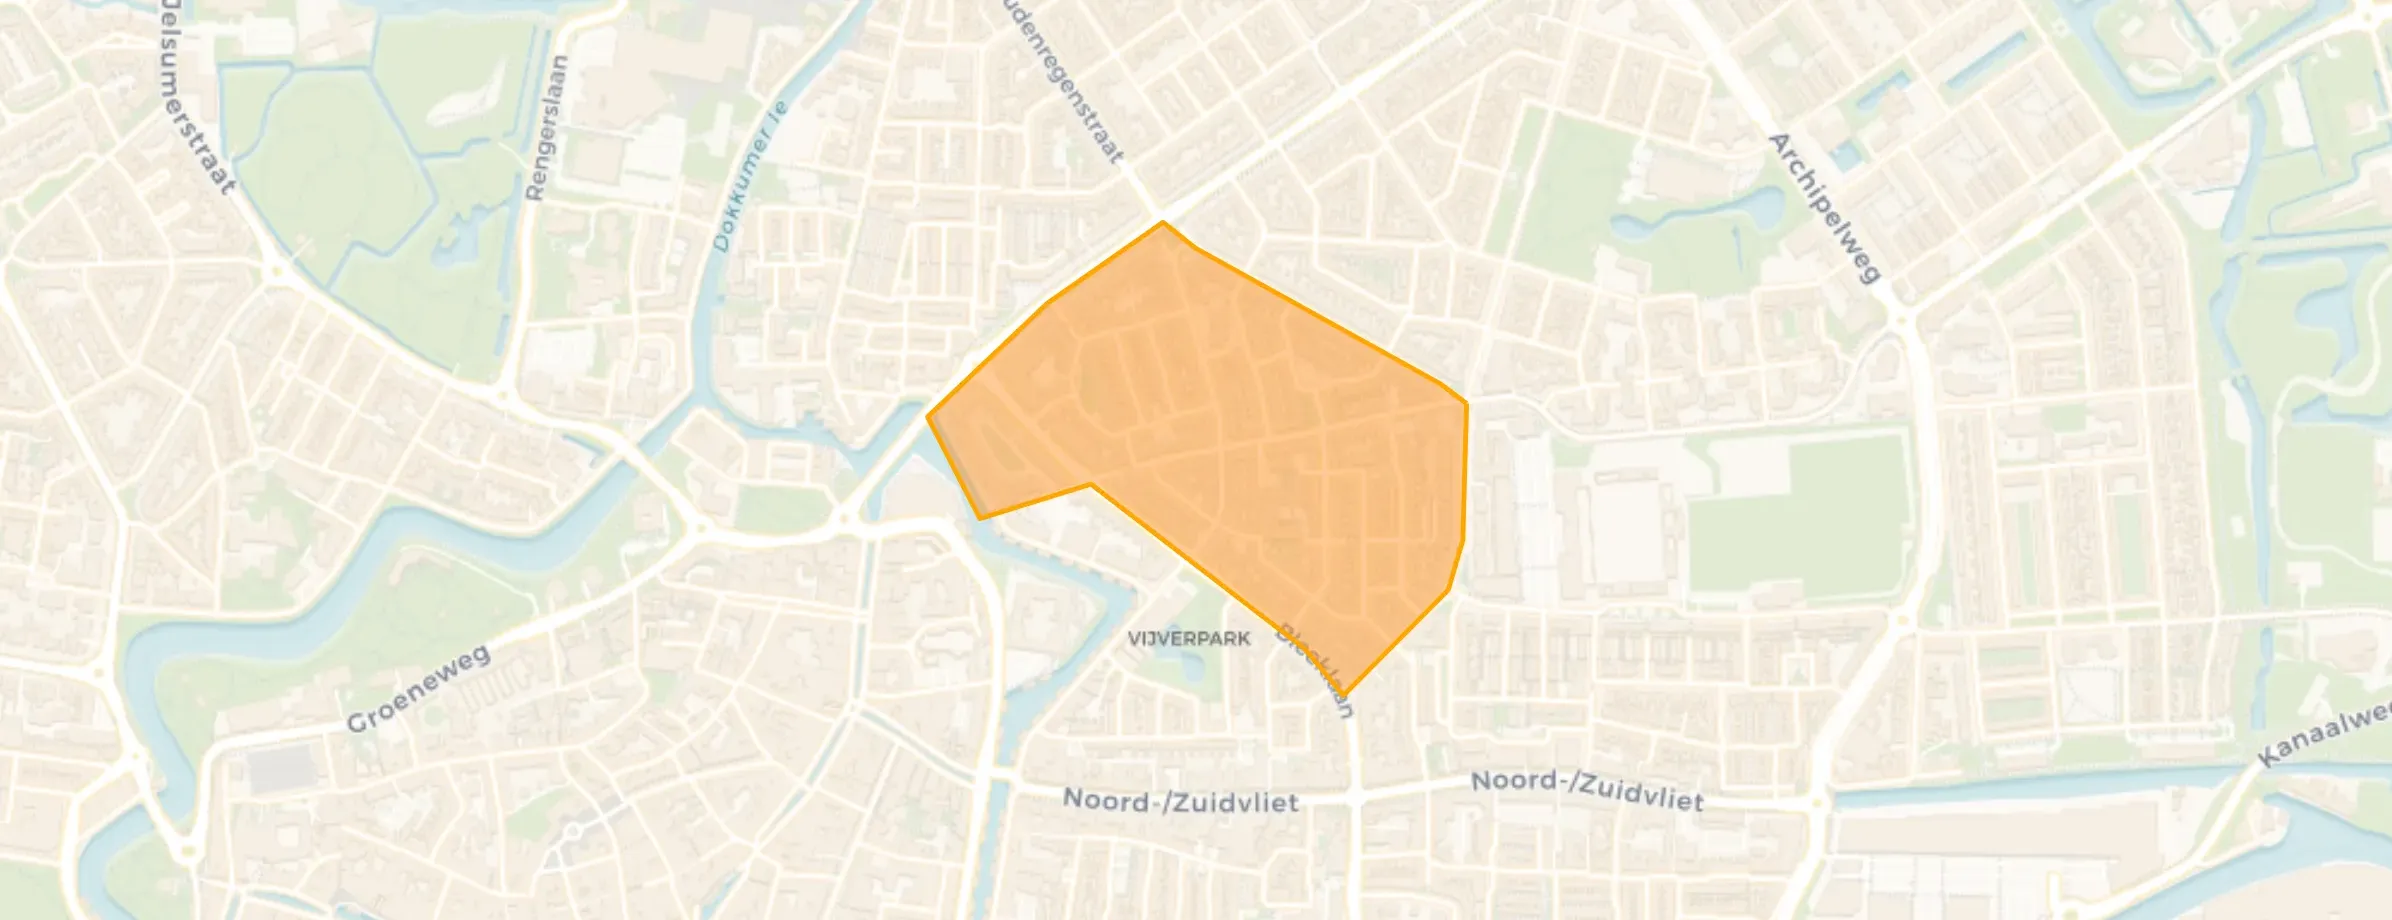
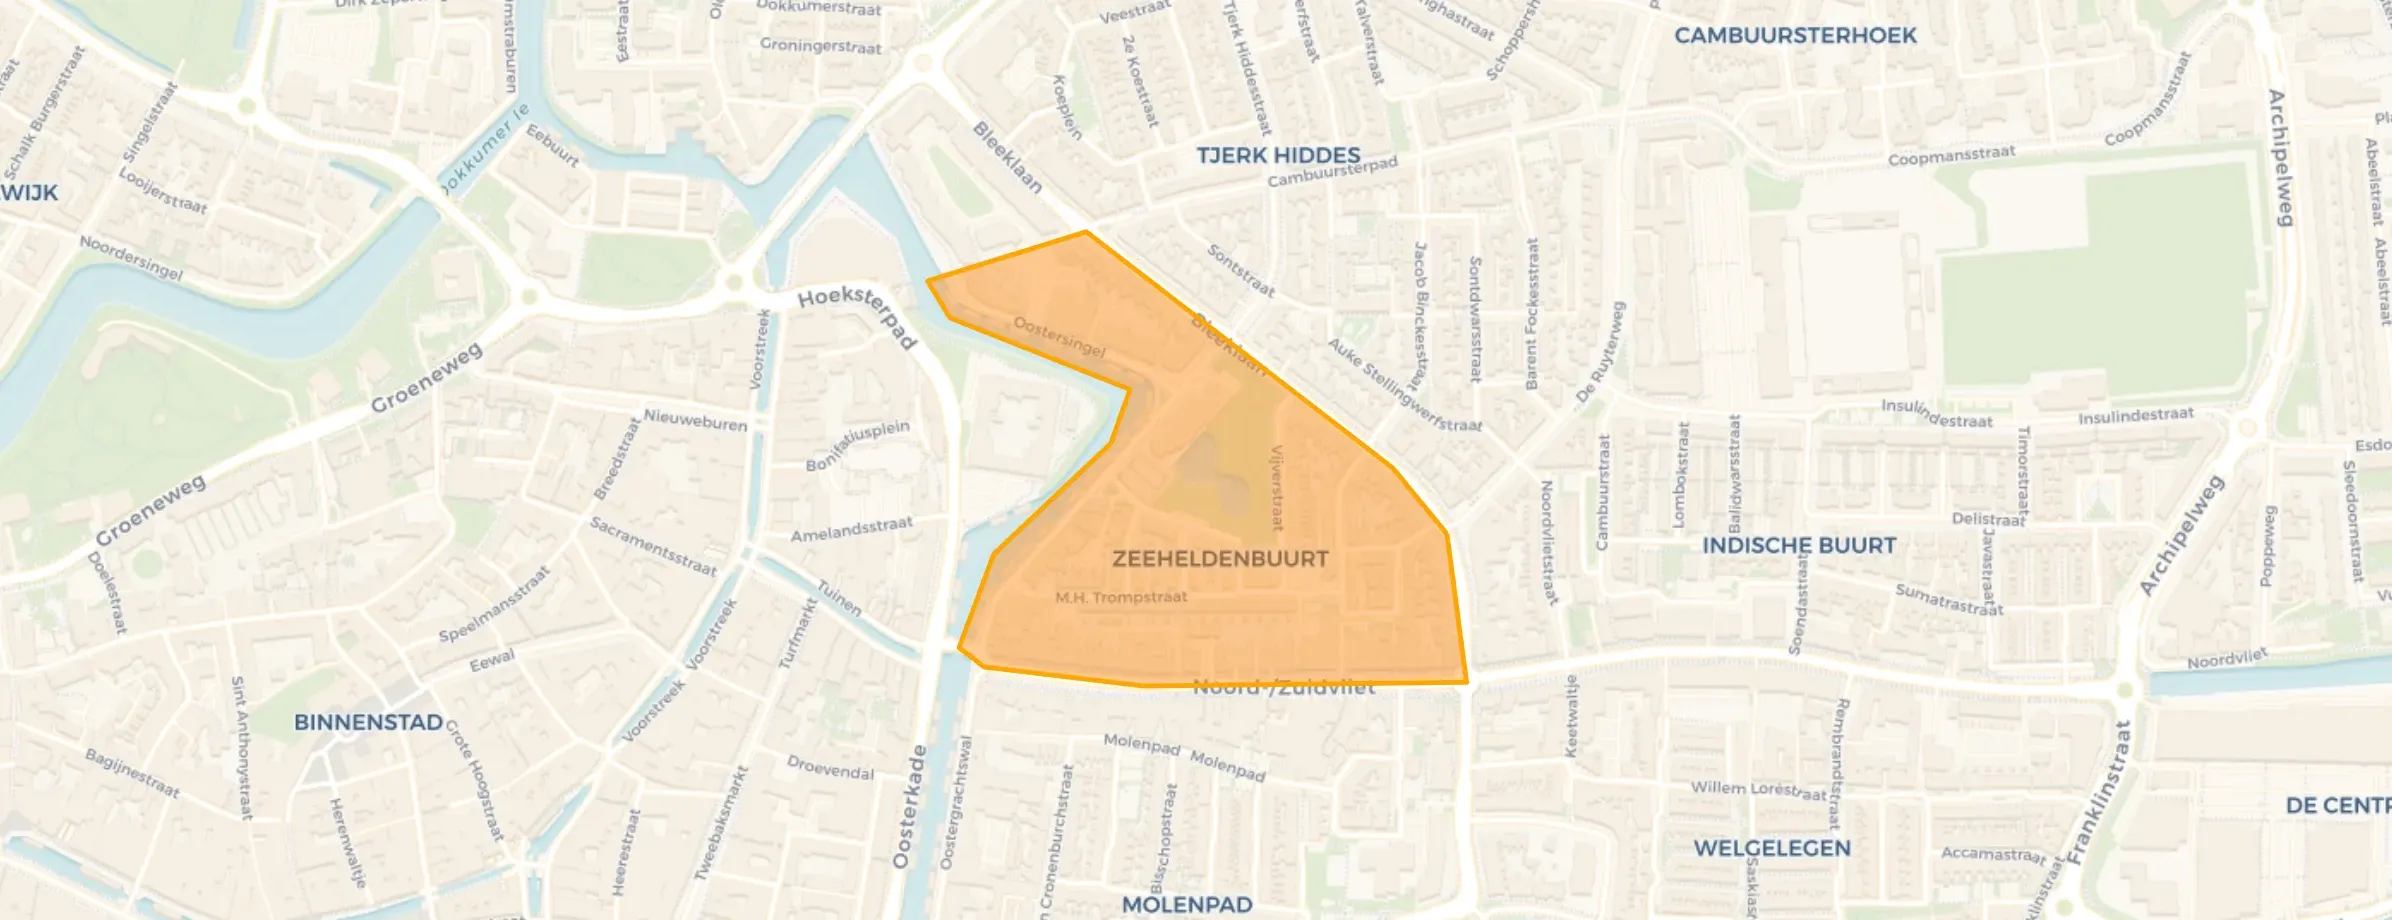
Oud-Oost is located in the province of Friesland, in the municipality of Leeuwarden The district has a total area of 156 hectares, of which 152 hectares are land and 4 hectares are water. The district is coded as WK008020. The postcode area is 8921AA-8922JL.
Oud-Oost has 12.420 residents. Of these, 50,4% are men and 49,6% are women. Most residents are 25 to 45 years (33,9%). The other age groups are 20,7% for '45 to 65 years', 19,8% for '15 to 25 years', 15,2% for '65 years or older' and 10,5% for '0 to 15 years'. Of the residents, 67,8% is unmarried, 19,6% is married, 8,9% is divorced and 3,7% is widowed. 9.020 residents originate from the Netherlands, 1.215 come from Europe and 2.180 come from countries outside Europe.
There are 7.765 households in Oud-Oost. 61,9% of these are single-person households, 20,5% households without children and 17,6% households with children. The average household size is 1,6 persons. The national average is 2,1 persons.
In Oud-Oost there are 10.500 income recipients. The average income per income recipient is €31.200, which is €11.000 (26%) lower than the national average of €42.200. Per resident, the average income is €27.200, which is €7.700 (22%) lower than the national average of €34.900. Most residents of Oud-Oost are educated to an intermediate level. 46,6% have an intermediate education (HAVO, VWO or MBO 2-4), 27,3% have a lower education (VMBO or MBO 1) and 26,2% have a university or higher professional education (HBO/WO).
Of the 12.420 residents, around 66% are in paid employment, which amounts to 8.197 people. This is 6% lower than the national average of 72%. The majority of workers are in salaried employment (88%), while 12% are self-employed. In Oud-Oost, 27% of residents receive a benefit. The largest group is those receiving a state pension (AOW). 1.670 people receive this benefit.
In Oud-Oost there are 7.233 homes with an average assessed value (WOZ) of €199.000. Of these, around 95% are occupied and 5% unoccupied. Most homes are rental properties. This amounts to 63% rental homes and 37% owner-occupied homes. Of the homes, 37% privately owned, 30% owned by housing associations and 33% owned by other landlords. The most common construction periods in Oud-Oost are 1925-1950 (31%) and 1900-1925 (25%).
There are currently no homes for sale in Oud-Oost. The most recently listed home is Zuidvliet 462 by Scherjon + Van der Veen Makelaars op Funda. No homes were sold in Oud-Oost over the past year.
There are currently no homes for rent in Oud-Oost. The most recent home is Asterstraat 1, offered by www.frieslandhuurt.nl. No homes were let in Oud-Oost over the past year.
No recent rental data available for Oud-Oost.
In Oud-Oost there are 5.094 addresses with a registered energy label. The most common labels are C (25%), A (22%) and D (13%). On average, an address in Oud-Oost uses 1.850 kWh of electricity per year. This is 27% below the national average of 2.550 kWh. Natural gas consumption in this neighbourhood, at 800 m³ per year, exactly matches the national average.
You can sum it up as follows: > My experience with the Bloemenbuurt is very negative. In two consecutive situations, we had neighbours who caused a lot of nuisance. There were concerns about drug activities, the safety of children, and serious incidents in the neighbourhood, including a car explosion. As a result, I don't feel safe here and I wouldn't choose to live in this neighbourhood myself. The housing is reasonable, but in my opinion, the houses on Azaleastraat are in need of a thorough renovation. Additionally, there are few to no amenities in the immediate vicinity, which does not improve the liveability of the neighbourhood. Based on my personal experiences, I would therefore not recommend the Bloemenbuurt as a place to live.
Auto-translated to English by AIAtmospheric neighbourhood with nice neighbours. Houses with a stately character interspersed with smaller workers' cottages. You can feel the history, you can walk straight into the city centre.
Auto-translated to English by AIAfter living in this neighbourhood for many years, a lot has changed in the meantime; many neighbours cause division among the residents, and they just do whatever they can't help doing. It must be the times, but it used to be nice living here.
Auto-translated to English by AIWe have little contact with the neighbours and other residents. Sometimes you do see things that don't belong in the neighbourhood.
Auto-translated to English by AIThis neighbourhood is praised everywhere, but the truth is less beautiful. People often cluster together to badmouth other neighbours. I've also heard that further down the street there's a serious neighbour dispute; apparently a middle-aged woman regularly bullies her surrounding neighbours and also causes damage to other neighbours' property. So living here isn't all that great after all. Klaas.
Auto-translated to English by AIPublic transport is frequent and plentiful here, so you can get around easily. The neighbourhood has a lot of litter and it also gets thrown into gardens. Also a lot of trouble with junkies.
Auto-translated to English by AIAlthough there are occasionally some vagrants wandering around the neighbourhood or drunk men making it a bit unsafe, it is otherwise a very nice neighbourhood. Everything is within walking or cycling distance and there are plenty of supermarkets, gyms and schools nearby. There's also a nice bakery at the end of the street. It's very pleasant living here. It's also clean, no litter on the streets and rubbish is collected often. There's a forest nearby but it's unsafe in the evening.
Auto-translated to English by AICosy. People greet each other and have a chat with you, and most people look out for each other.
Auto-translated to English by AIThe housing stock is predominantly pre-war — 63% of the homes date from before 1945. In addition, the most common type is terraced houses (42%).
Over the past year a home for sale in Oud-Oost was listed for an average of €270,701 (€2,847 per m²). That is 49% below the Dutch national average.
A rental home in Oud-Oost cost an average of €1,065 per month (€14 per m²). That is 51% below the national average.
Residents give Oud-Oost a 6.2 out of 10 based on 10 reviews. Accessibility stands out with a 7.9; community lags behind with a 5.3.
Wijk Oud-Oost has 12,420 residents. The largest age group is 25 to 45 years (34%). Notably, 62% of the households are single-person households.
A considerable share of the supply in Oud-Oost is less efficient: 25% has an E, F or G label. The average natural gas consumption per household is 800 m³ per year.
From Oud-Oost you can on average reach a supermarket at 0.4 km, a GP at 0.6 km, a railway station at 2.3 km, a primary school at 0.5 km (as the crow flies, source: CBS).
Right now you will find 81 homes for sale and 18 homes for rent in Oud-Oost.