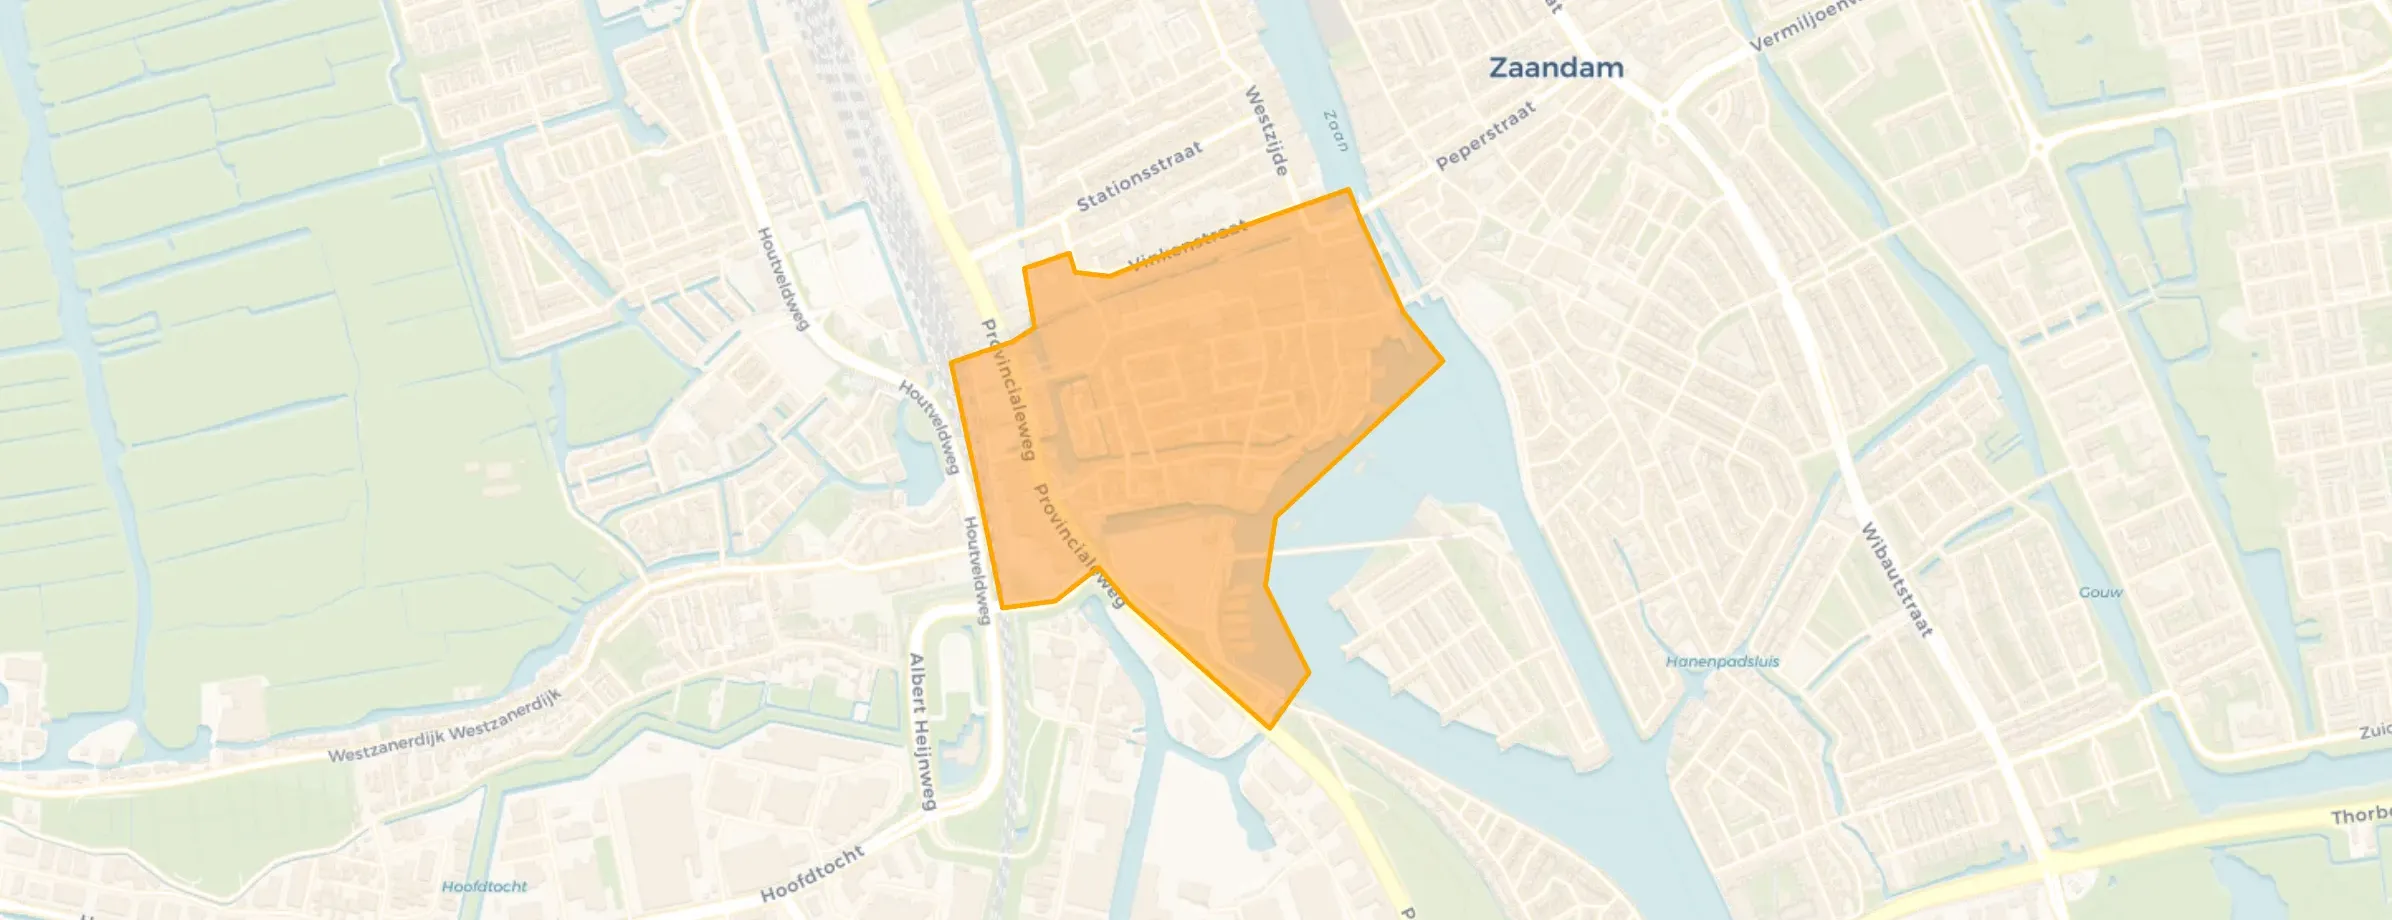
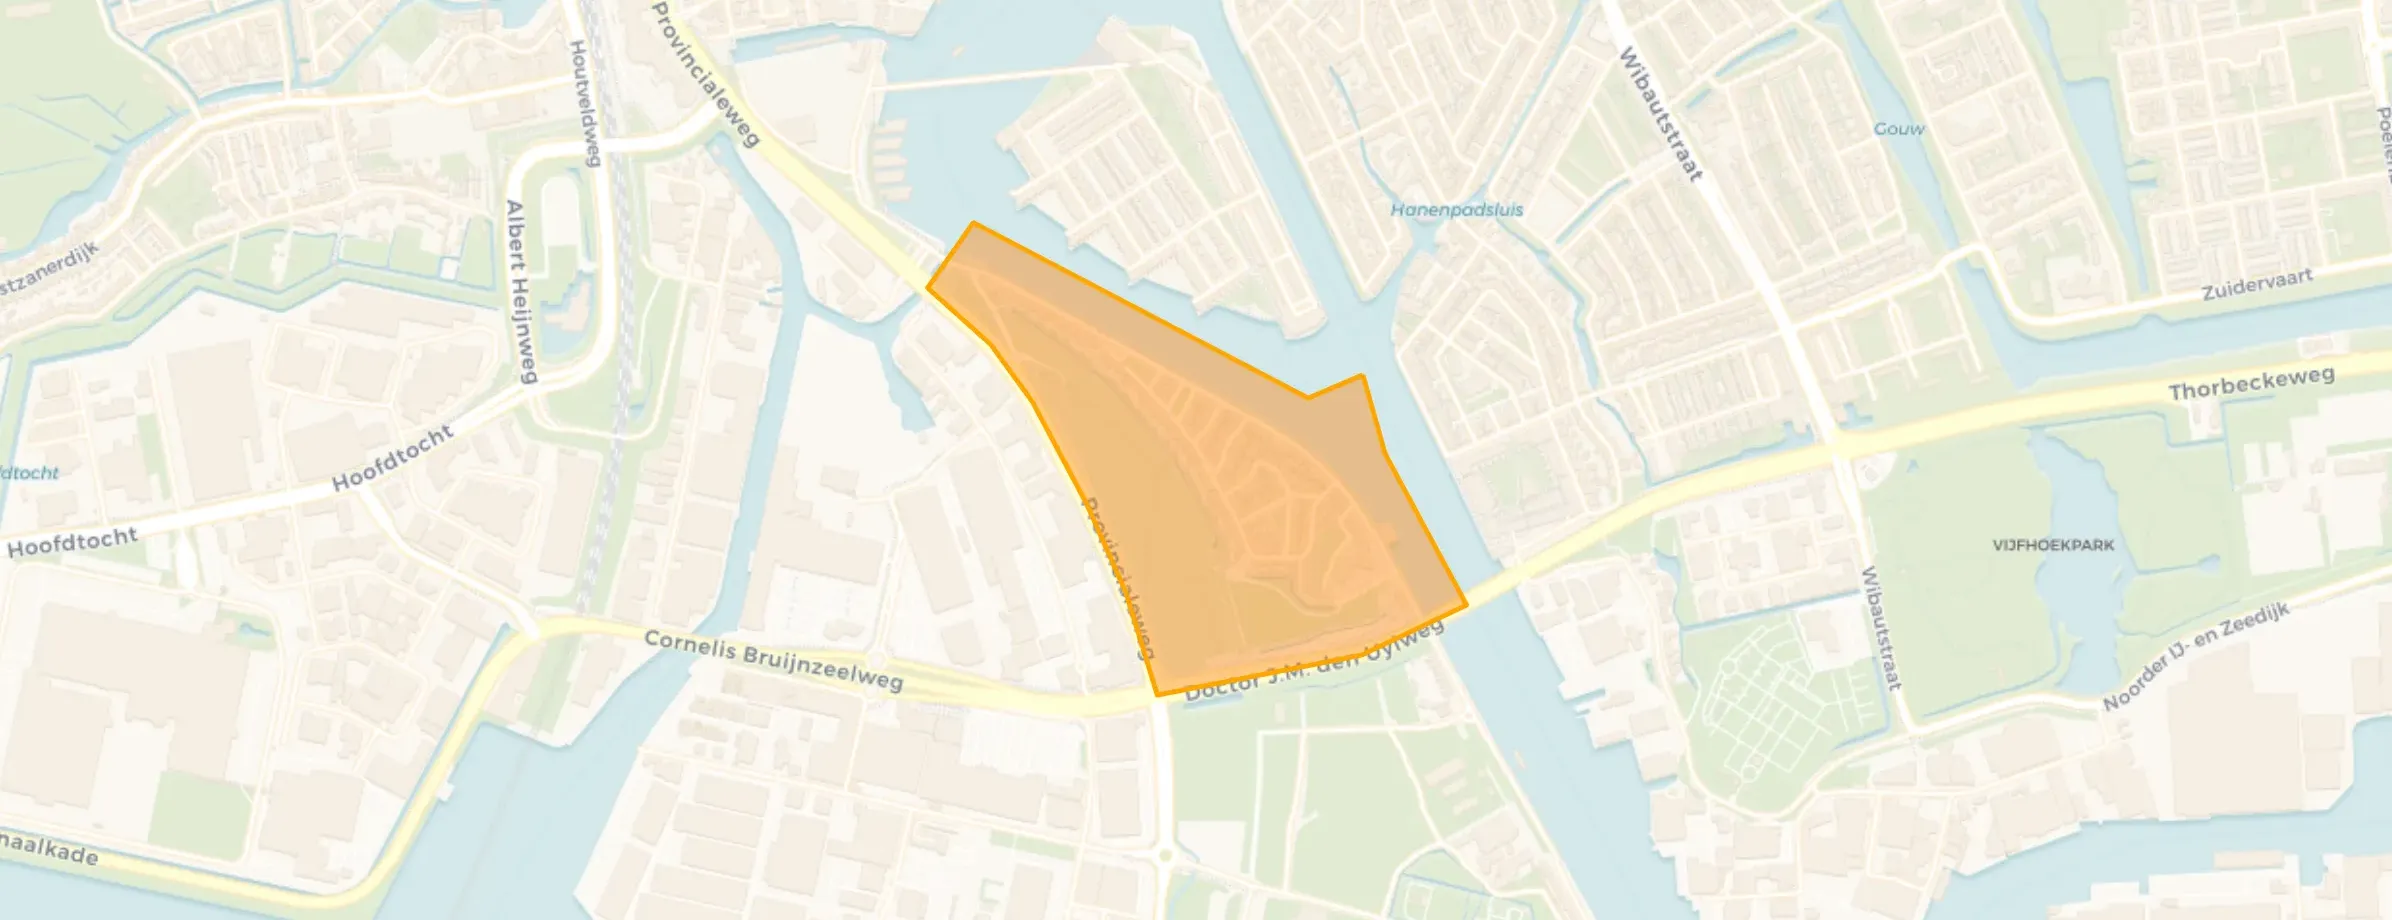
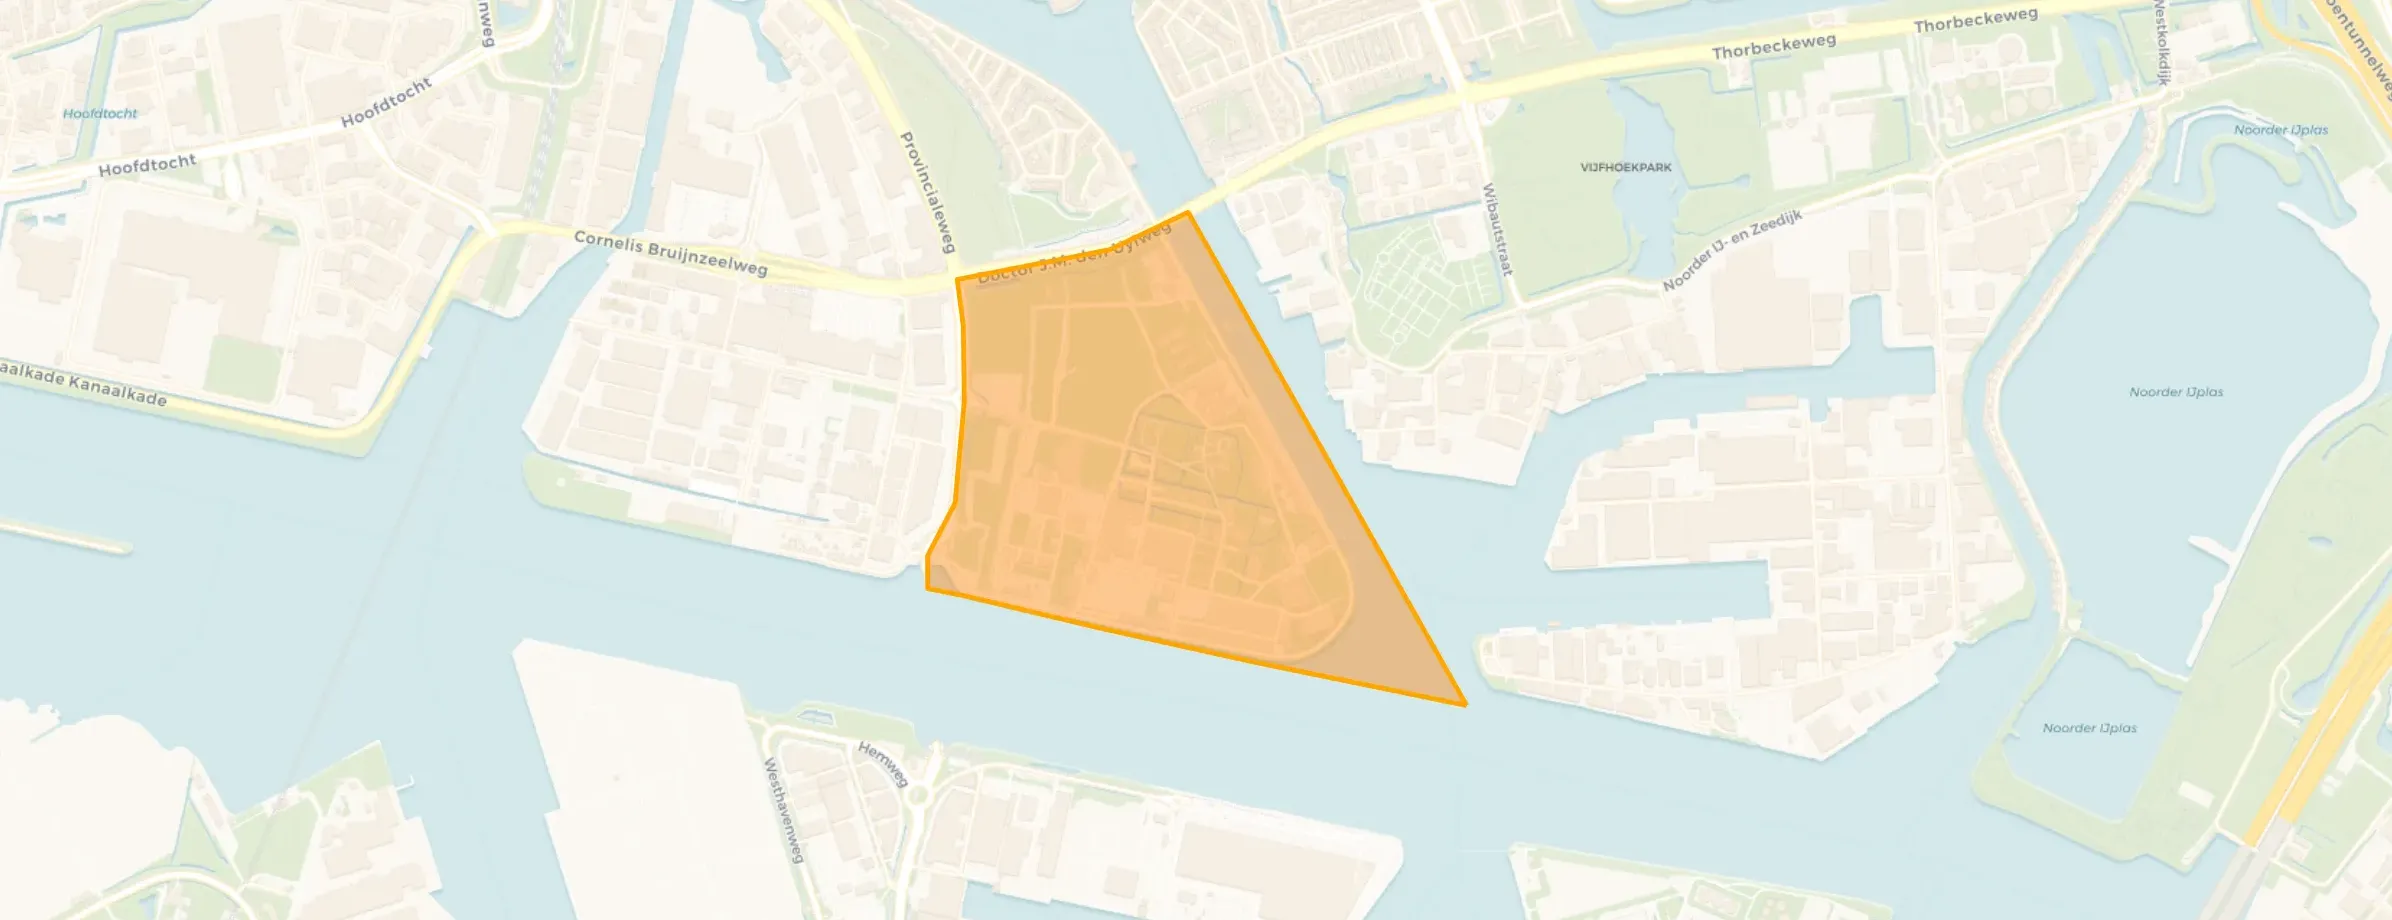
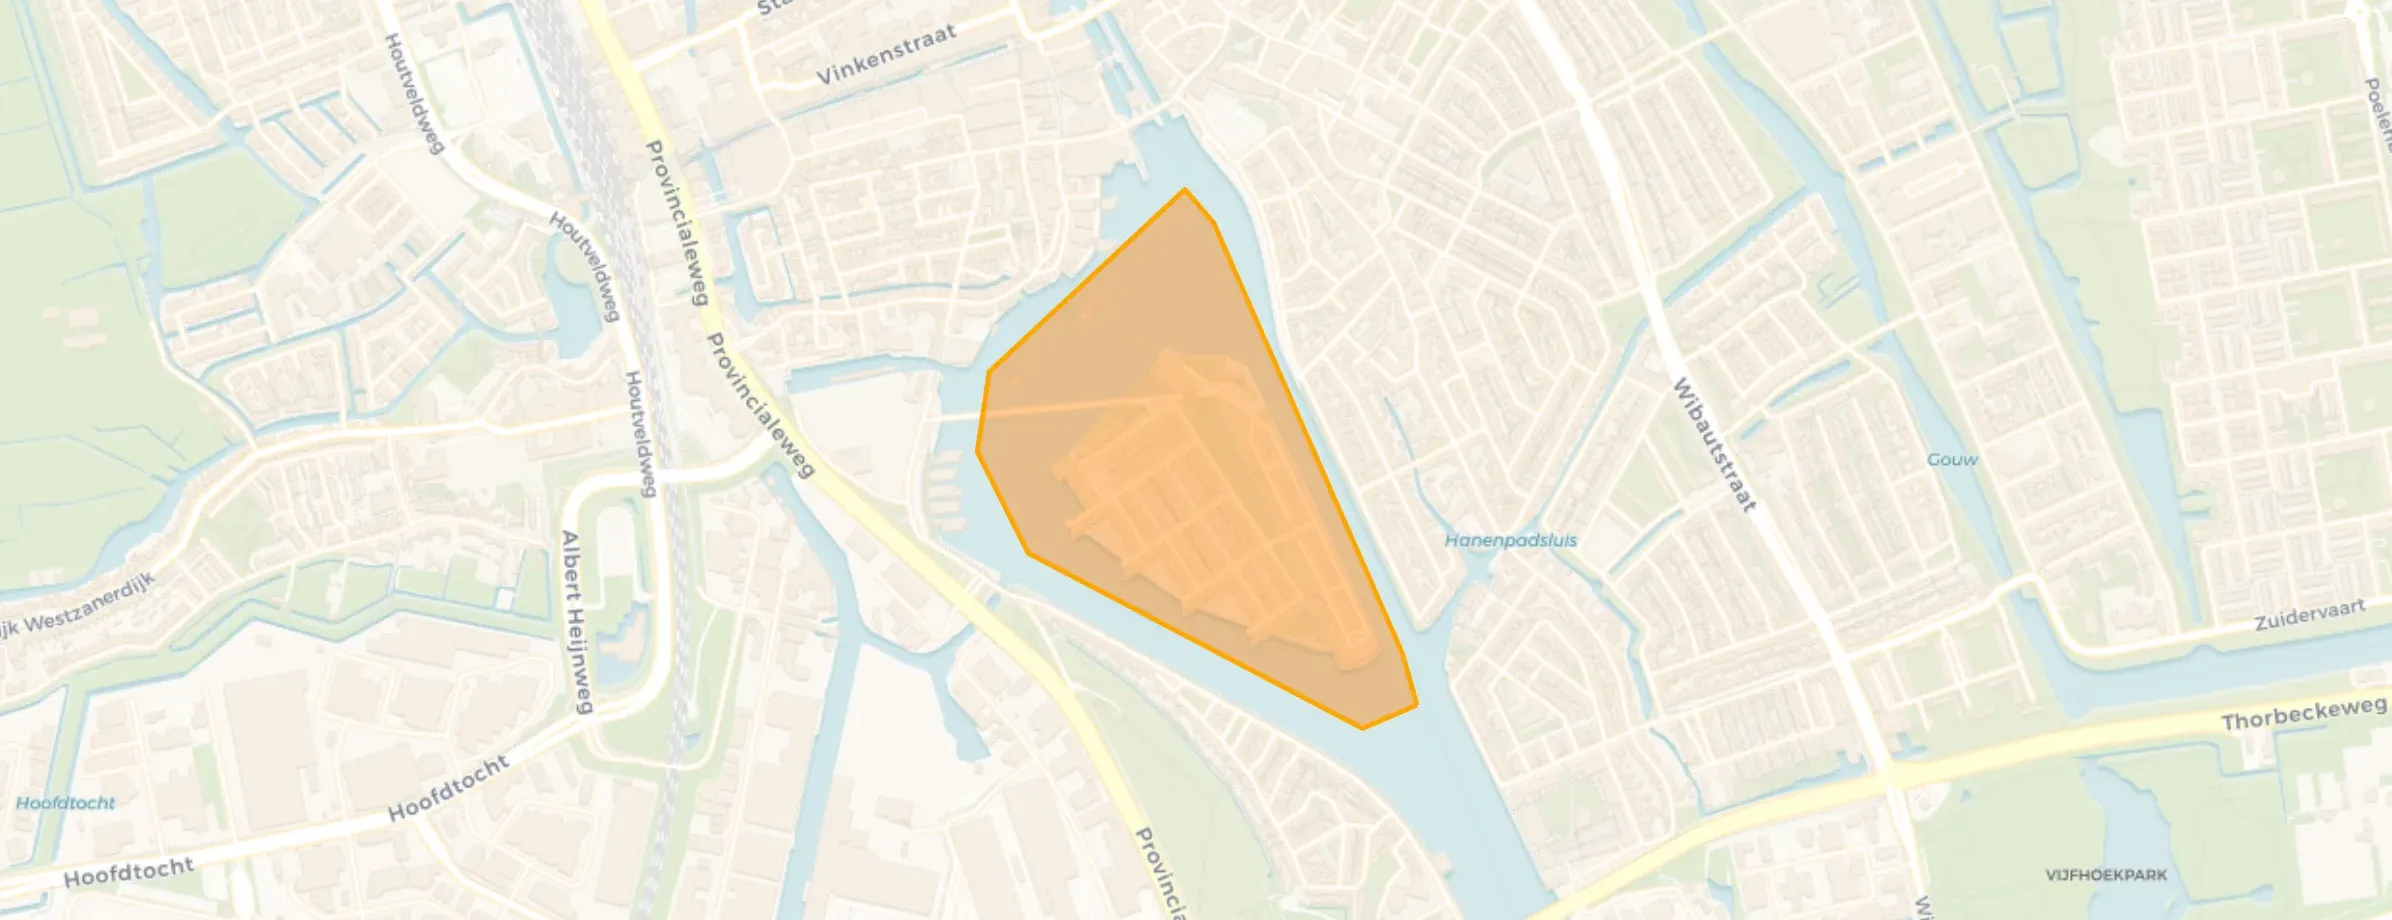
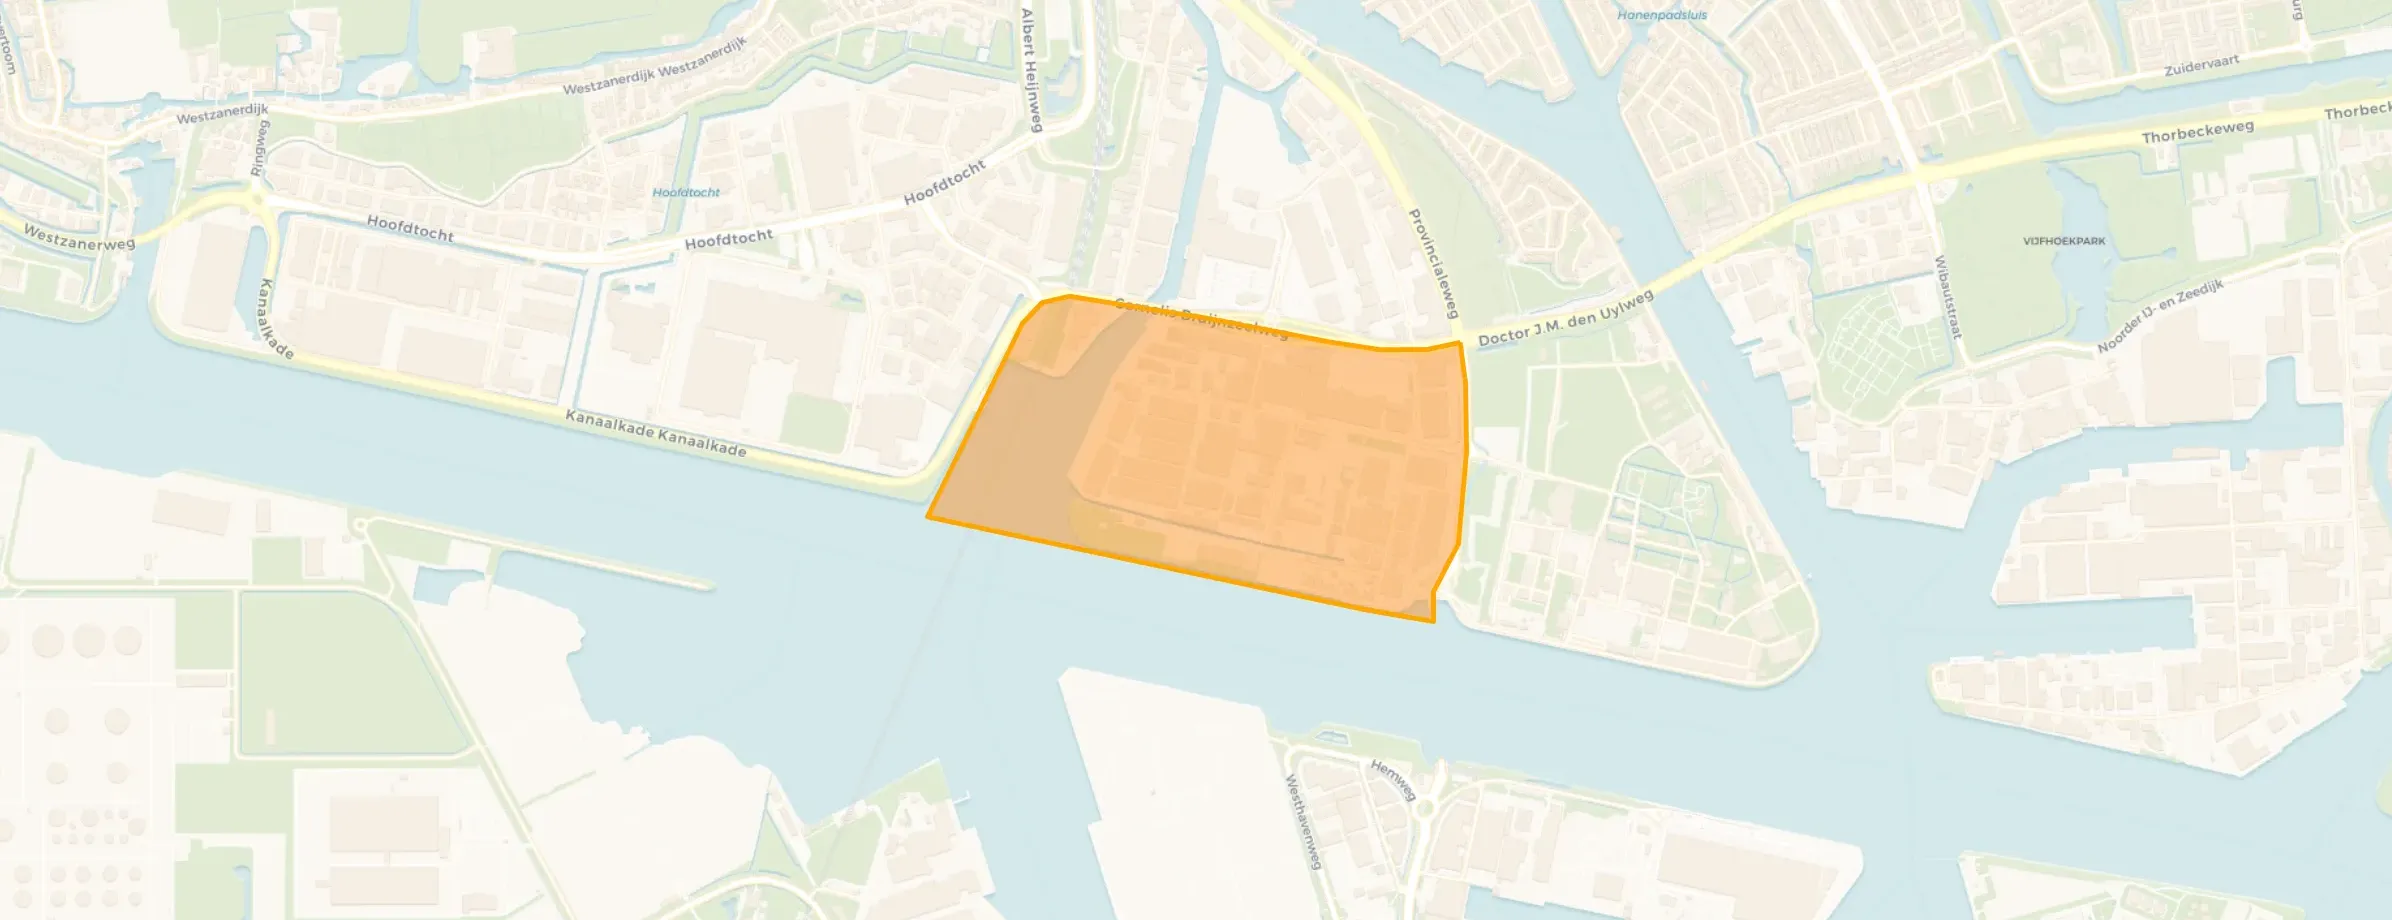
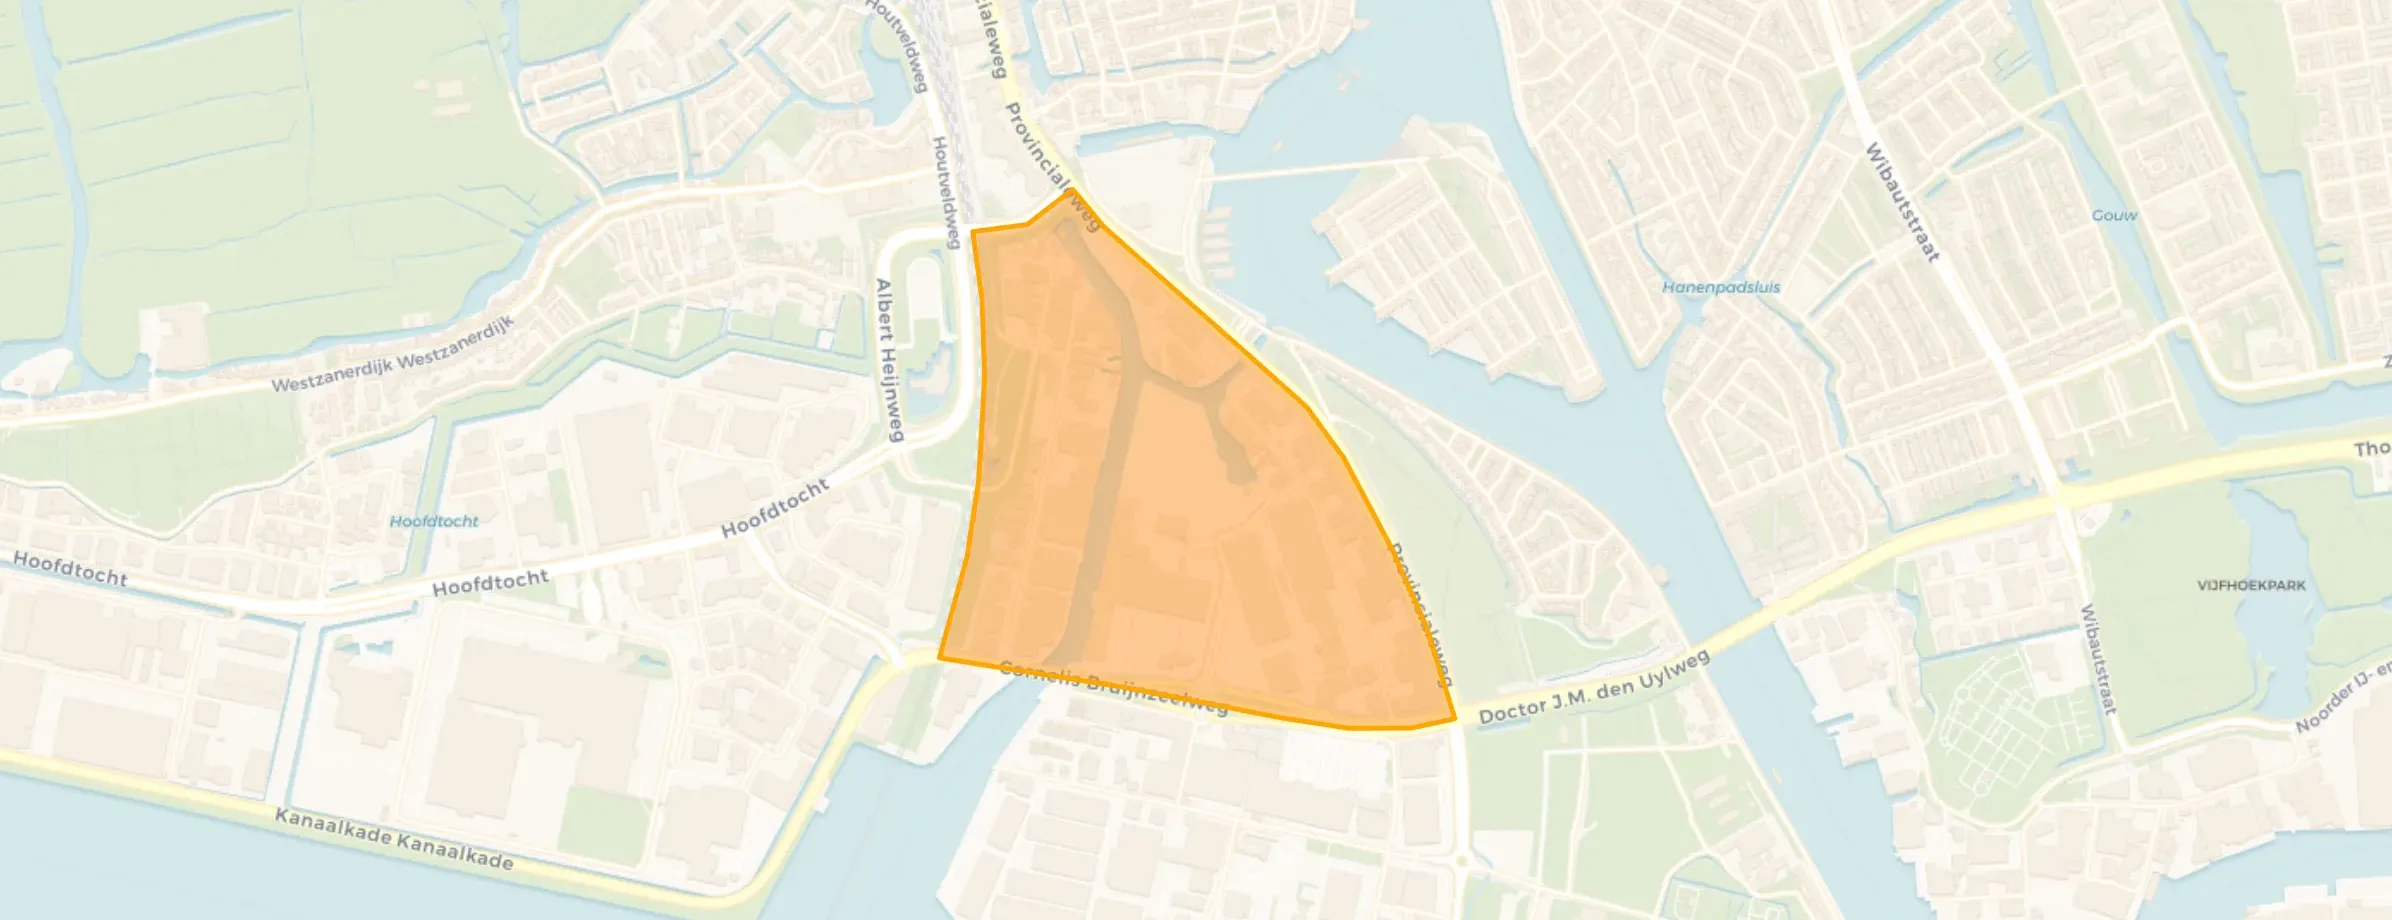
District in Zaanstad
Oude Haven is located in the province of Noord-Holland, in the municipality of Zaanstad The district has a total area of 269 hectares, of which 213 hectares are land and 56 hectares are water. The district is coded as WK047921. The postcode area is 1505RB-1507EH.
Oude Haven has 5.085 residents. Of these, 50,9% are men and 49,1% are women. Most residents are 25 to 45 years (29,9%). The other age groups are 27,3% for '45 to 65 years', 18,9% for '65 years or older', 13,0% for '0 to 15 years' and 10,9% for '15 to 25 years'. Of the residents, 53,0% is unmarried, 34,1% is married, 8,8% is divorced and 4,0% is widowed. 2.905 residents originate from the Netherlands, 895 come from Europe and 1.285 come from countries outside Europe.
There are 2.575 households in Oude Haven. 42,5% of these are single-person households, 28,7% households without children and 28,7% households with children. The average household size is 2,0 persons.
In Oude Haven there are 4.200 income recipients. The average income per income recipient is €39.200, which is €3.400 (9%) higher than the national average of €35.800. Per resident, the average income is €33.300, which is €4.100 (14%) higher than the national average of €29.200. Most residents of Oude Haven are educated to an intermediate level. 41,6% have an intermediate education (HAVO, VWO or MBO 2-4), 33,7% have a university or higher professional education (HBO/WO) and 24,7% have a lower education (VMBO or MBO 1).
Of the 5.085 residents, around 64% are in paid employment, which amounts to 3.254 people. This is 1% lower than the national average of 65%. The majority of workers are in salaried employment (83%), while 17% are self-employed. In Oude Haven, 24% of residents receive a benefit. The largest group is those receiving a state pension (AOW). 850 people receive this benefit.
In Oude Haven there are 2.385 homes with an average assessed value (WOZ) of €396.000. Of these, around 95% are occupied and 5% unoccupied. In Oude Haven there are roughly as many rental as owner-occupied homes. This amounts to 49% rental homes and 51% owner-occupied homes. Of the homes, 51% privately owned, 30% owned by housing associations and 19% owned by other landlords. The most common construction periods in Oude Haven are 2020 and later (30%) and 1990-2000 (16%).
There are currently no homes for sale in Oude Haven. The most recently listed home is Justpier 112 by Bert van Vulpen makelaars + hypotheken Zaandam op Funda. No homes were sold in Oude Haven over the past year.
There are currently no homes for rent in Oude Haven. The most recent home is Hermitage 131, offered by www.vva.amsterdam. No homes were let in Oude Haven over the past year.
No recent rental data available for Oude Haven.
In Oude Haven there are 2.760 addresses with a registered energy label. The most common labels are A (28%), B (22%) and C (16%). On average, an address in Oude Haven uses 2.450 kWh of electricity per year. This is 13% below the national average of 2.810 kWh. With an annual consumption of 900 m³ per address, natural gas consumption is 30% below the national average of 1.280 m³.
This neighbourhood is deteriorating; people are increasingly less willing to keep their own street clean. And from the municipality you can expect absolutely nothing. A small patch of grass that is used as a poop field for dogs. And on the other side of our house, the Houthaven quay is being built. Away sun, away freedom; the flats are so close that we have to sit with the curtains closed.
Auto-translated to English by AIIt's not really safe in the neighbourhood in the evenings. When there has been a market, it often takes another day before it's cleaned up. In my complex, only foreign people live, so I have little contact with the neighbours.
Auto-translated to English by AIThe housing stock is relatively young — 67% dates from after 1990. In addition, the most common type is flats (66%).
Over the past year a home for sale in Oude Haven was listed for an average of €473,590 (€4,602 per m²). Last quarter prices fell by 6%.
A rental home in Oude Haven cost an average of €1,900 per month (€23 per m²).
Wijk Oude Haven has 5,085 residents. The largest age group is 25 to 45 years (30%).
The housing supply in Oude Haven is remarkably efficient: 79% has an A, A+ or B label. The average natural gas consumption per household is 900 m³ per year.
From Oude Haven you can on average reach a supermarket at 0.8 km, a GP at 1.2 km, a railway station at 1.4 km, a primary school at 1.0 km (as the crow flies, source: CBS).
Right now you will find 52 homes for sale and 39 homes for rent in Oude Haven. A home for sale here is listed for an average of 101 days — relatively long for the current market.