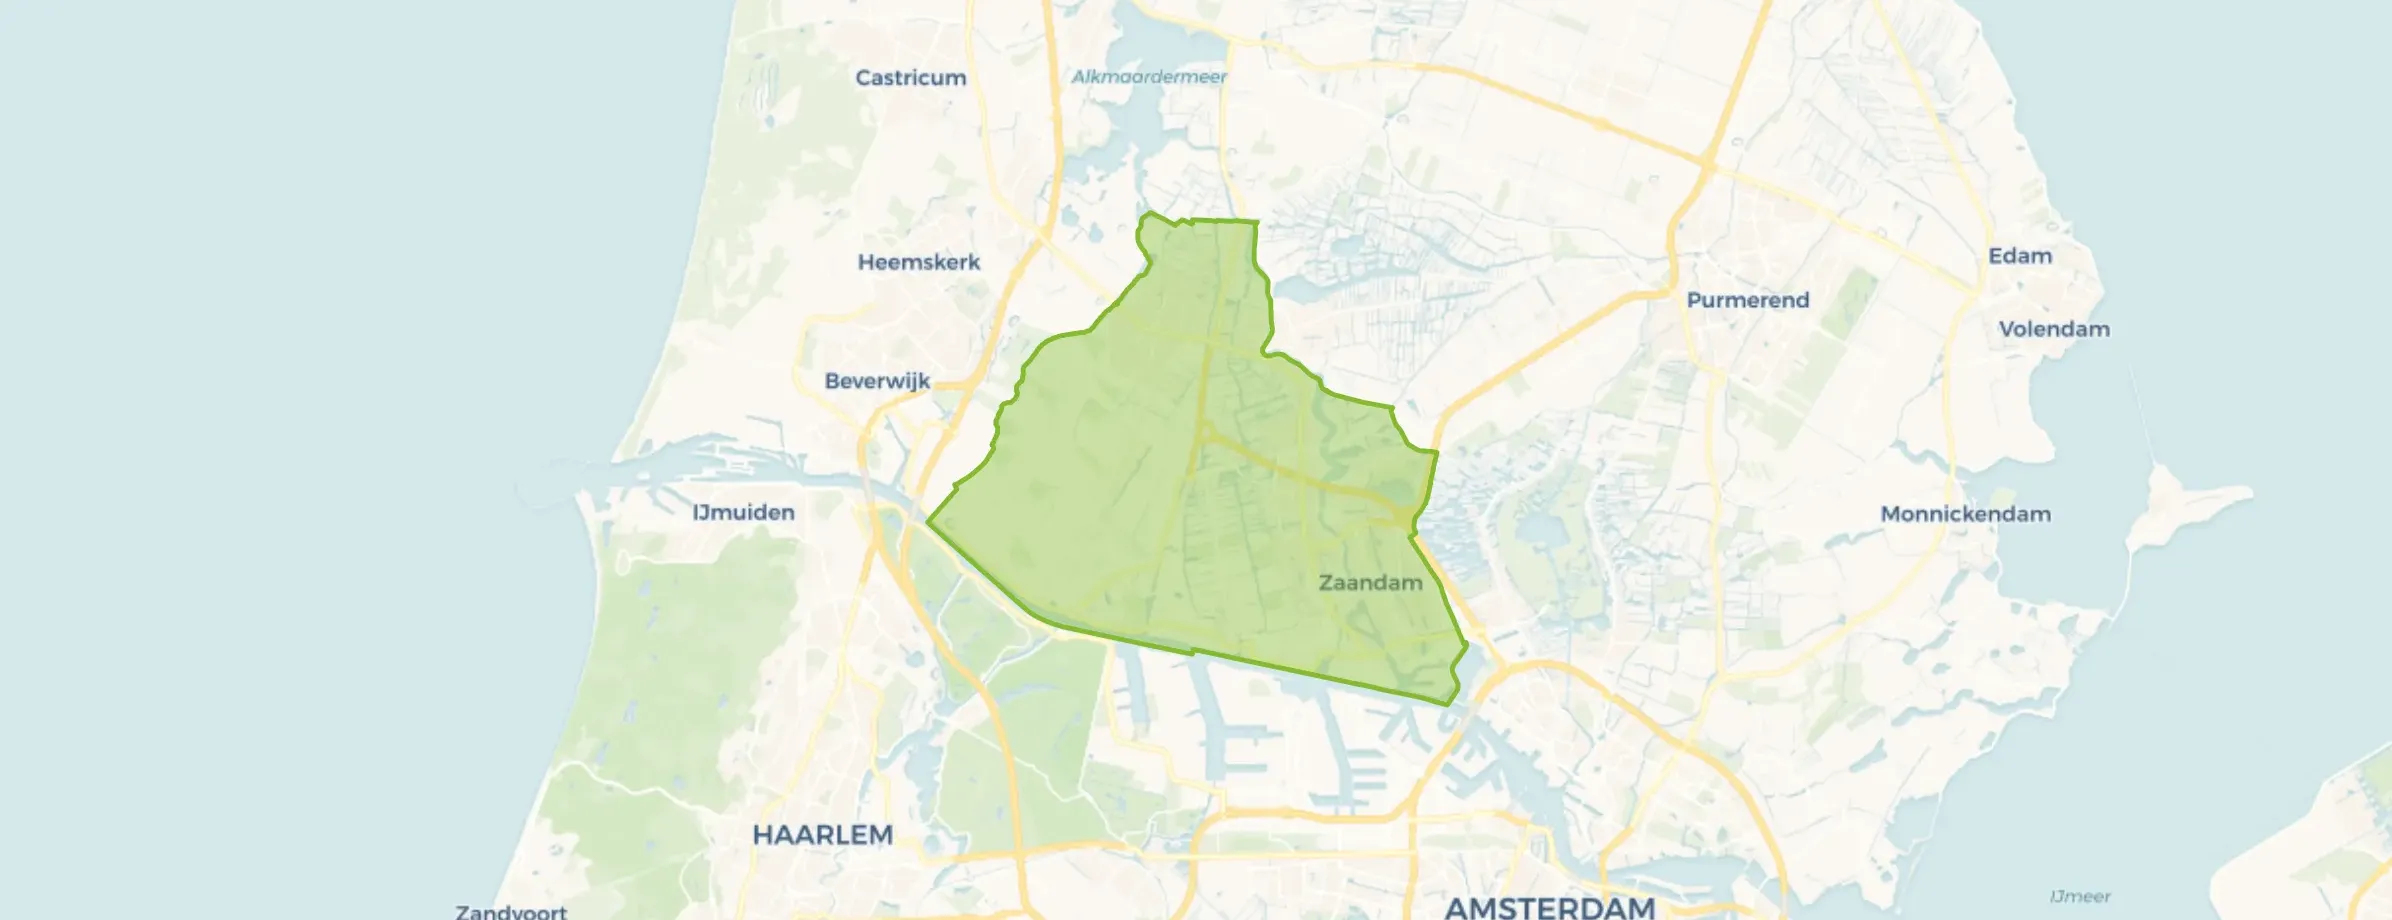
Municipality in Noord-Holland
Zaanstad is located in the province of Noord-Holland The municipality has a total area of 8.324 hectares, of which 7.374 hectares are land and 949 hectares are water. The municipality is coded as GM0479. The postcode area is 1501AA-1567NH.
Zaanstad has 161.389 residents. Of these, 49,7% are men and 50,3% are women. Most residents are 45 to 65 years (27,0%). The other age groups are 26,7% for '25 to 45 years', 18,7% for '65 years or older', 16,1% for '0 to 15 years' and 11,5% for '15 to 25 years'. Of the residents, 50,9% is unmarried, 35,9% is married, 8,7% is divorced and 4,5% is widowed. 99.710 residents originate from the Netherlands, 16.620 come from Europe and 45.059 come from countries outside Europe.
There are 73.077 households in Zaanstad. 37,5% of these are single-person households, 26,0% households without children and 36,5% households with children. The average household size is 2,2 persons.
In Zaanstad there are 125.800 income recipients. The average income per income recipient is €35.800, which is €0 (0%) lower than the national average of €35.800. Per resident, the average income is €29.100, which is €100 (0%) lower than the national average of €29.200. Most residents of Zaanstad are educated to an intermediate level. 45,2% have an intermediate education (HAVO, VWO or MBO 2-4), 28,3% have a lower education (VMBO or MBO 1) and 26,5% have a university or higher professional education (HBO/WO).
Of the 161.389 residents, around 64% are in paid employment, which amounts to 103.289 people. This is 1% lower than the national average of 65%. The majority of workers are in salaried employment (84%), while 16% are self-employed. In Zaanstad, 25% of residents receive a benefit. The largest group is those receiving a state pension (AOW). 26.850 people receive this benefit.
In Zaanstad there are 70.210 homes with an average assessed value (WOZ) of €368.000. Of these, around 97% are occupied and 3% unoccupied. In Zaanstad there are roughly as many rental as owner-occupied homes. This amounts to 46% rental homes and 54% owner-occupied homes. Of the homes, 54% privately owned, 37% owned by housing associations and 9% owned by other landlords. The most common construction periods in Zaanstad are 1950-1970 (26%) and 1970-1980 (12%).
There are currently no homes for sale in Zaanstad. The most recently listed home is Gedempte Gracht 44A3 by www.vva.amsterdam. No homes were sold in Zaanstad over the past year.
There are currently no homes for rent in Zaanstad. The most recent home is De Gashouder 97, offered by Brockhoff Verhuur op Funda. No homes were let in Zaanstad over the past year.
No recent rental data available for Zaanstad.
In Zaanstad there are 74.278 addresses with a registered energy label. The most common labels are C (25%), A (25%) and B (13%). On average, an address in Zaanstad uses 2.460 kWh of electricity per year. This is 12% below the national average of 2.810 kWh. With an annual consumption of 920 m³ per address, natural gas consumption is 28% below the national average of 1.280 m³.
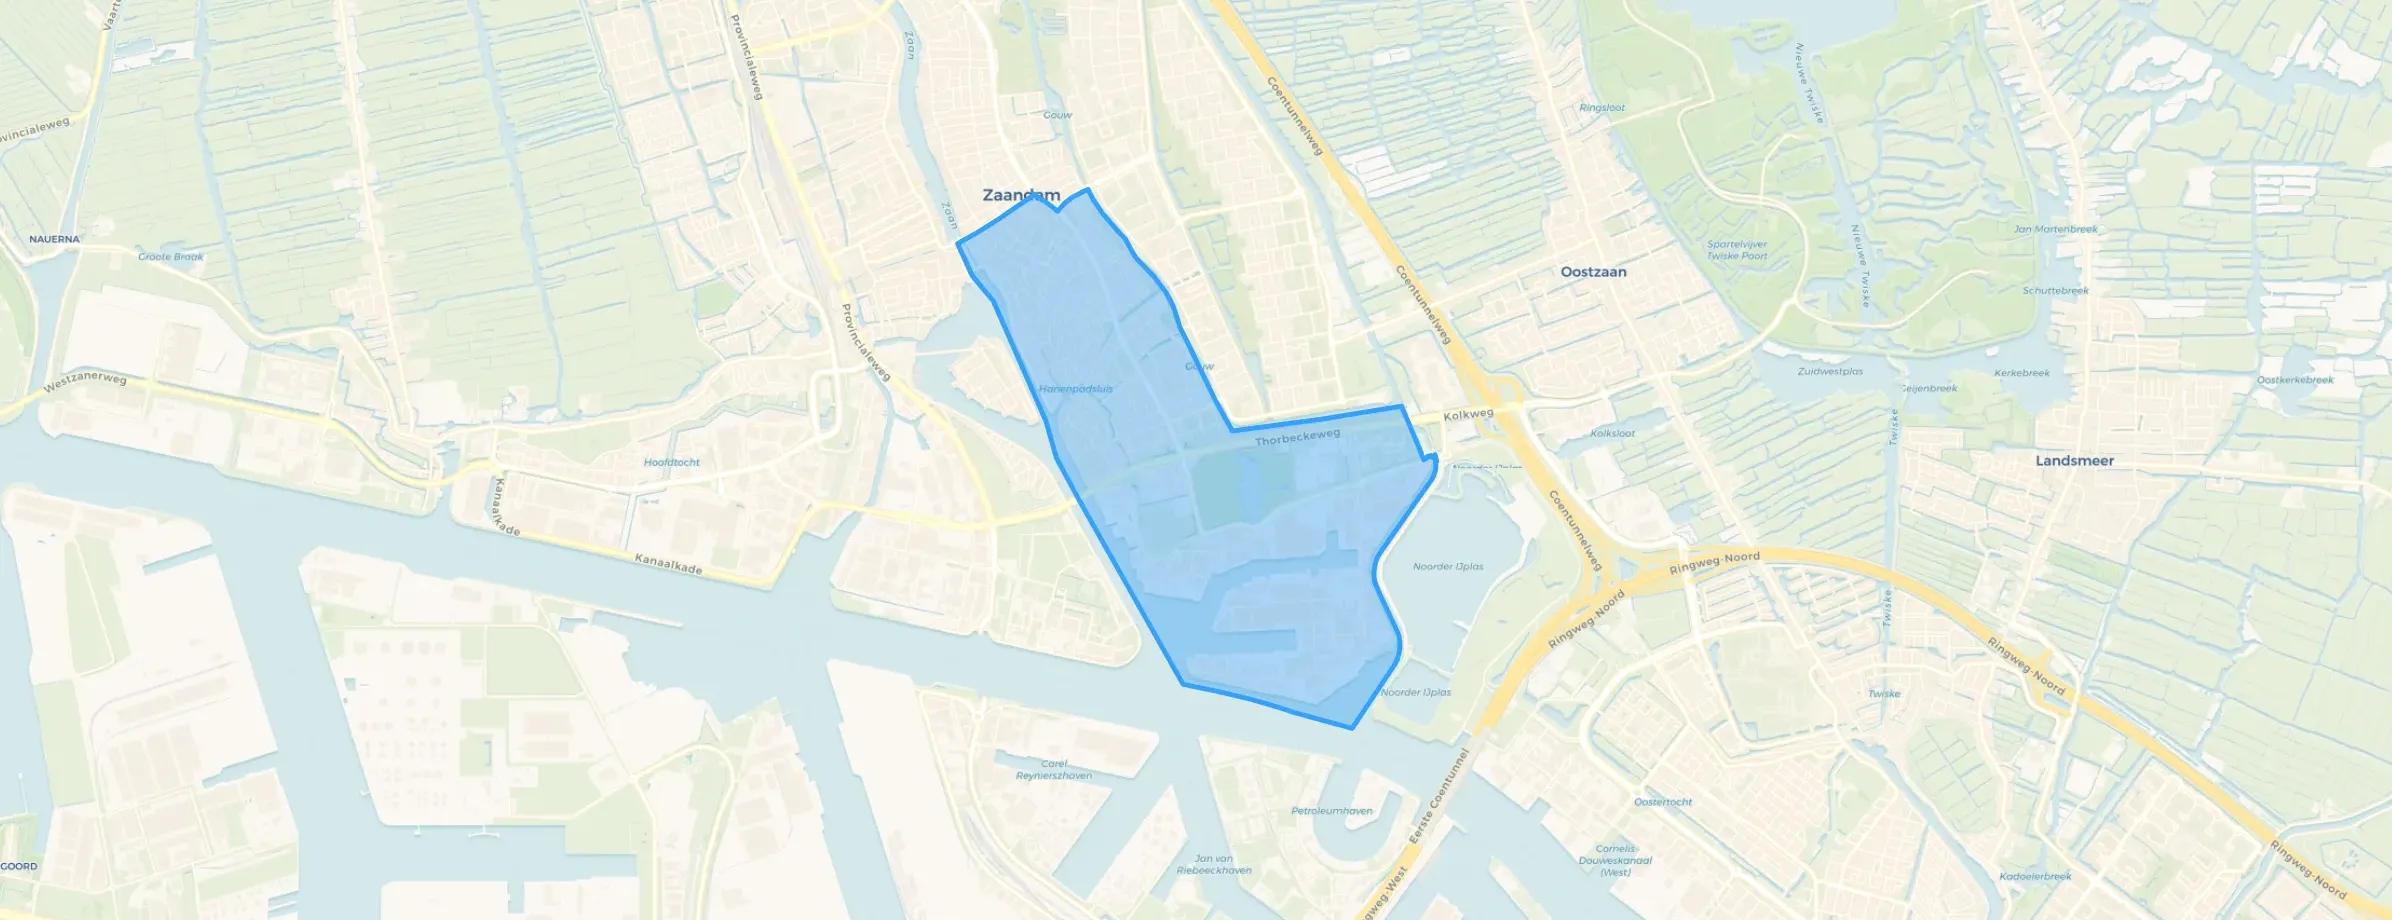


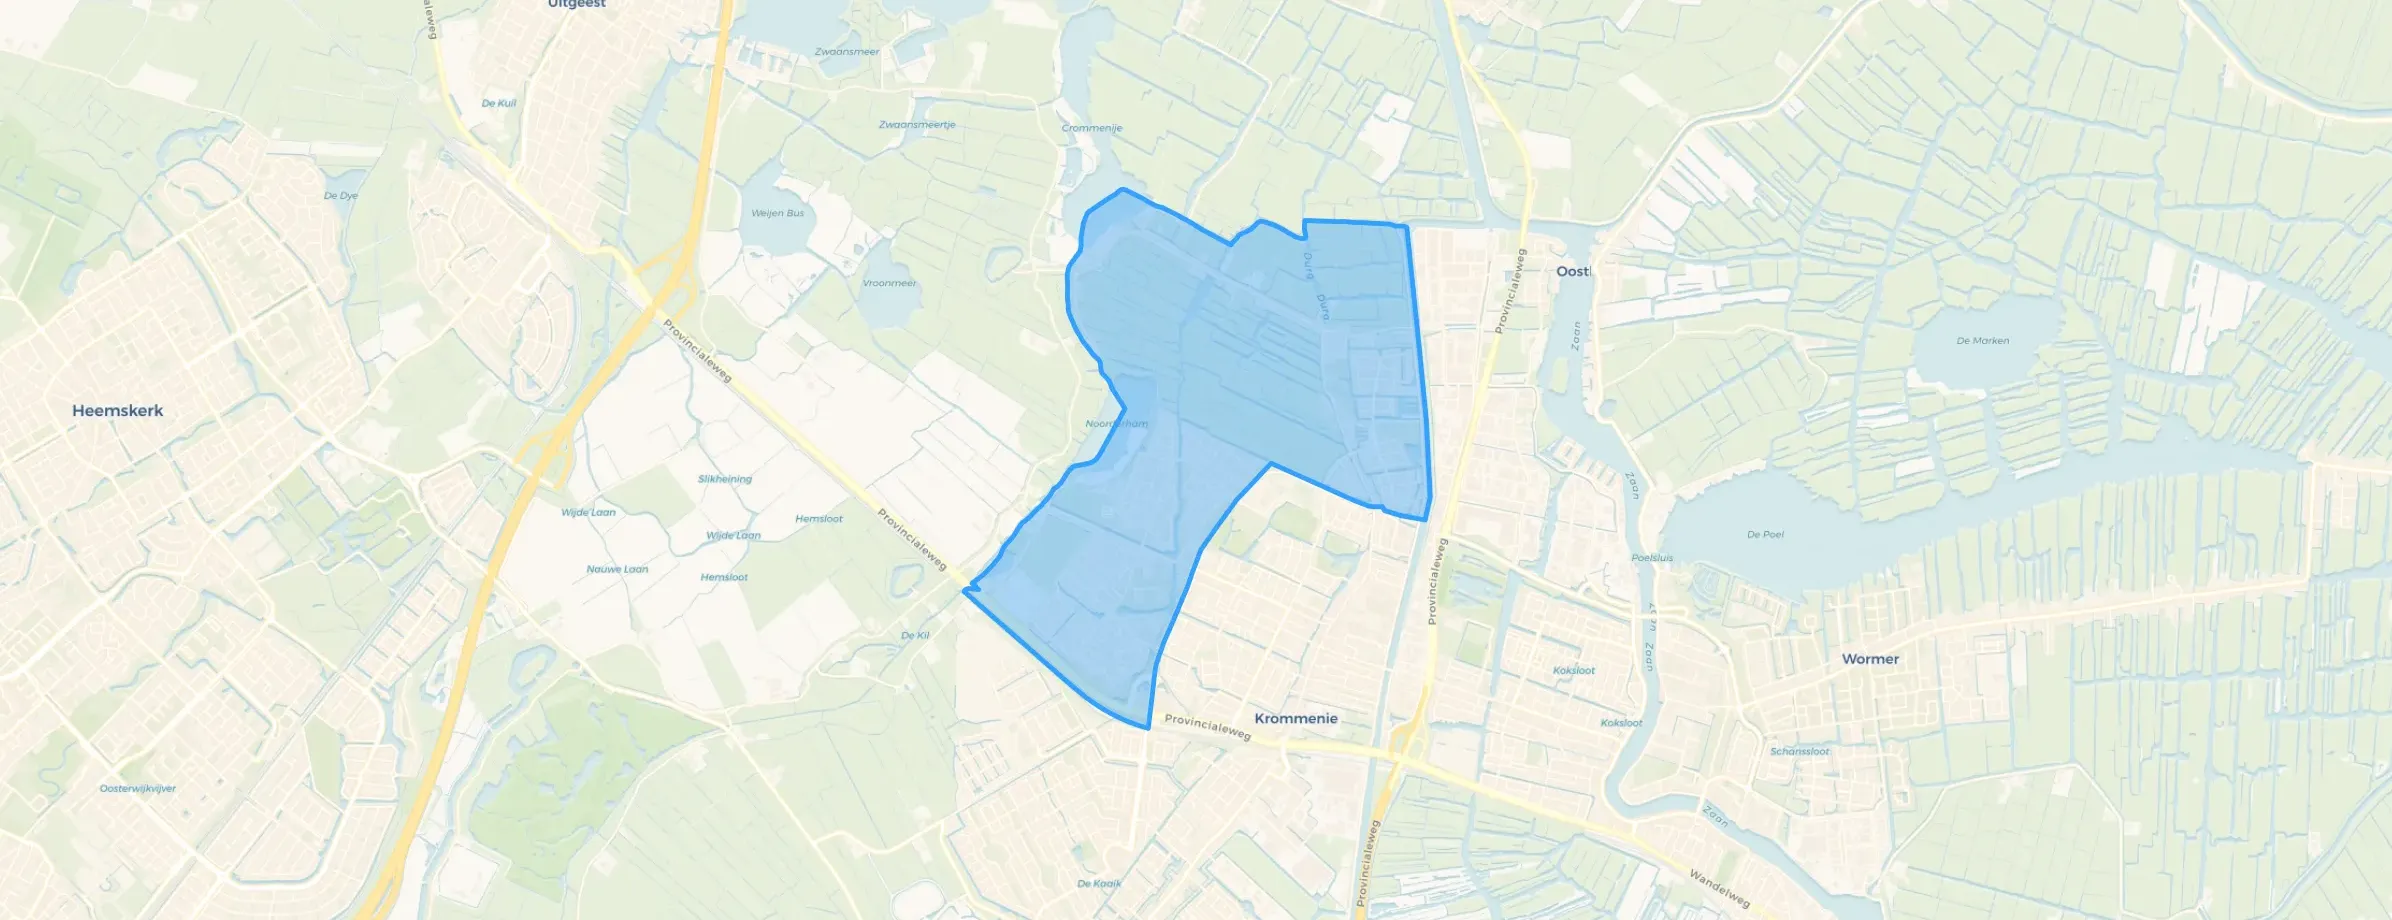
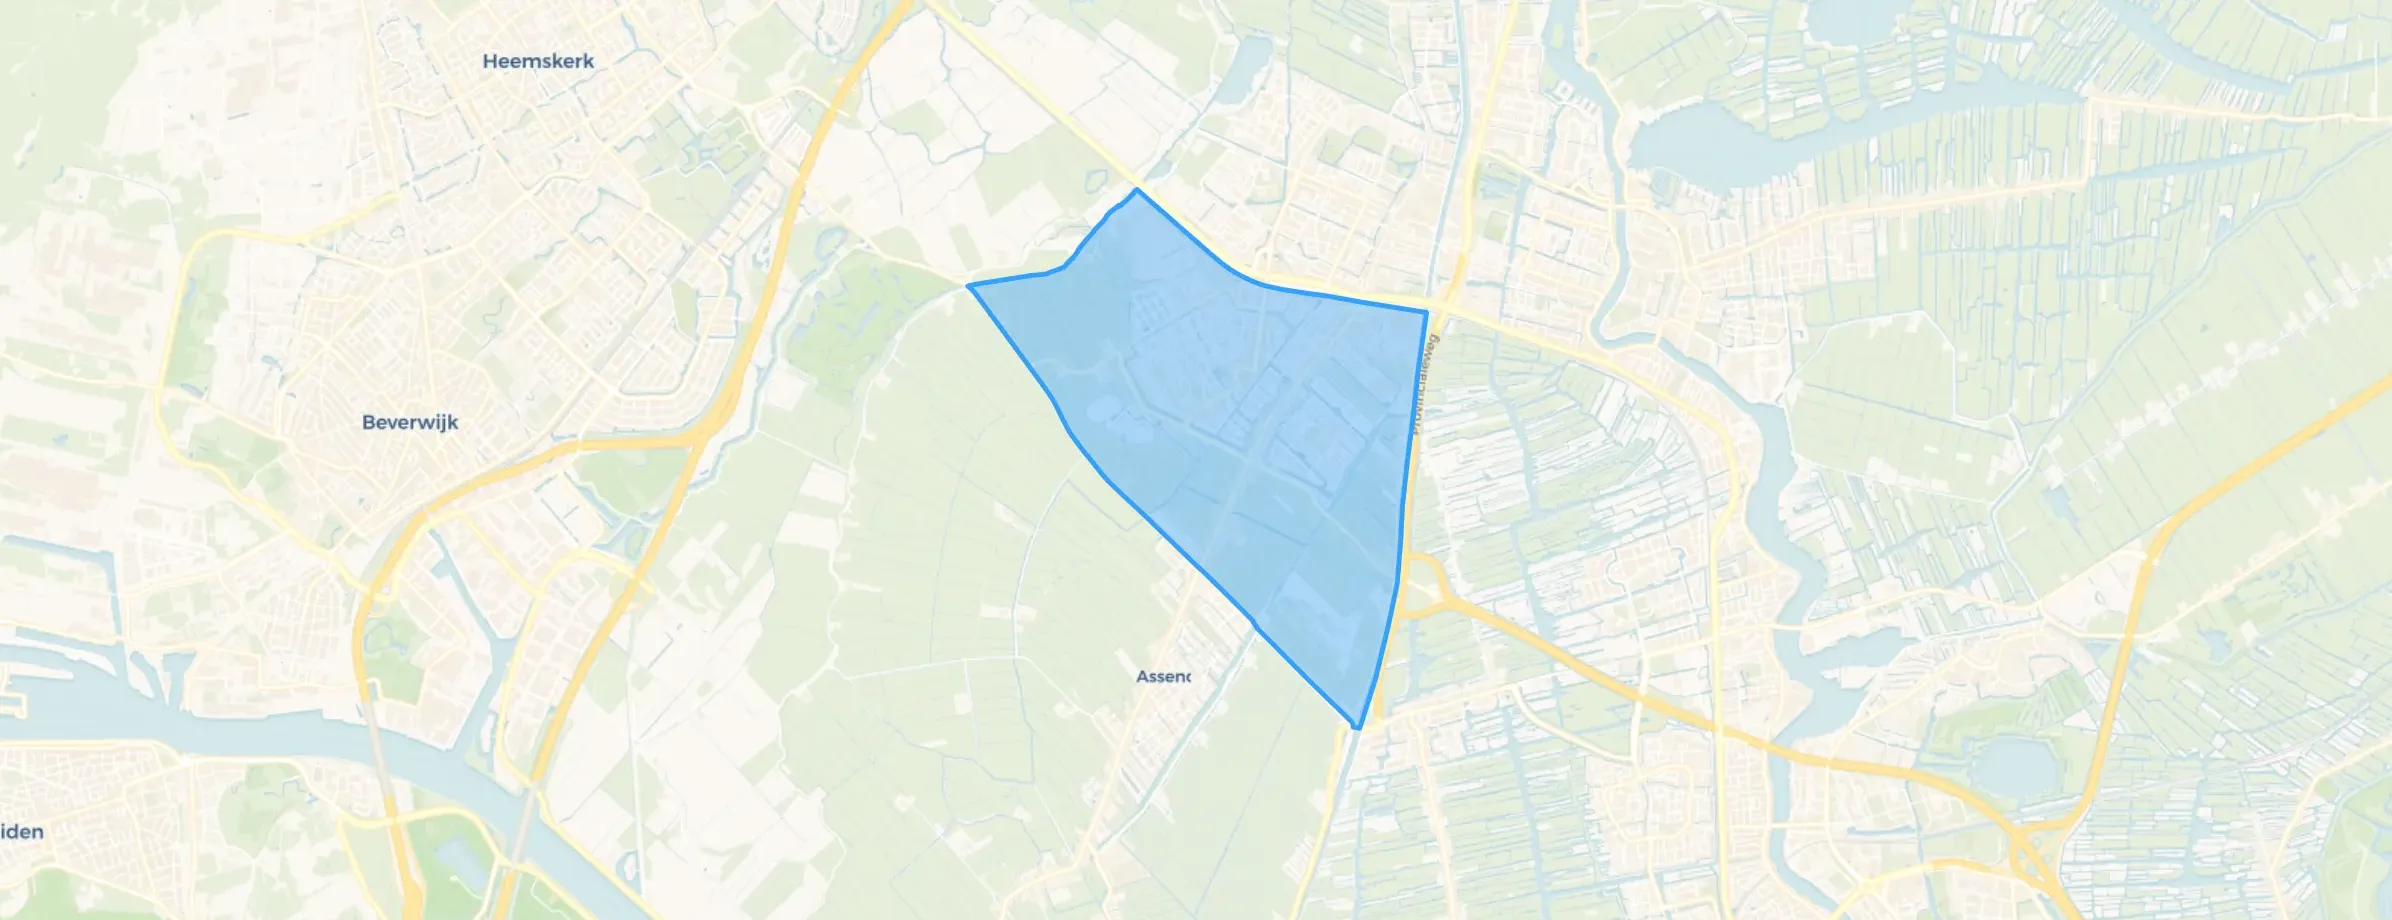

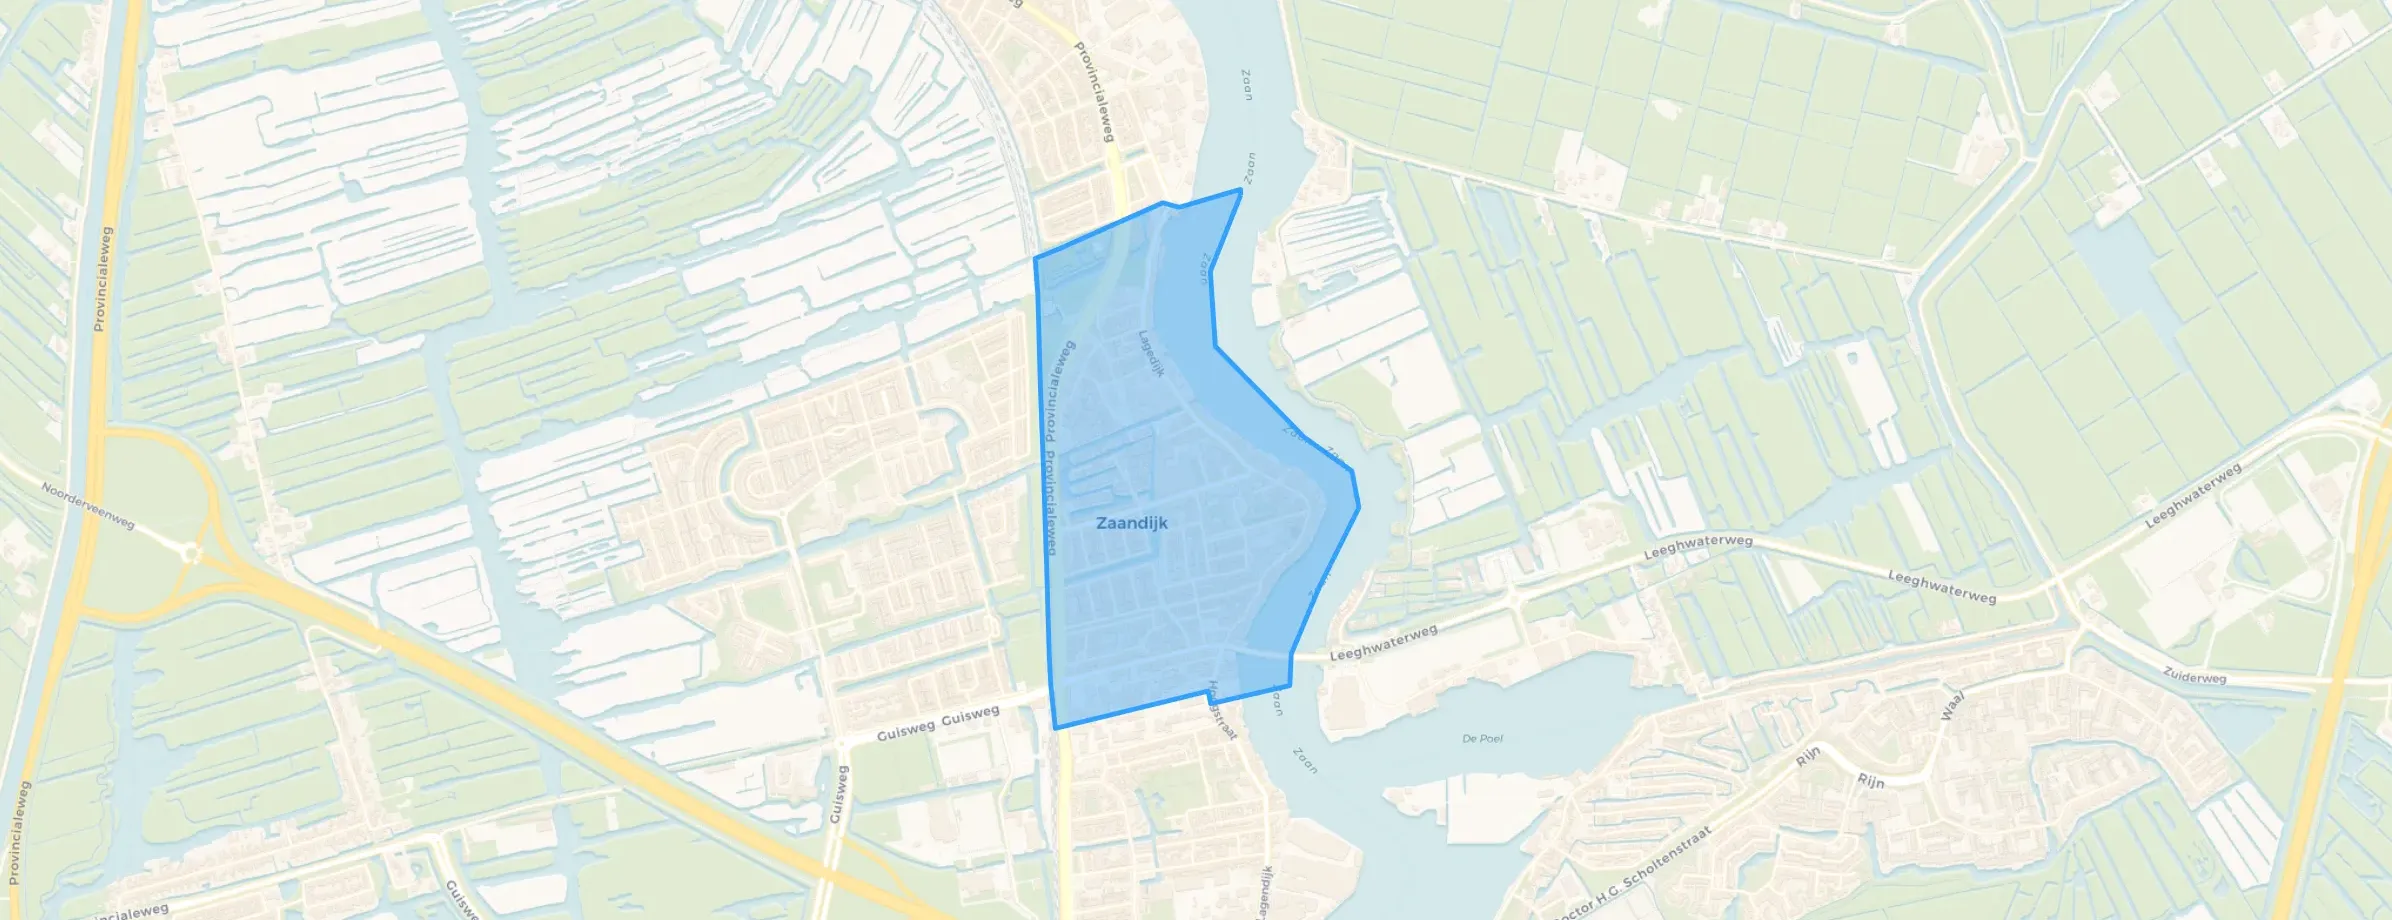


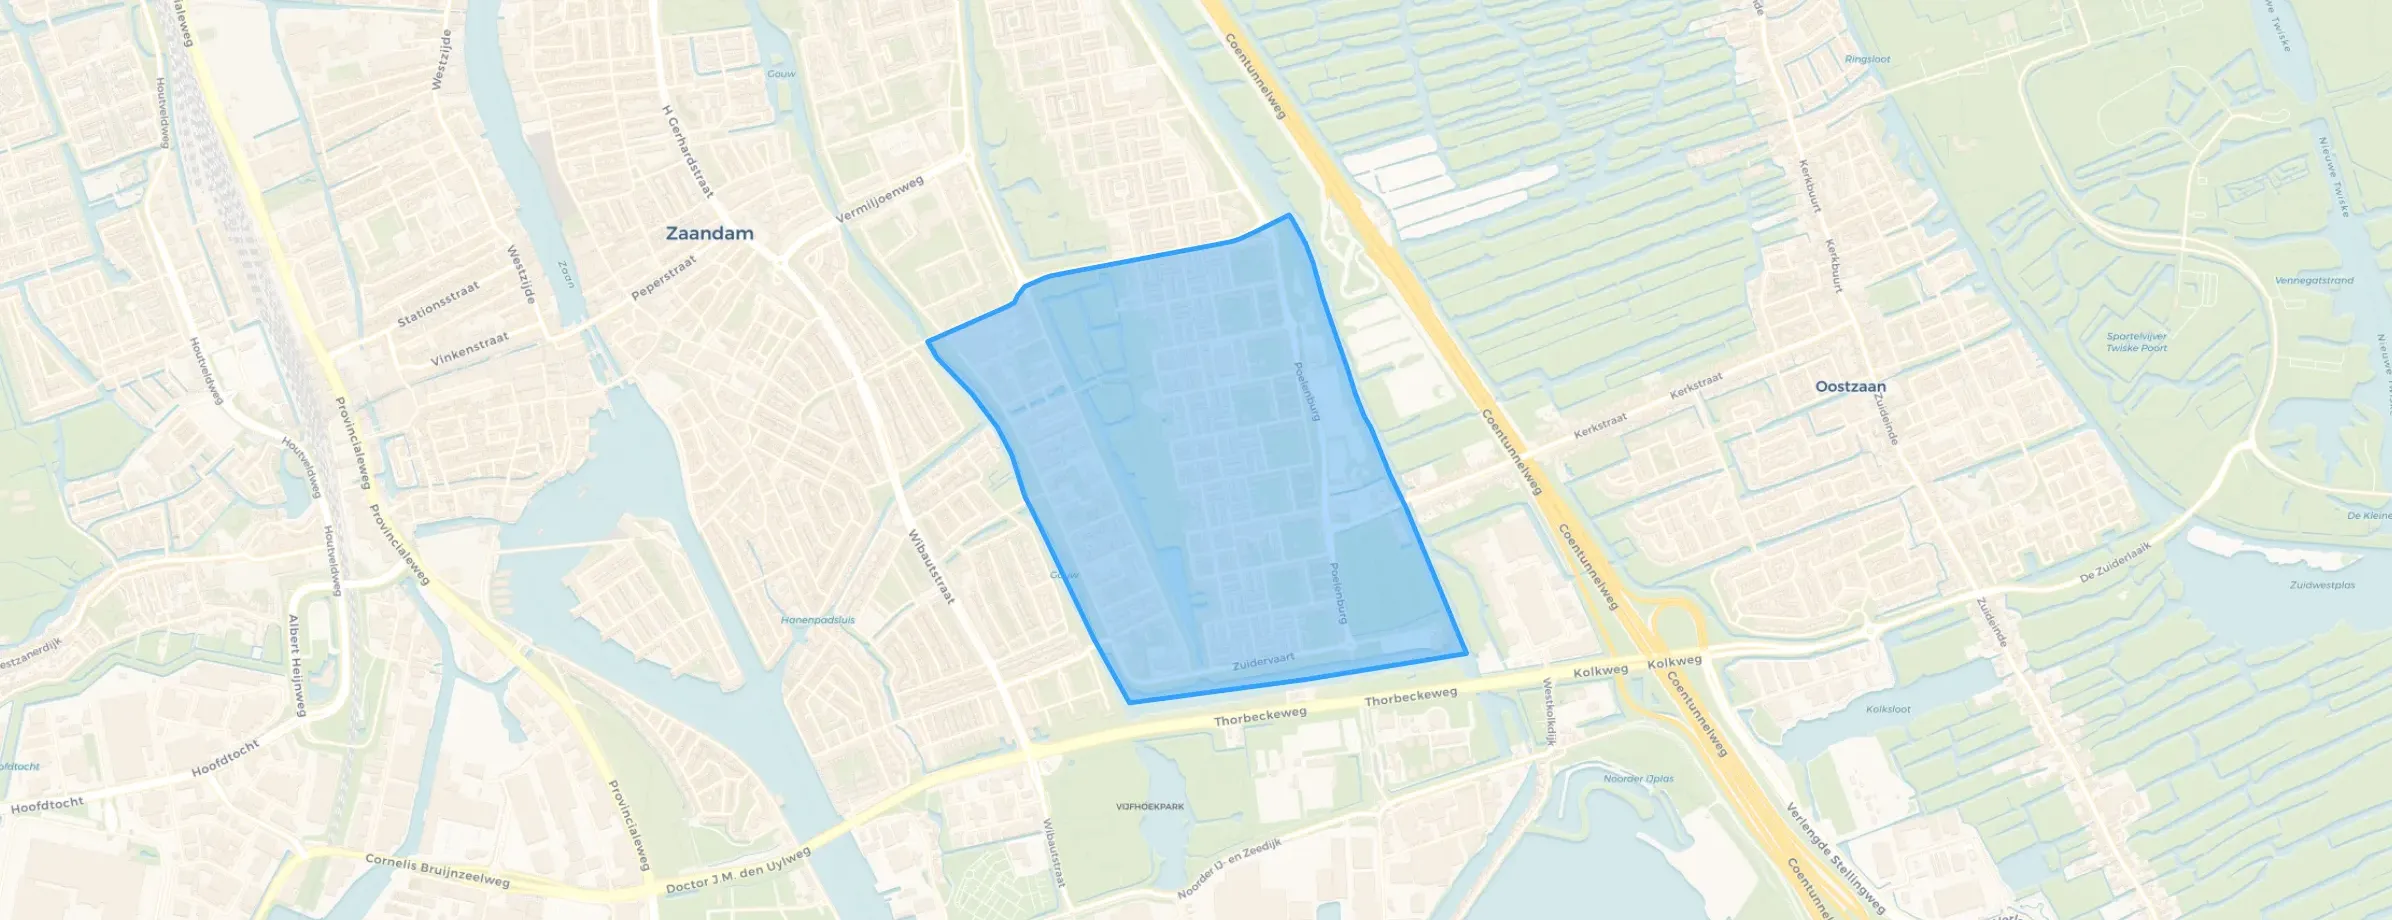
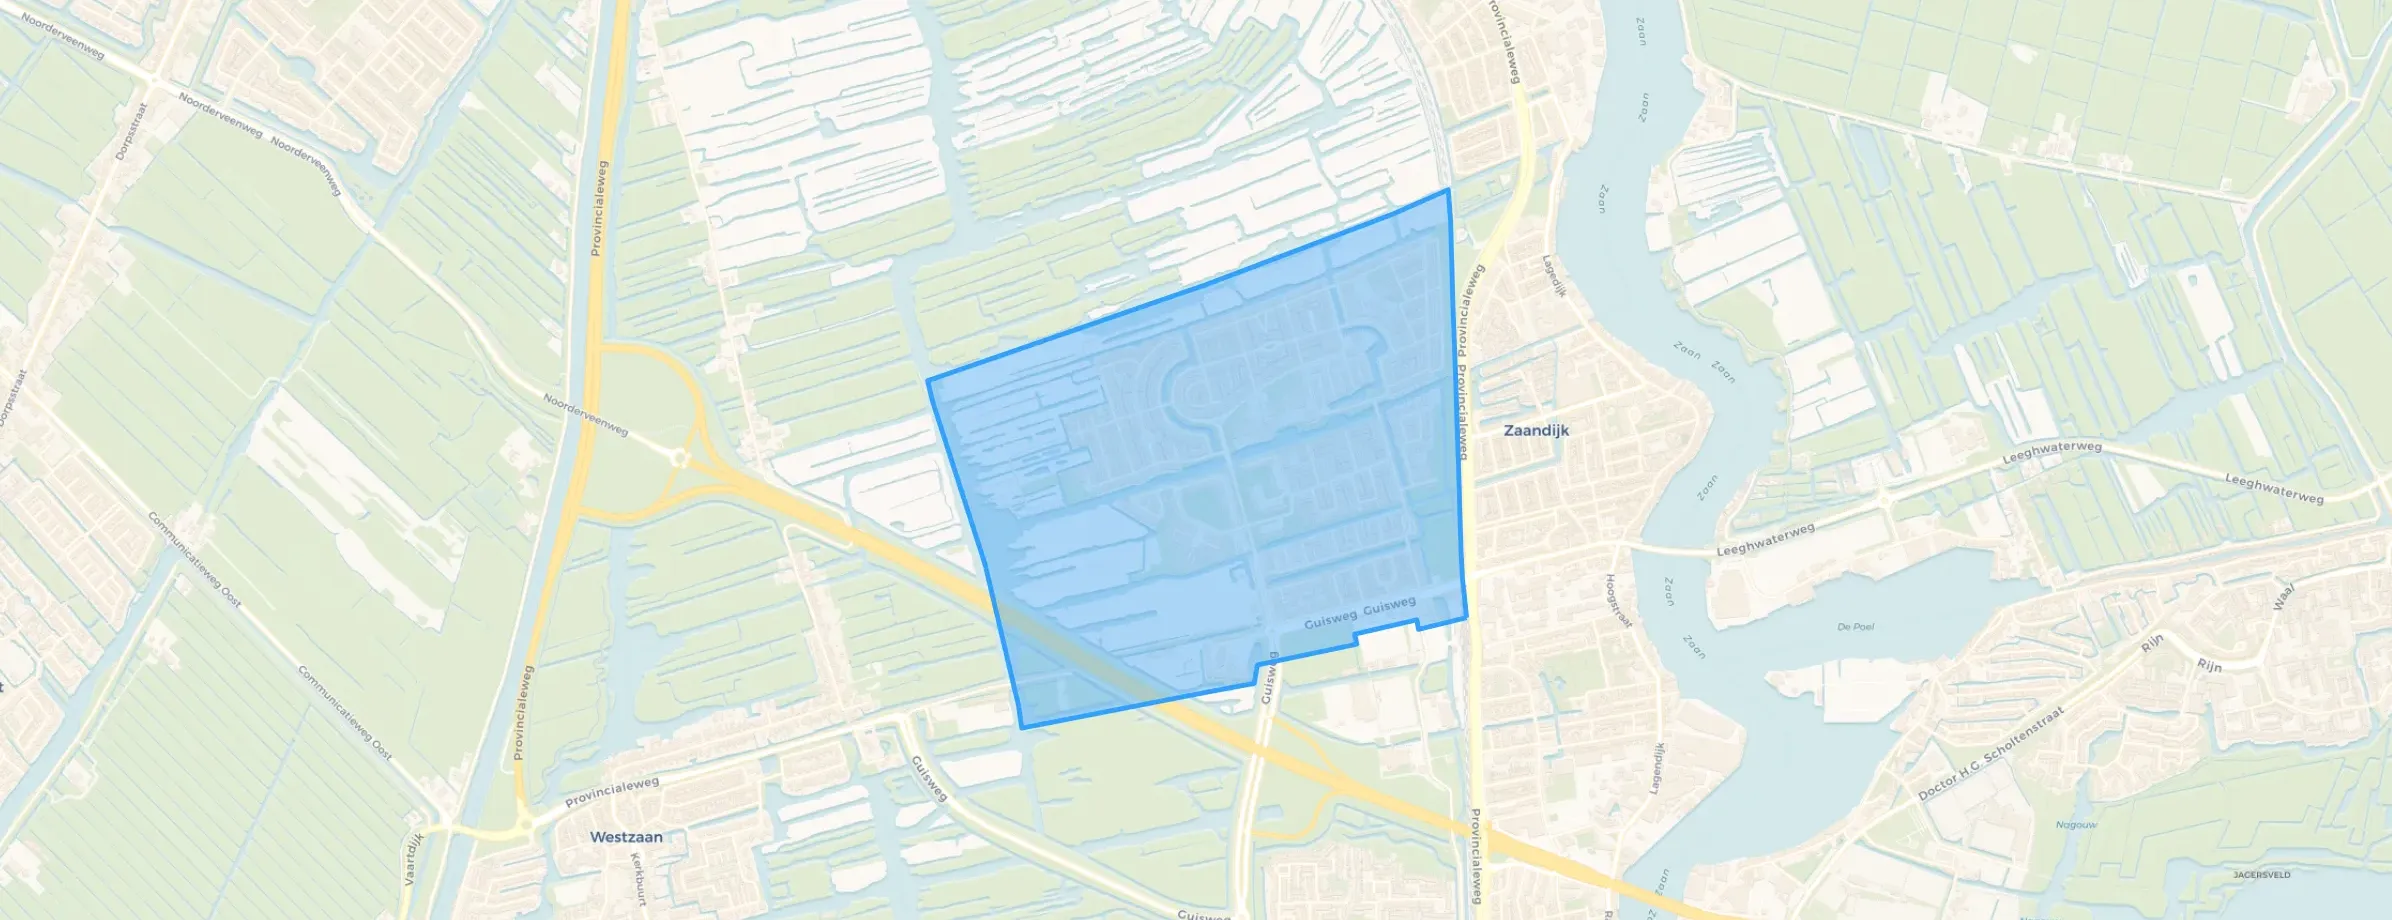

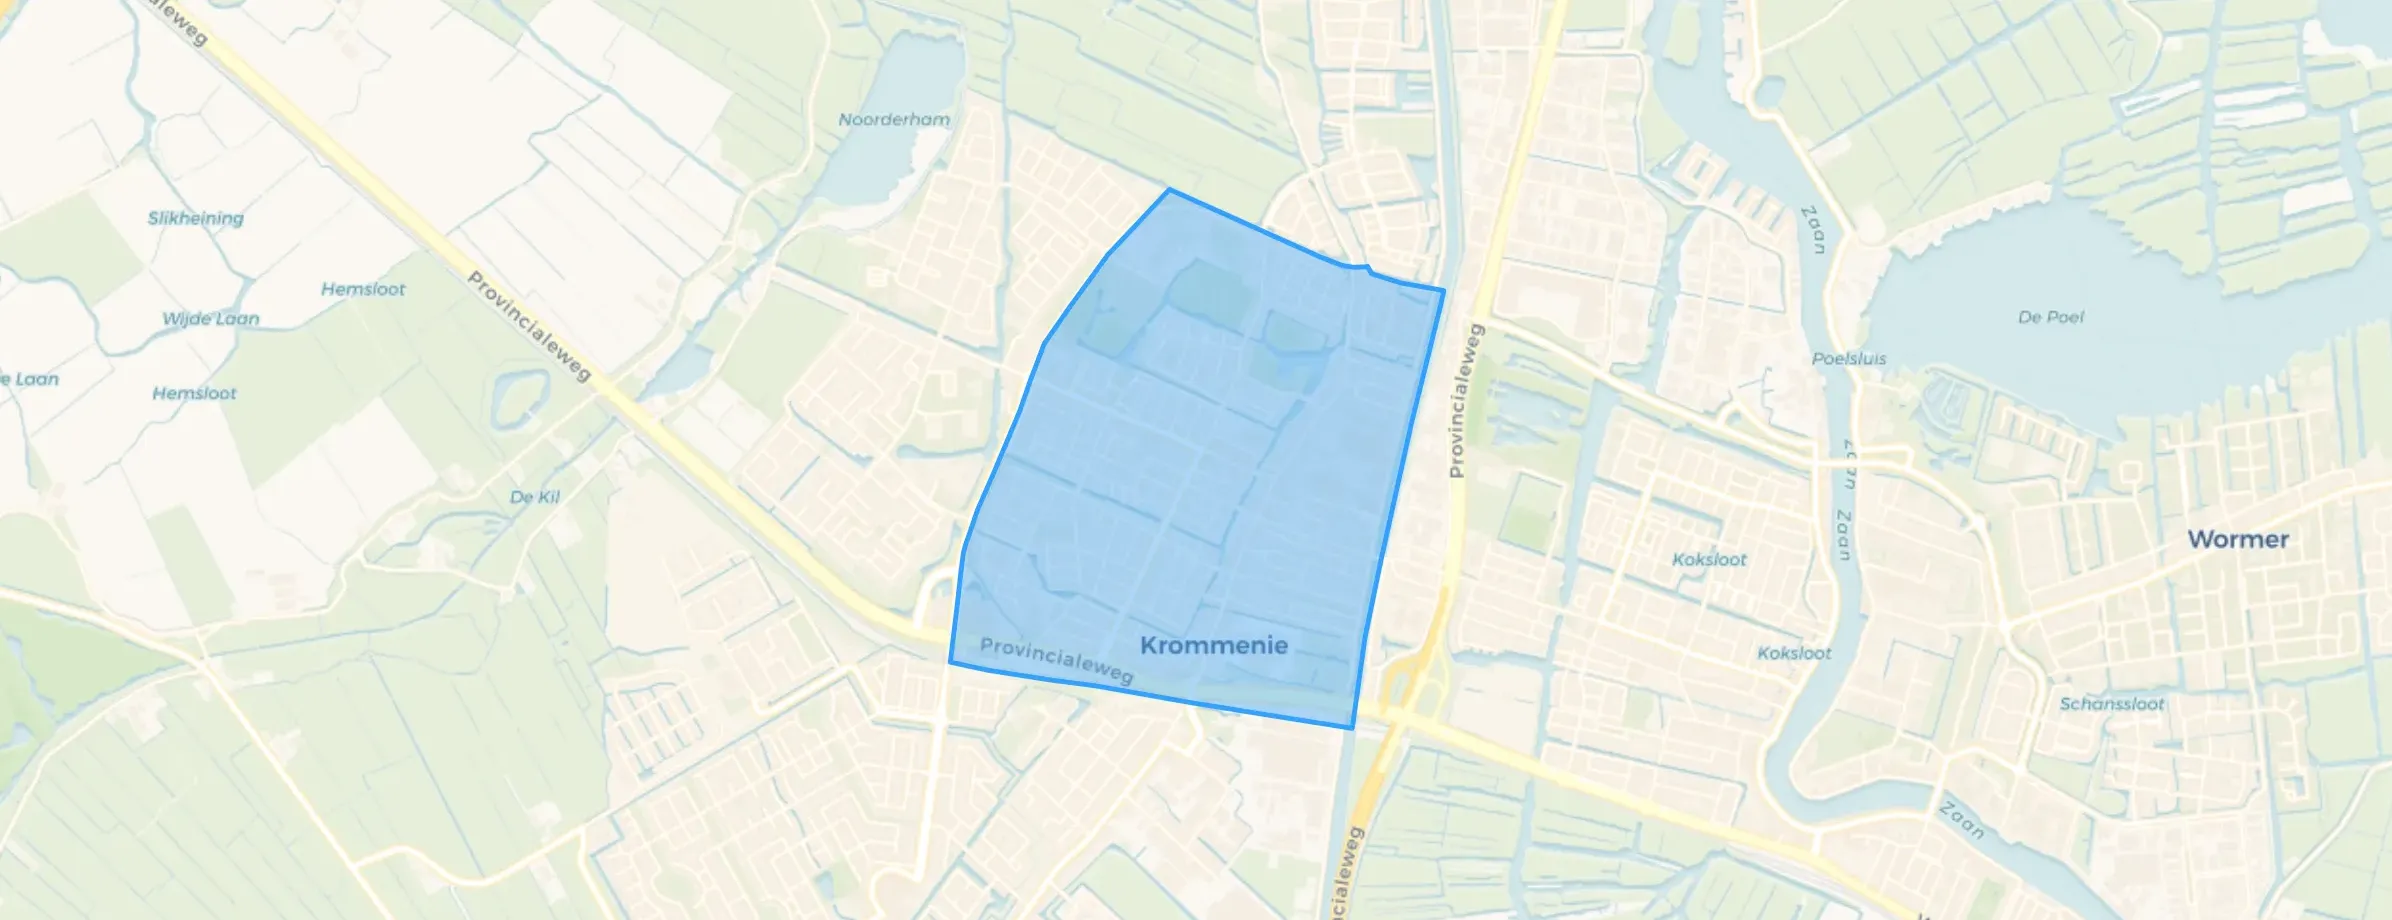


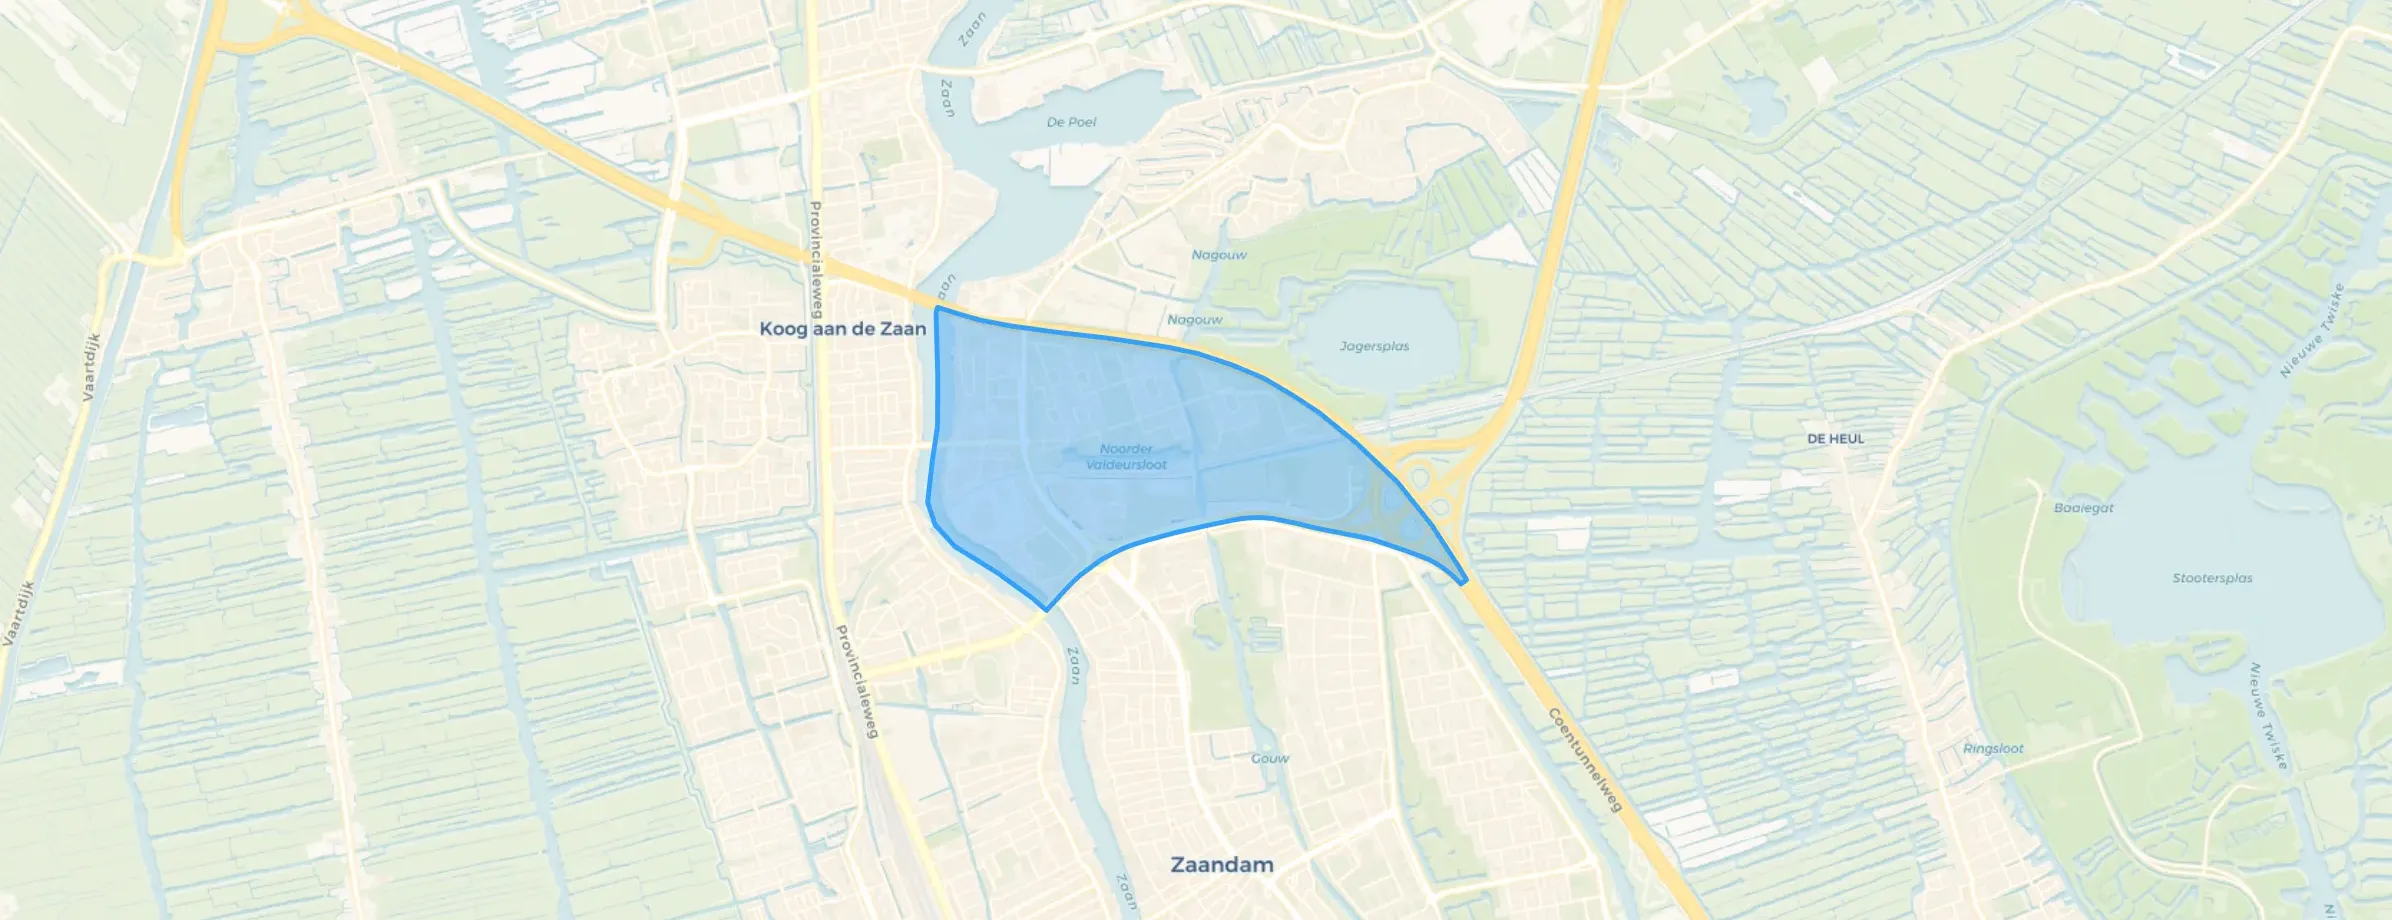

Living in Zaandam is like having a front-row seat to a modern Dutch fairy tale, but with a raw, industrial soul that keeps it grounded. While tourists at the station stare at the "Lego hotel", the magic for us locals lies in the quiet corners along the Zaan. The daily rhythm: in the morning you usually smell chocolate – really. Depending on the wind, the local cocoa factories (like ADM or Cargill) envelop the entire city in a warm, brownie-like scent. It's the ultimate "gezellige buurt" perk you won't find in travel guides. My favourite local spots: De Hemmes: This is my favourite "secret" spot. It's a small peninsula jutting into the Zaan. It's wild, industrial, and perfect for a sunset walk when you want to see the windmills of Zaanse Schans in the distance without the crowds of tourist buses. BIND: Located on the old Hembrug terrain, this is the heart of the community. It's an old transformer building turned into a living-room café. There's a wood stove, various rugs, and someone is always playing guitar or hosting a small art workshop. The 'Dam' (Zaandam-style): On Friday nights we go to the square by the lock. It's much more intimate than Dam Square in Amsterdam. Sitting at Wonder's or Manzo's with a beer, watching the boats sail through the Wilhelminasluis, is how we truly unwind.
Auto-translated to English by AIDaily nuisance from cockroaches moroccans, this neighbourhood has changed into an antisocial abdoela neighbourhood since 4 years.
Auto-translated to English by AIThe rest of Assendelft is difficult to reach, the neighbourhood bus only runs once an hour between 9 and 18, but otherwise it's very pleasant living here. All amenities are available, many schools, greenery.
Auto-translated to English by AINo contact with neighbours, used to have New neighbours
Auto-translated to English by AINice people who leave each other alone, but you can always turn to them when needed...
Auto-translated to English by AIReasonable, but compared to 20 years ago. Too busy with traffic.
Auto-translated to English by AIMy feeling says that people should be nicer to each other, keep the neighbourhood tidy, and there should be less nuisance in the flat. And people can help each other to keep it tidy too.
Auto-translated to English by AIA cosy neighbourhood with lots of greenery. Unfortunately, many homes have mould and there are many loitering youths in the area. This affects safety.
Auto-translated to English by AI
The most common type is flats (41%).
Over the past year a home for sale in Zaanstad was listed for an average of €460,392 (€4,534 per m²).
A rental home in Zaanstad cost an average of €1,771 per month (€21 per m²).
Residents give Zaanstad a 7.2 out of 10 based on 57 reviews. Especially safety (8.2) scores well; cleanliness (7.1) receives the lowest rating.
Gemeente Zaanstad has 161,389 residents. Many families: 36% of the households have children.
The housing supply in Zaanstad is remarkably efficient: 54% has an A, A+ or B label. The average natural gas consumption per household is 920 m³ per year.
From Zaanstad you can on average reach a supermarket at 0.7 km, a GP at 0.9 km, a railway station at 2.2 km, a primary school at 0.8 km (as the crow flies, source: CBS).
Right now you will find 852 homes for sale and 158 homes for rent in Zaanstad.

Buurtje.nl uses cookies to make the site work and to improve it. In doing so, we process data such as your IP address and the pages you visit.
We use this data for three purposes: running the website (functional), measuring visits so we can improve Buurtje.nl (analytics), and — if you allow it — tailoring ads to your interests (marketing).
How we handle your data is described in our privacy policy. You can change your preferences at any time via 'Cookie preferences' at the bottom of every page.
Choose per category which cookies we may place. Read more in our privacy policy.