District in Oss
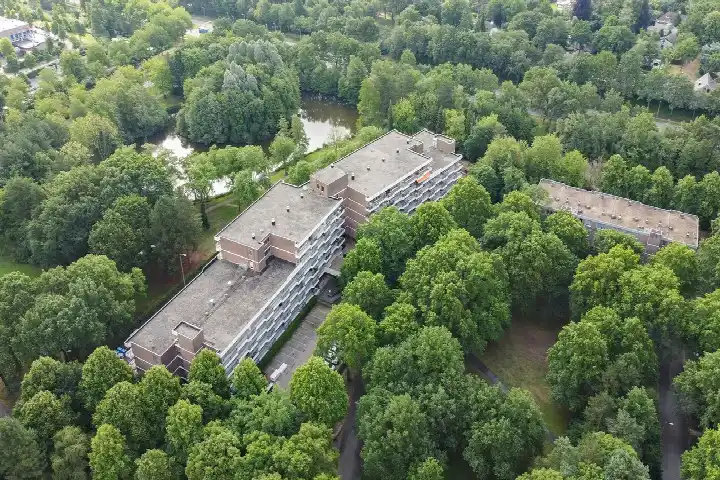
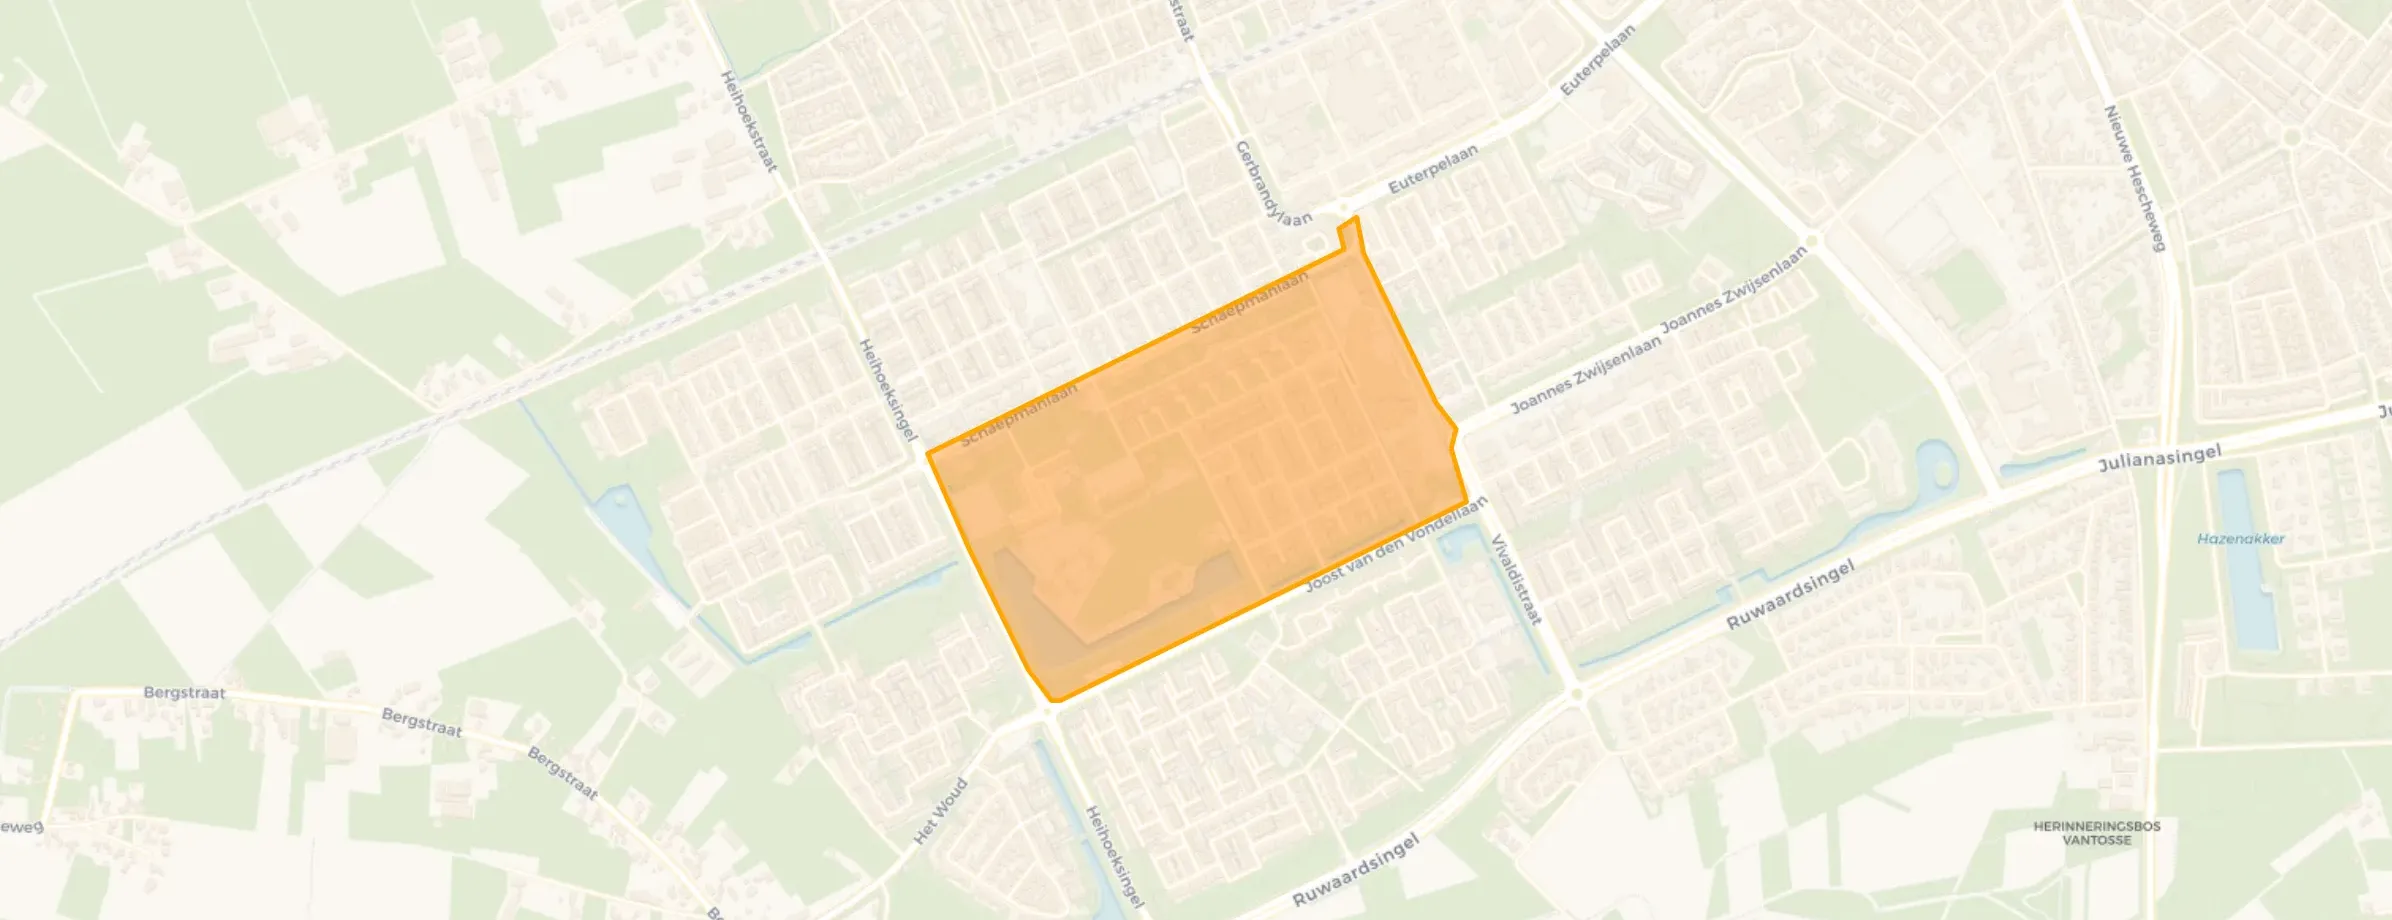
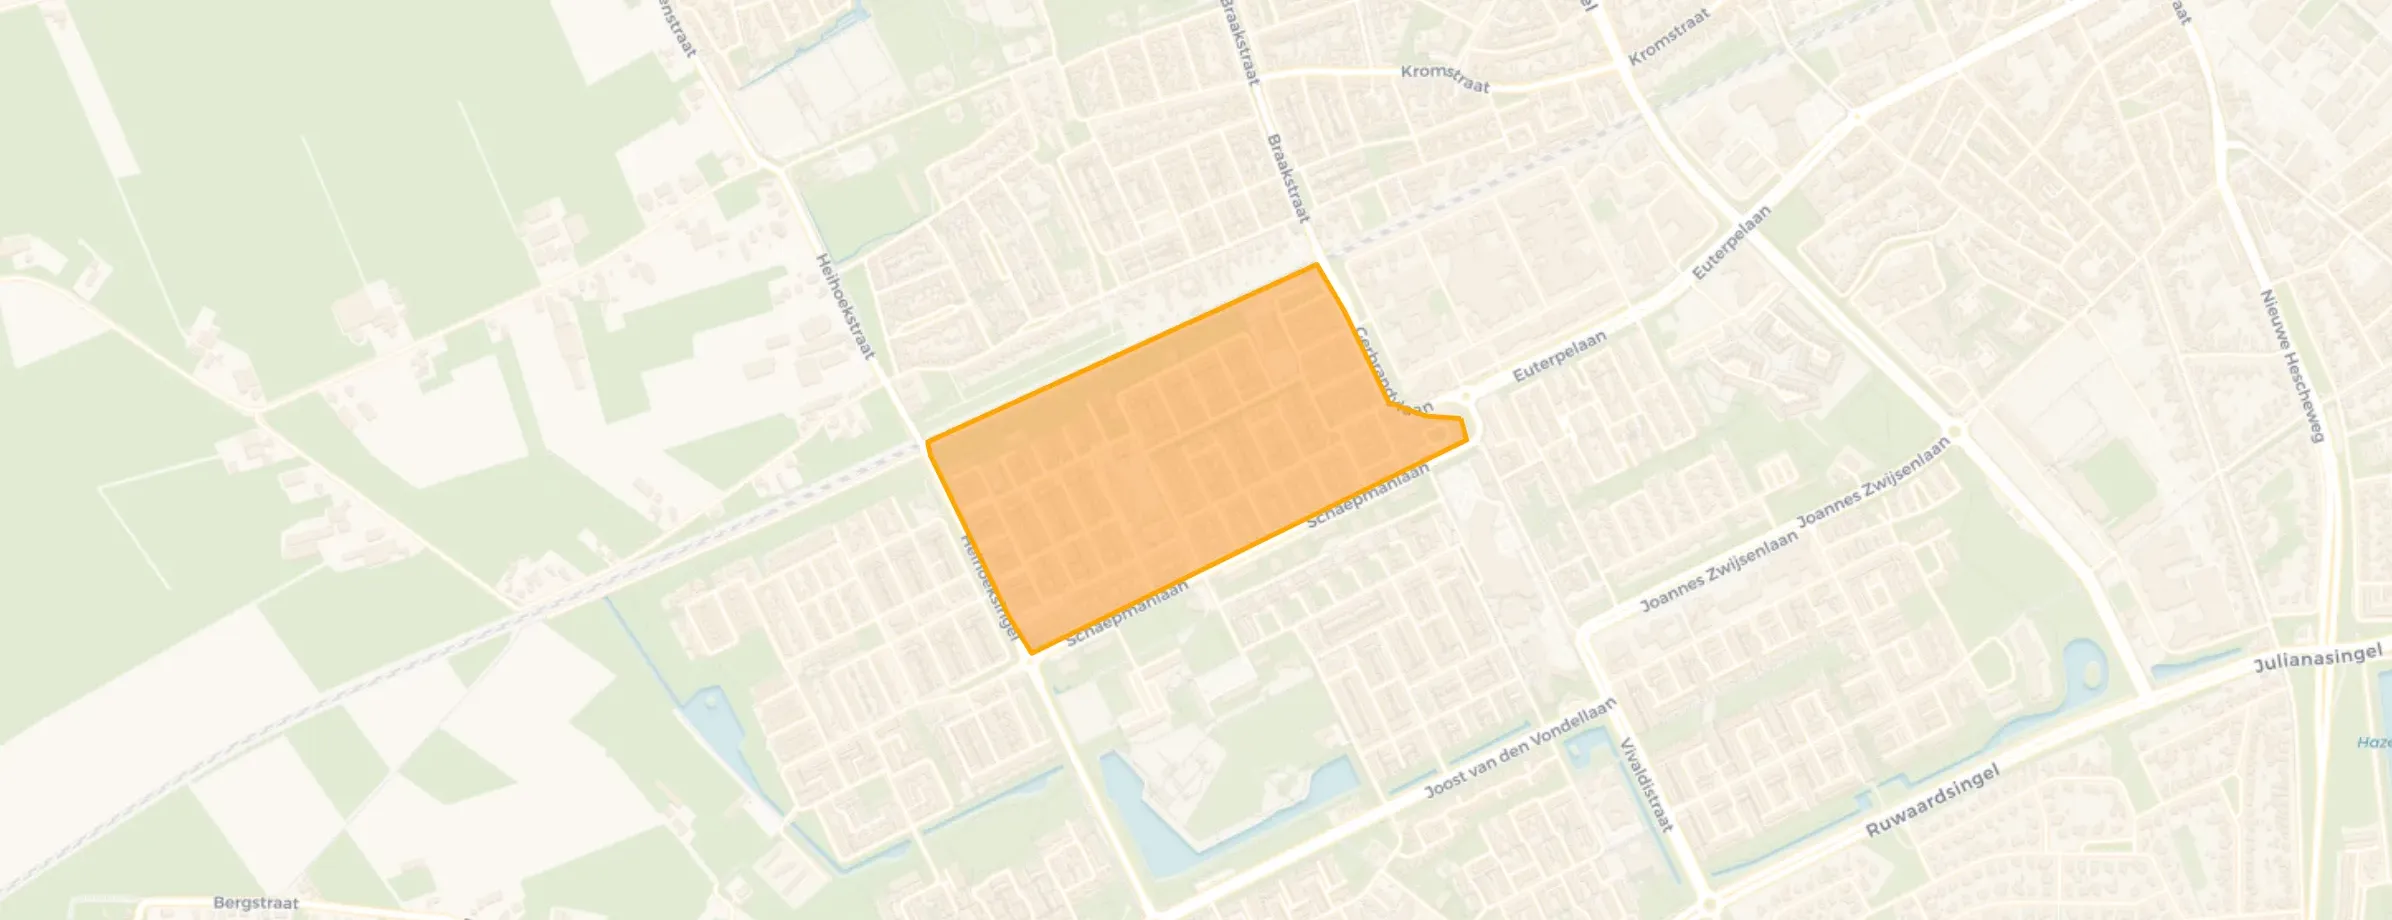
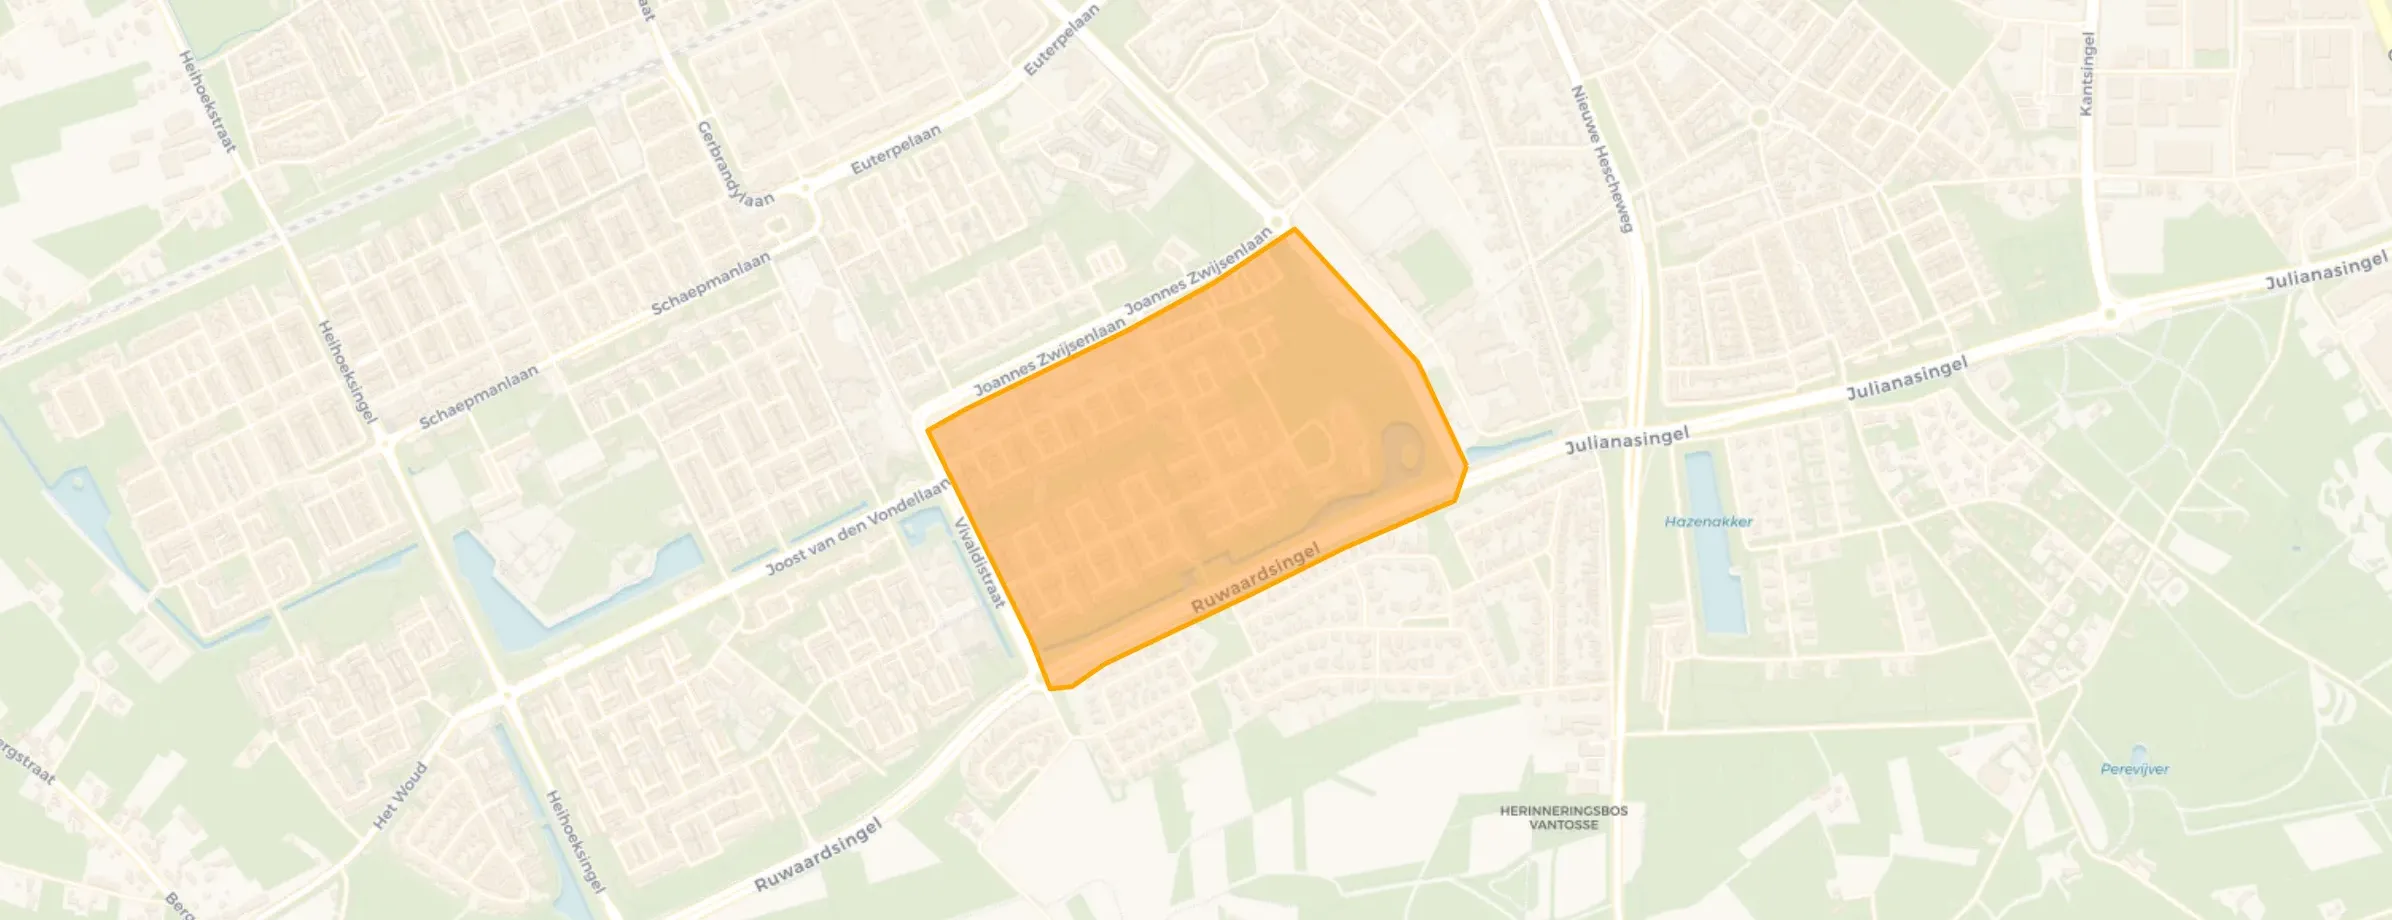
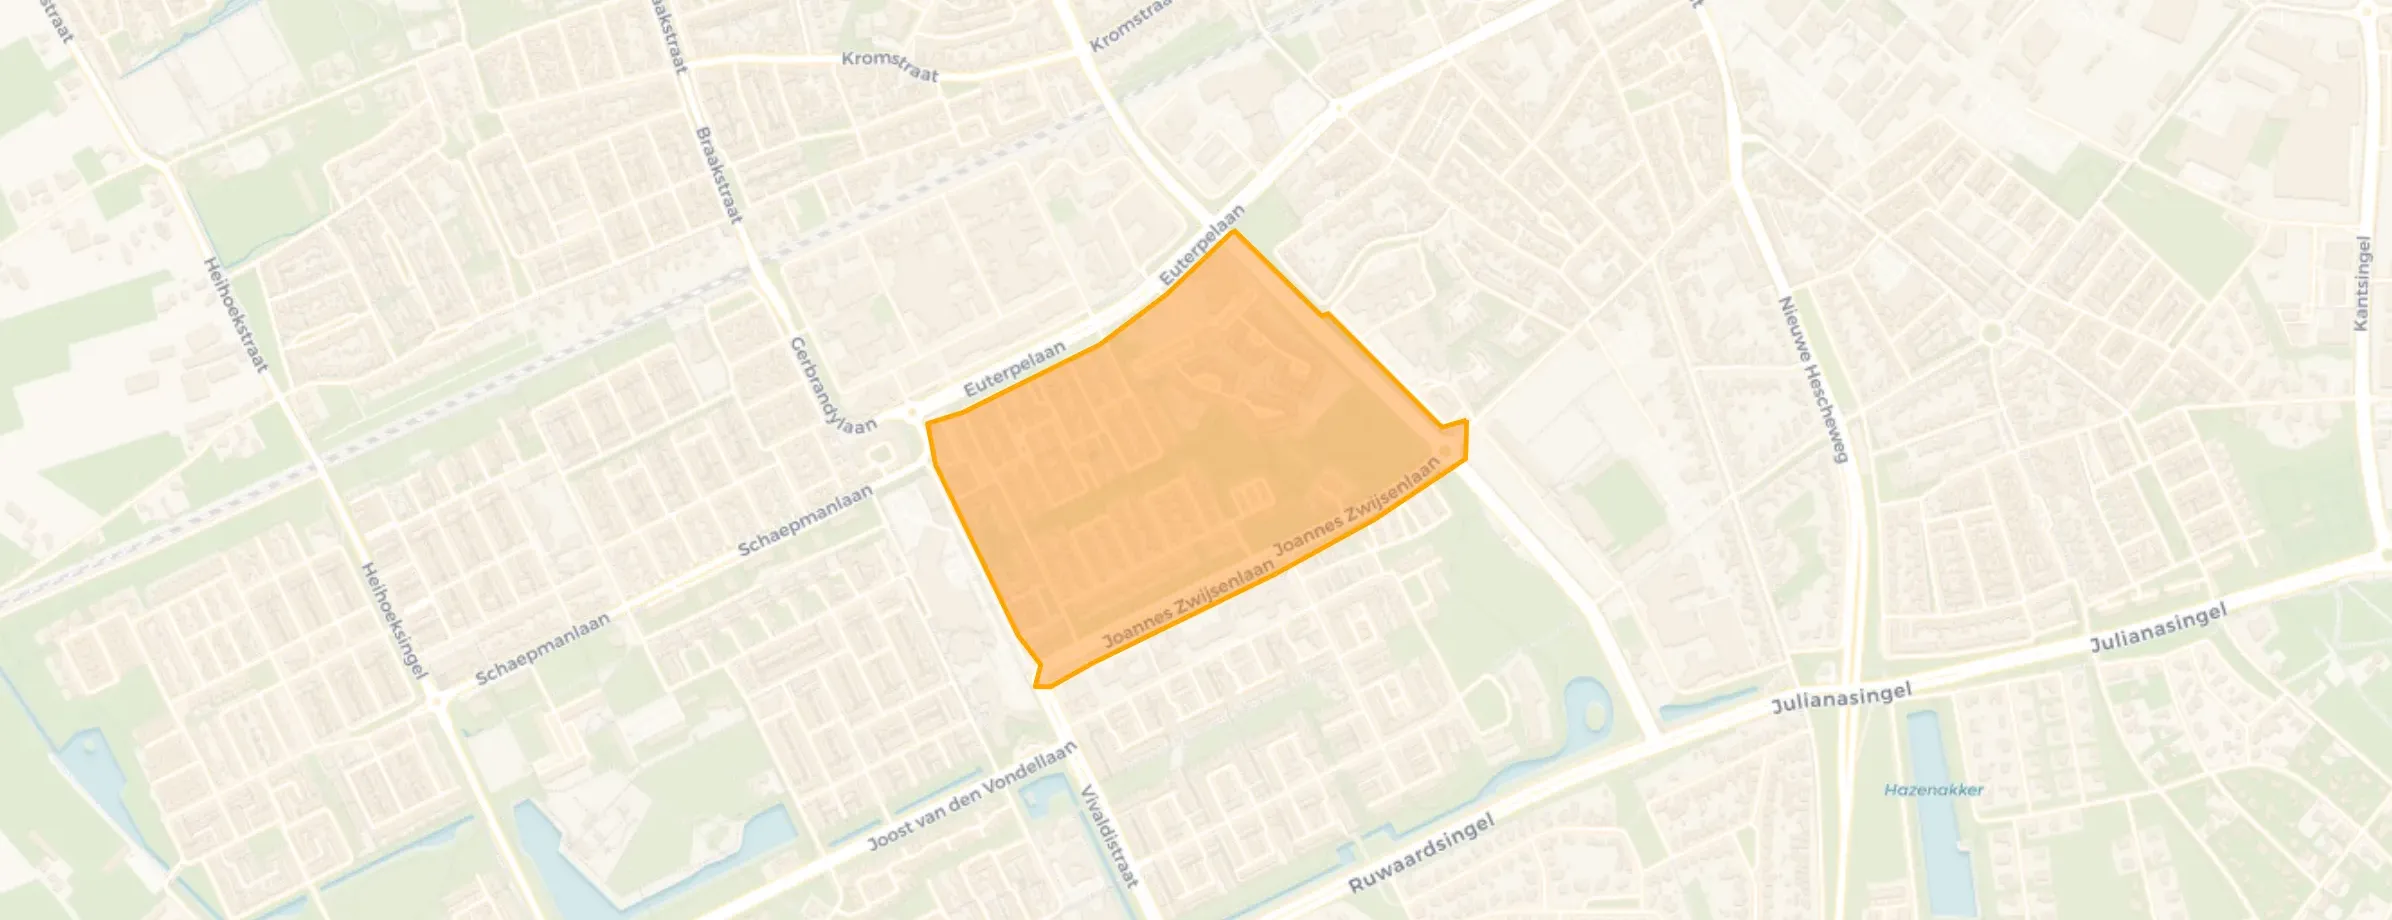
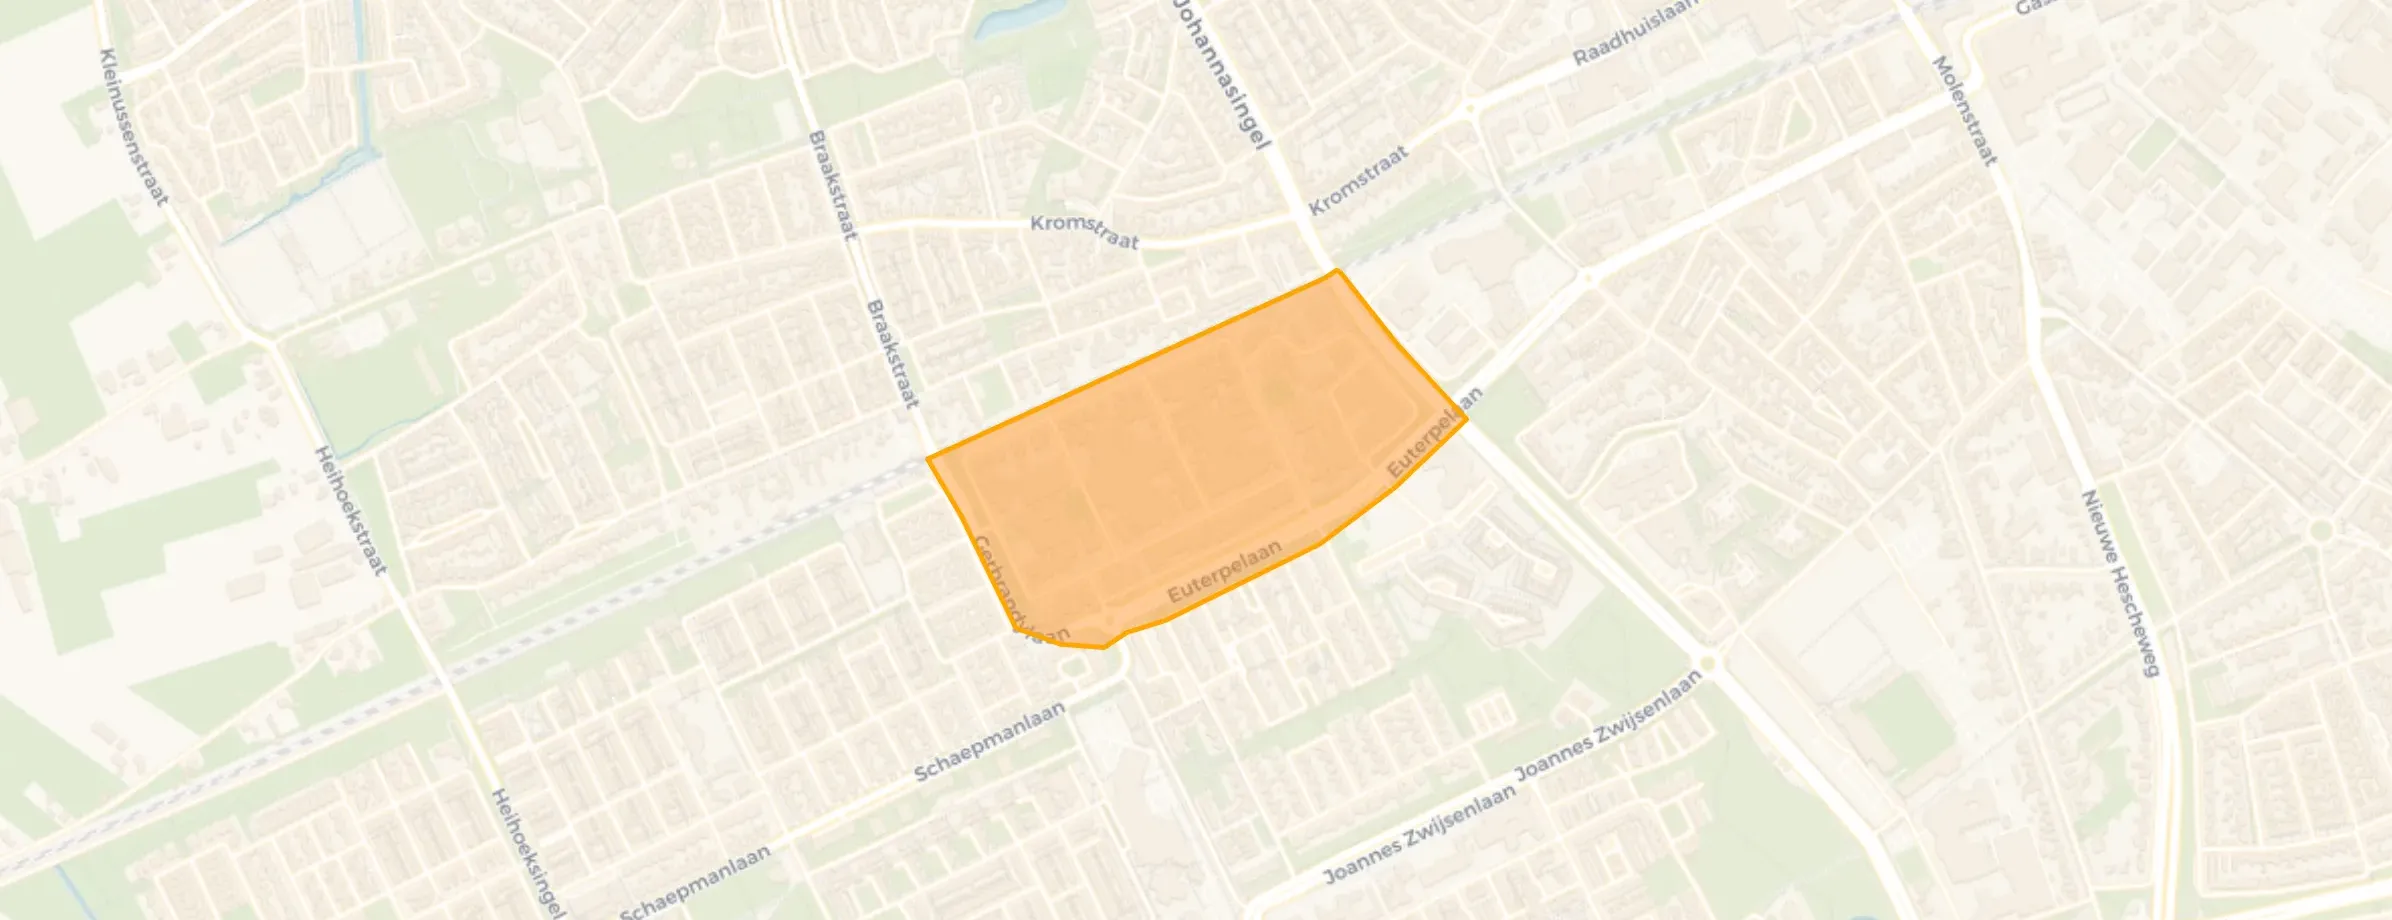
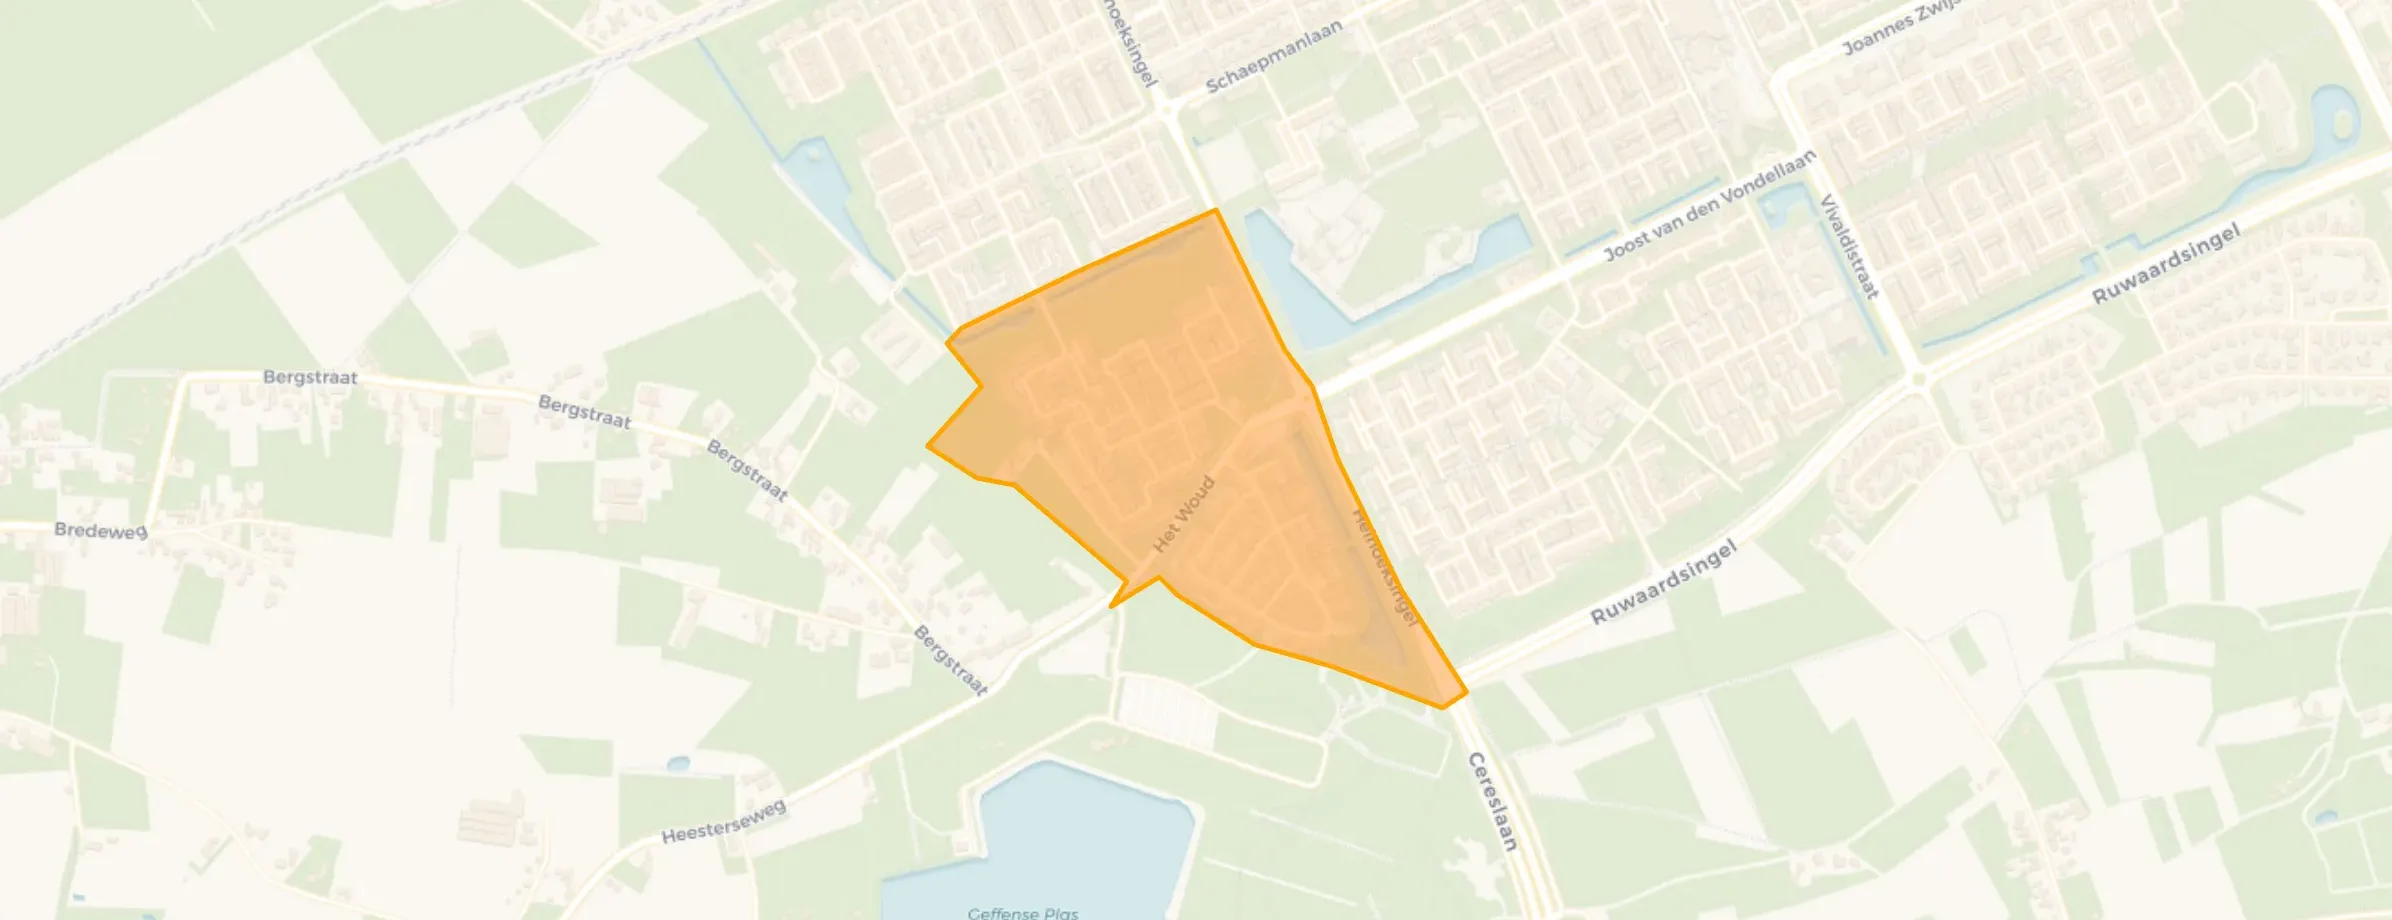
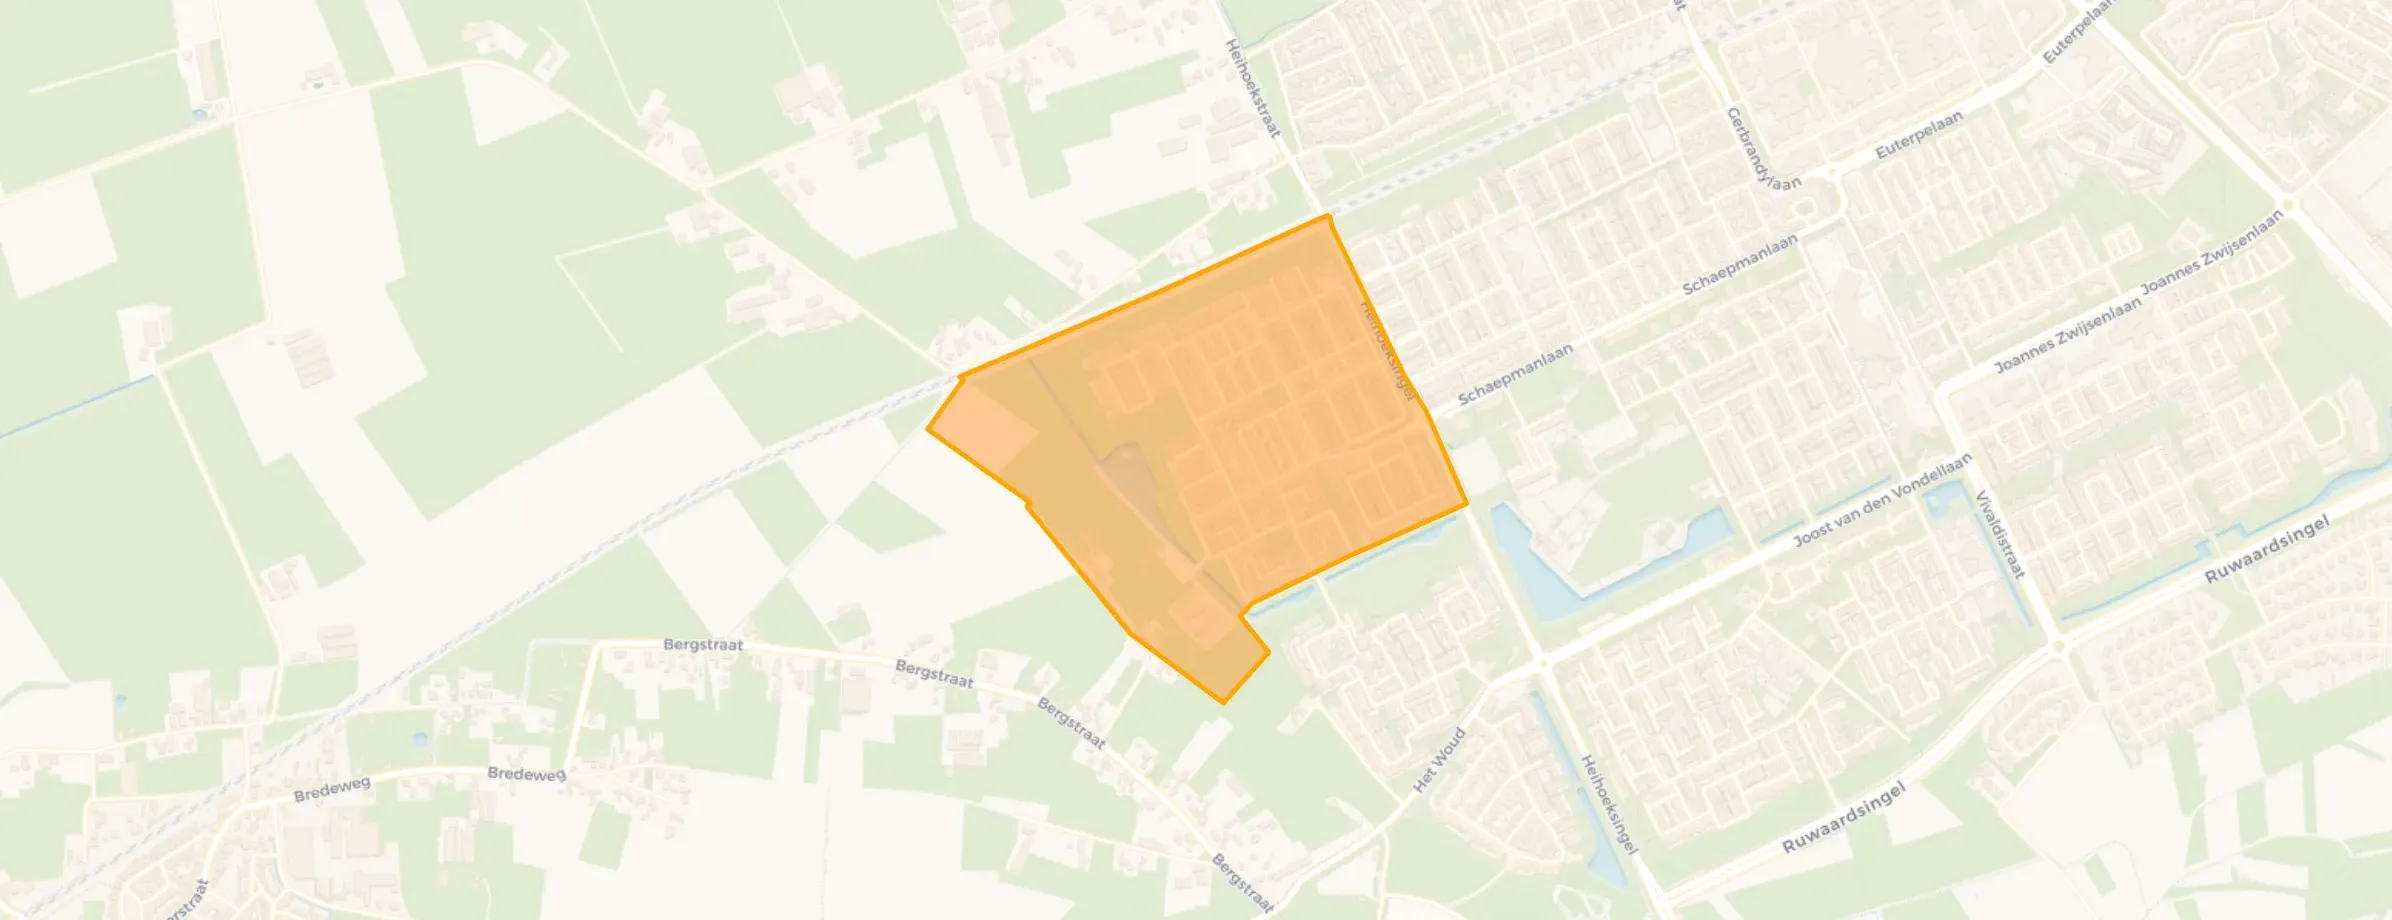
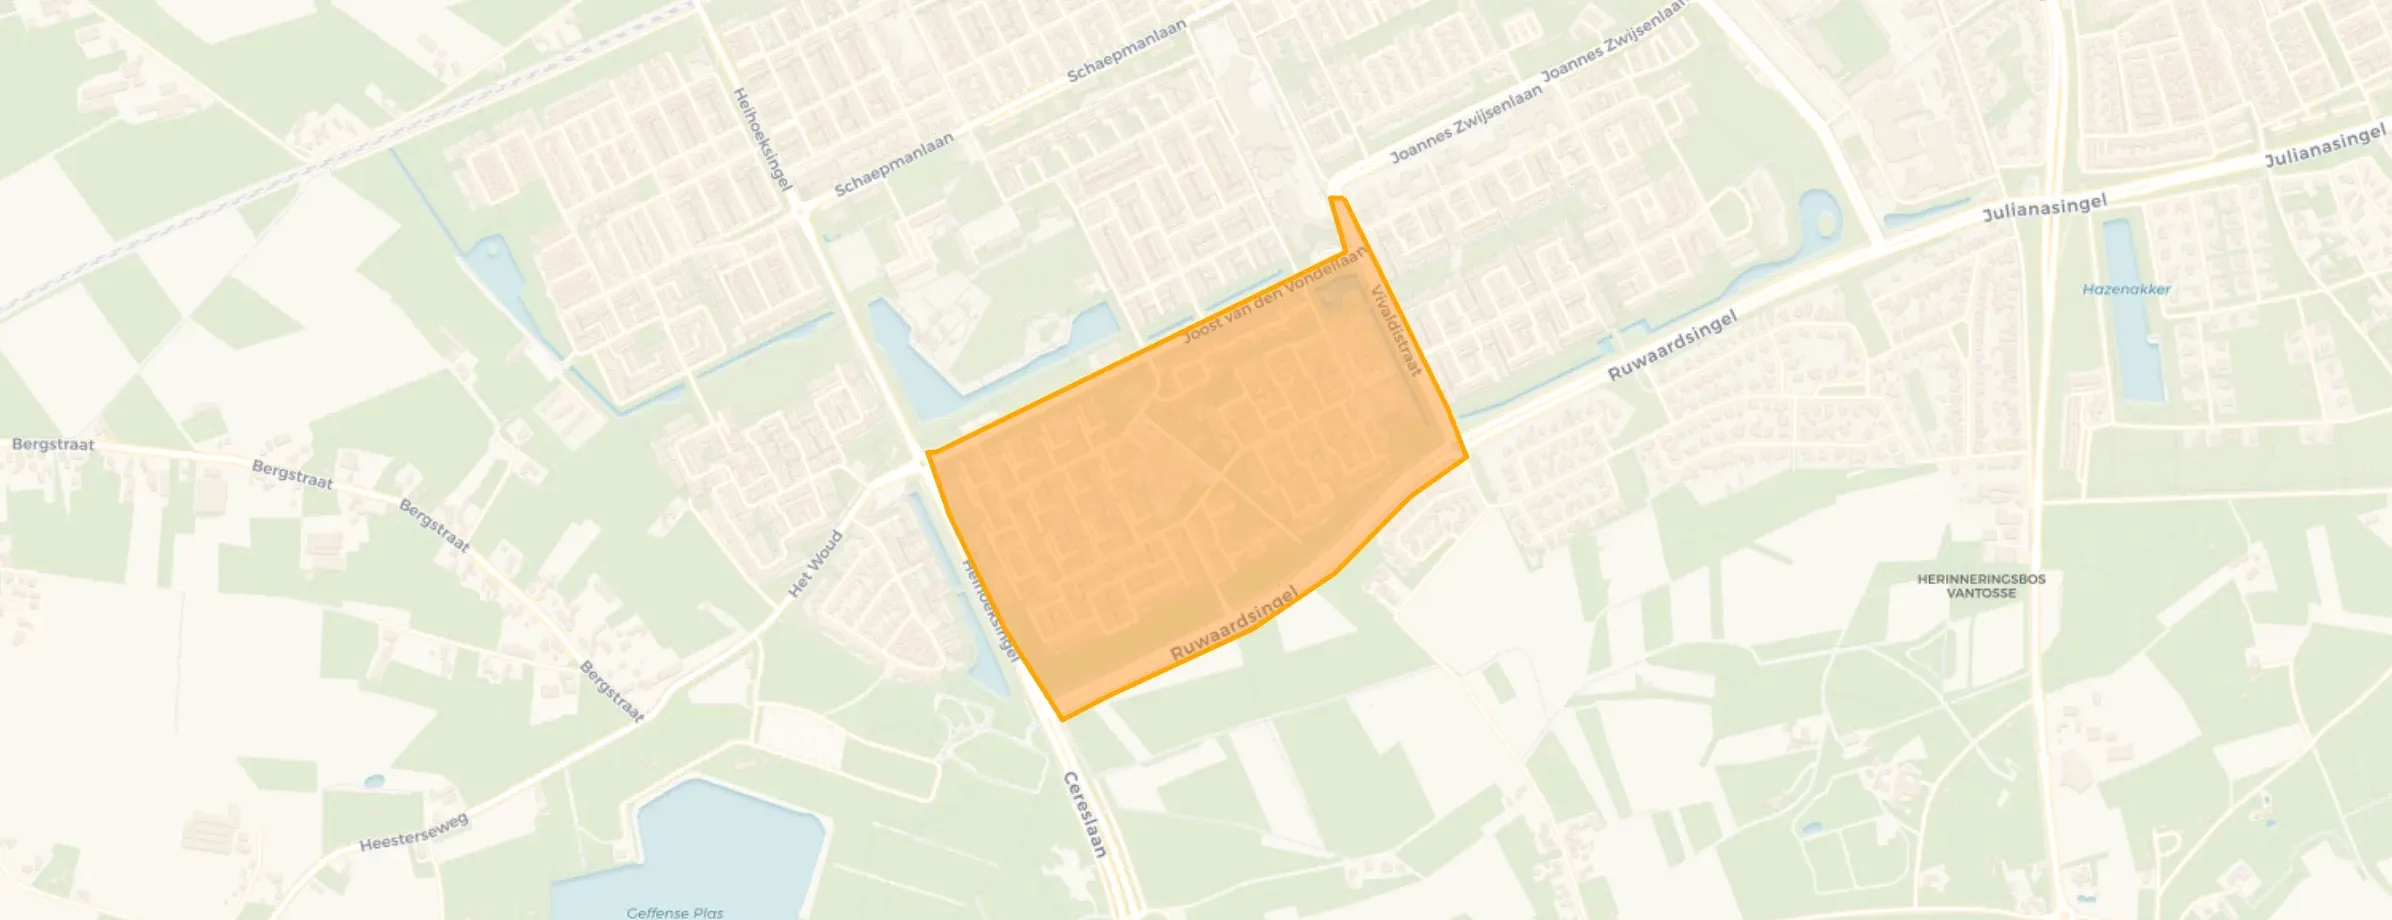
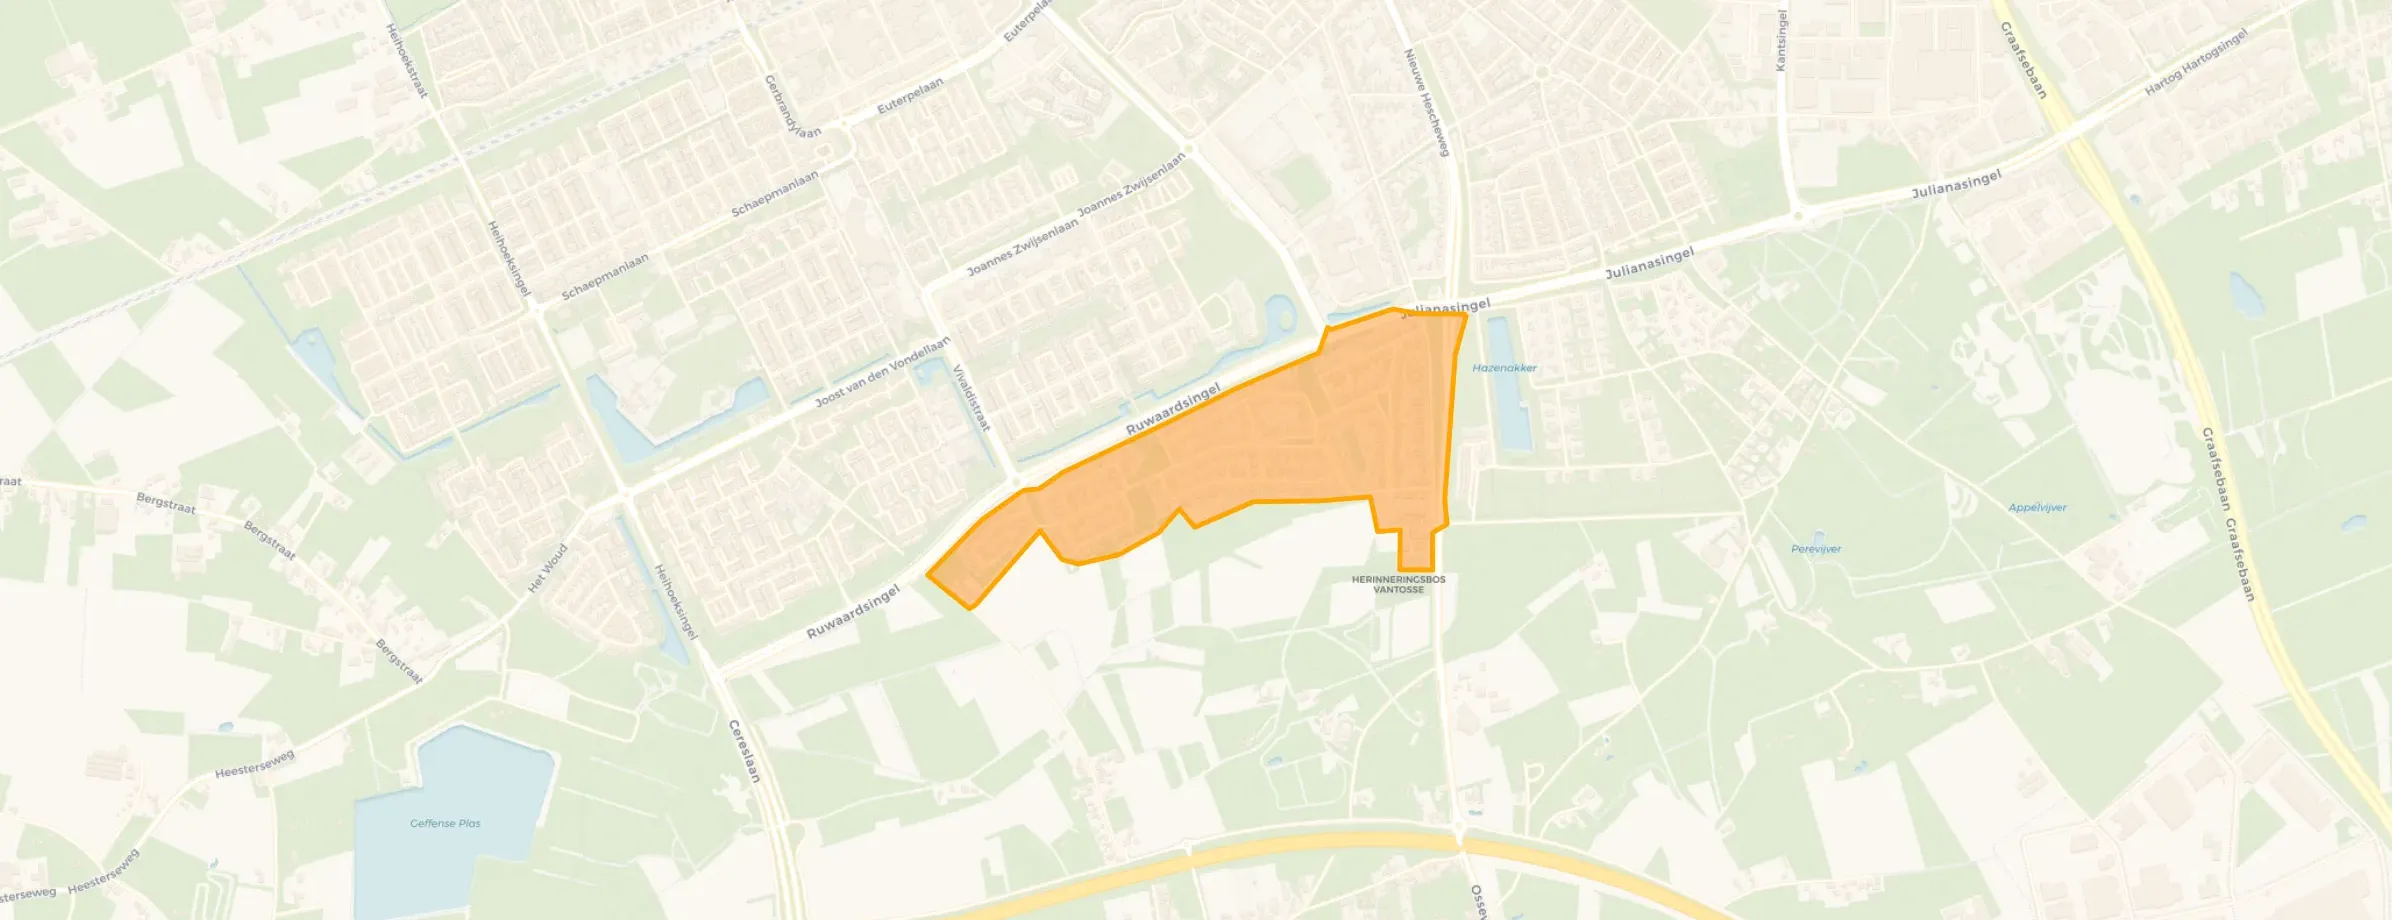
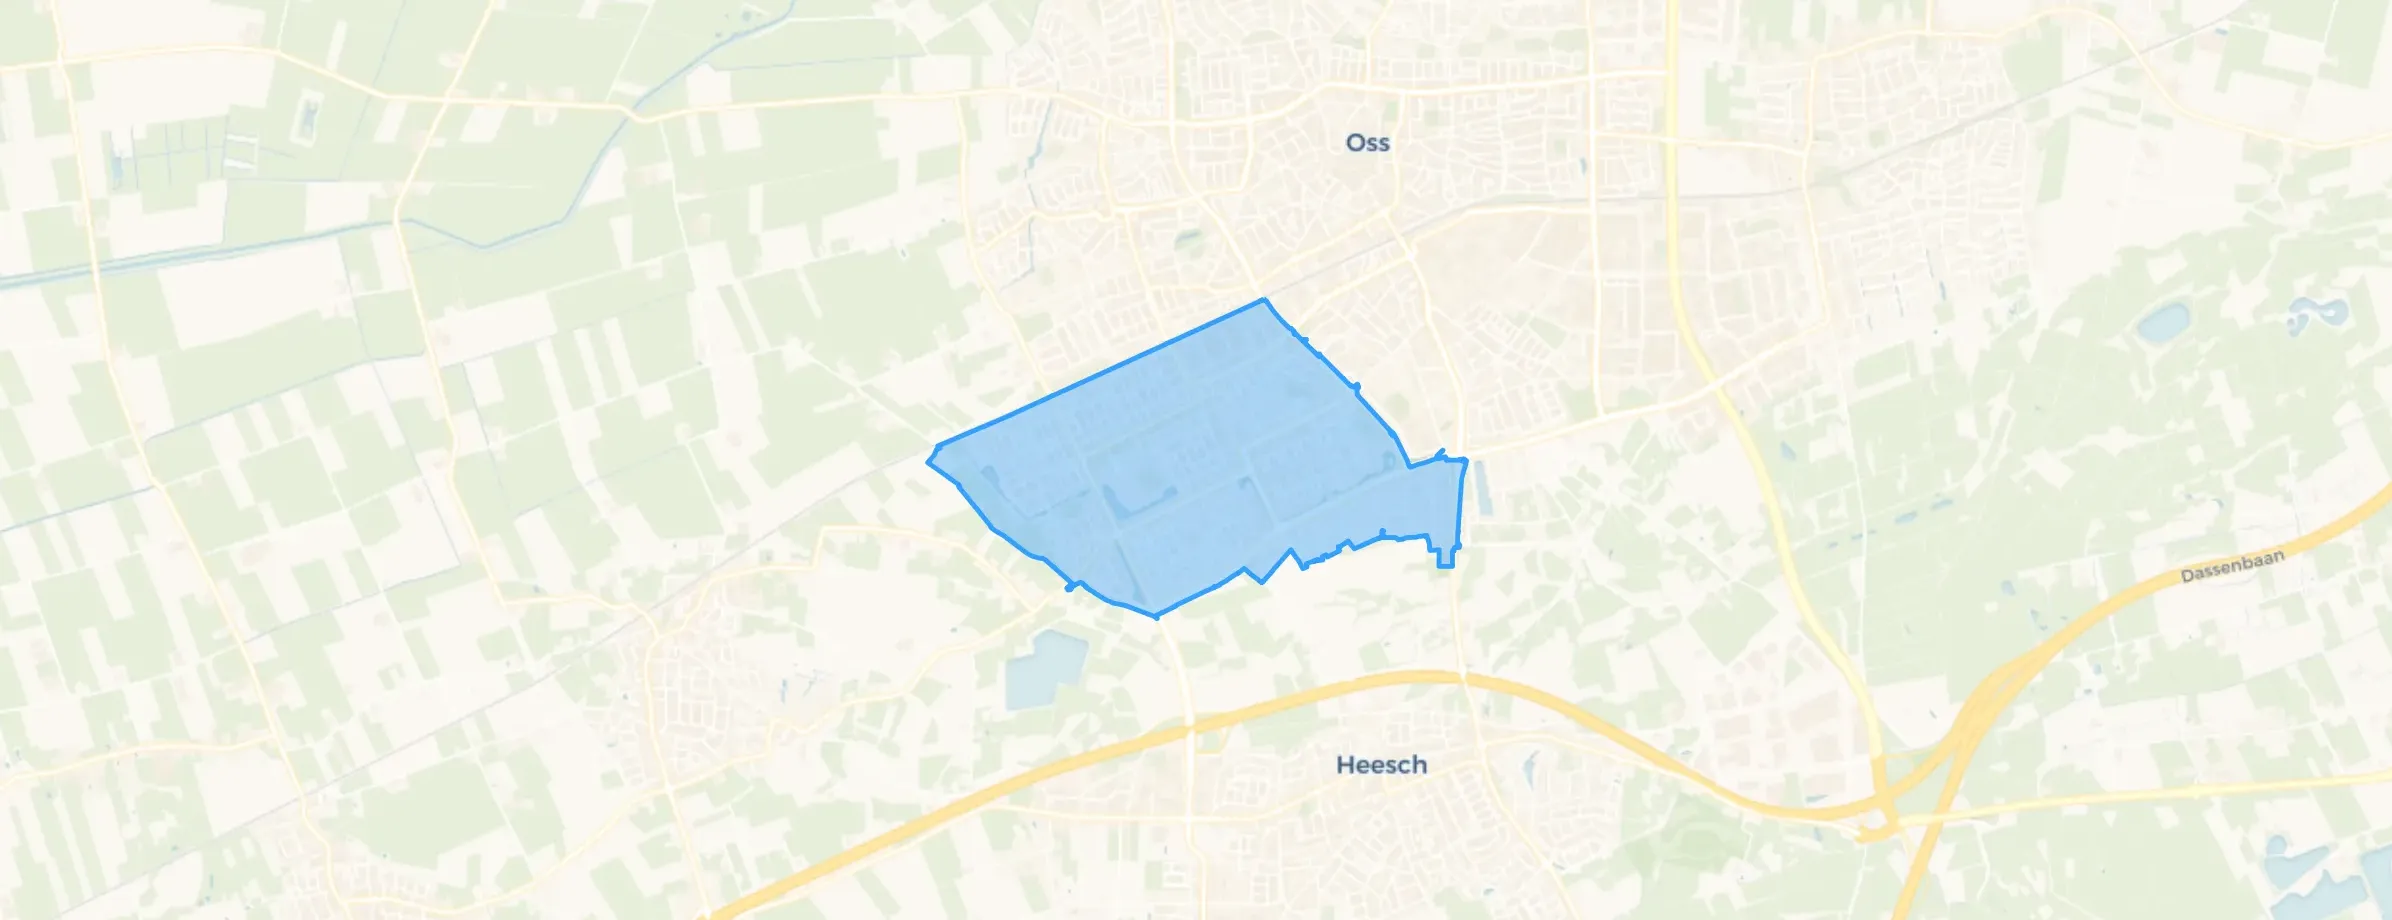
Ruwaard is located in the province of Noord-Brabant, in the municipality of Oss The district has a total area of 356 hectares, of which 350 hectares are land and 6 hectares are water. The district is coded as WK082806. The postcode area is 5343AA-5344XL.
Ruwaard has 13.700 residents. Of these, 50,4% are men and 49,6% are women. Most residents are 25 to 45 years (25,8%). The other age groups are 25,3% for '45 to 65 years', 22,7% for '65 years or older', 14,5% for '0 to 15 years' and 11,7% for '15 to 25 years'. Of the residents, 46,5% is unmarried, 38,4% is married, 9,5% is divorced and 5,7% is widowed. 8.165 residents originate from the Netherlands, 1.890 come from Europe and 3.645 come from countries outside Europe.
There are 6.420 households in Ruwaard. 40,4% of these are single-person households, 27,7% households without children and 31,9% households with children. The average household size is 2,1 persons. The national average is 2,1 persons.
In Ruwaard there are 11.100 income recipients. The average income per income recipient is €35.700, which is €6.500 (15%) lower than the national average of €42.200. Per resident, the average income is €29.700, which is €5.200 (15%) lower than the national average of €34.900. Most residents of Ruwaard are educated to an intermediate level. 42,2% have an intermediate education (HAVO, VWO or MBO 2-4), 34,0% have a lower education (VMBO or MBO 1) and 23,8% have a university or higher professional education (HBO/WO).
Of the 13.700 residents, around 67% are in paid employment, which amounts to 9.179 people. This is 5% lower than the national average of 72%. The majority of workers are in salaried employment (85%), while 15% are self-employed. In Ruwaard, 32% of residents receive a benefit. The largest group is those receiving a state pension (AOW). 2.780 people receive this benefit.
In Ruwaard there are 6.292 homes with an average assessed value (WOZ) of €320.000. Of these, around 97% are occupied and 3% unoccupied. In Ruwaard there are roughly as many rental as owner-occupied homes. This amounts to 48% rental homes and 52% owner-occupied homes. Of the homes, 52% privately owned, 37% owned by housing associations and 11% owned by other landlords. The most common construction periods in Ruwaard are 1970-1980 (56%) and 1950-1970 (23%).
There are currently no homes for sale in Ruwaard. The most recently listed home is Van Karnebeekstraat 12 by Joep Makelaardij op Funda. No homes were sold in Ruwaard over the past year.
There are currently no homes for rent in Ruwaard. The most recent home is Schaepmanlaan 538, offered by www.thuispoort.nl. No homes were let in Ruwaard over the past year.
No recent rental data available for Ruwaard.
In Ruwaard there are 4.419 addresses with a registered energy label. The most common labels are A (39%), C (21%) and B (16%). On average, an address in Ruwaard uses 2.530 kWh of electricity per year. This is 1% below the national average of 2.550 kWh. Natural gas consumption, at 870 m³ per year, is 9% above the national average of 800 m³.
Quiet neighbourhood close to public transport and easily accessible via the motorways. In addition, shops and schools are nearby.
Auto-translated to English by AINo contact with people 80 percent foreign can't understand foreign children on fatbikes life-threatening don't look at anything ever with 3 people on a bike
Auto-translated to English by AIMore foreigners than Dutch people managing. They don't speak the language. They think they can do everything. You can't make small talk with anyone because we can't understand each other. They ride fatbikes all day, also on footpaths or where small children play.
Auto-translated to English by AII've been living in Oss in the Ruwaard district for a while now. I like that all kinds of different people live here. I often walk the dog and notice that everyone is very friendly. Sometimes you come across people you don't know or who give you a strange feeling (but you get that everywhere). There was a period when there were a lot of burglaries, fortunately not at our place (dogs). Within a short distance there are enough shops and the city centre is not far either. I would like to see more green spaces in the neighbourhood. They should also do something about the fact that many people just dump their stuff on strips along the road. Sometimes it looks like a rubbish dump and that makes me angry. In Germany they have one day a year when everyone can put their stuff out on the street and they come to collect it (maybe something to think about!). I also think more attention should be paid to less reckless driving in the neighbourhood (both cars, cyclists and scooters).
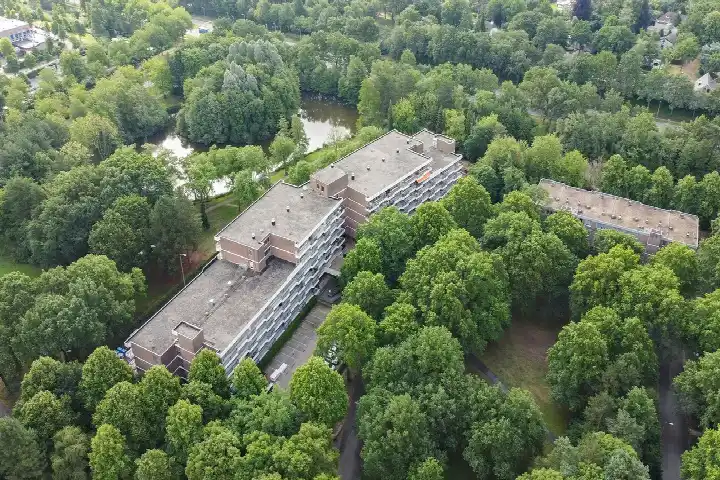
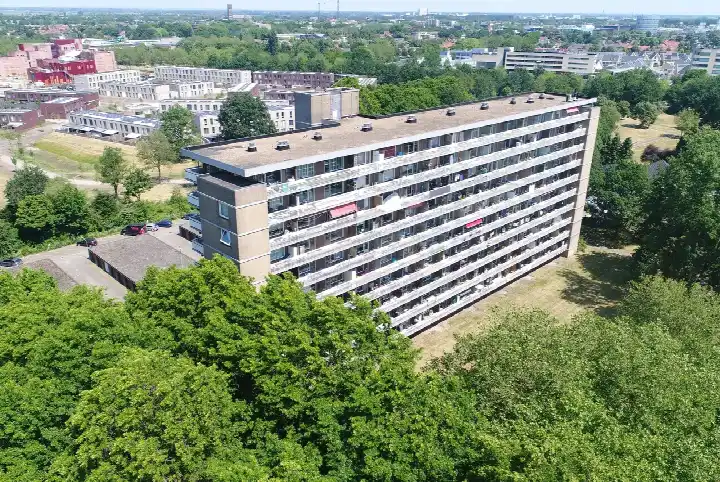
Auto-translated to English by AIMy daughter and I live in a flat. We really like it here. It's just a shame that there are hardly any Dutch people in our building.
Auto-translated to English by AIWould like to learn sign language
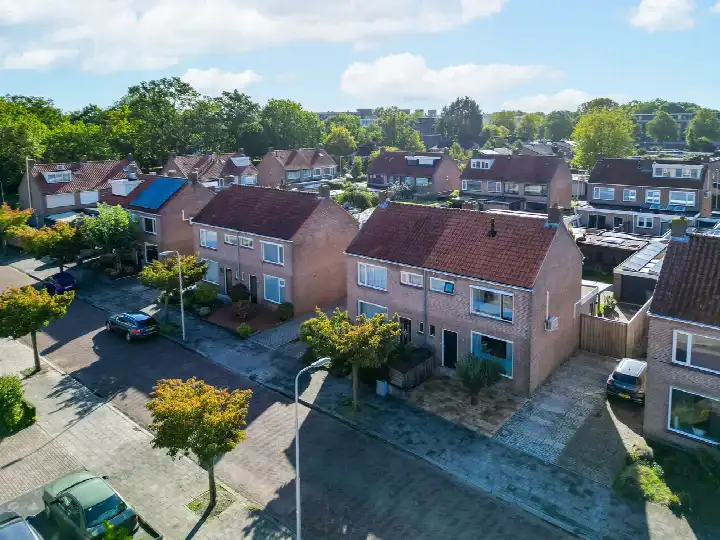
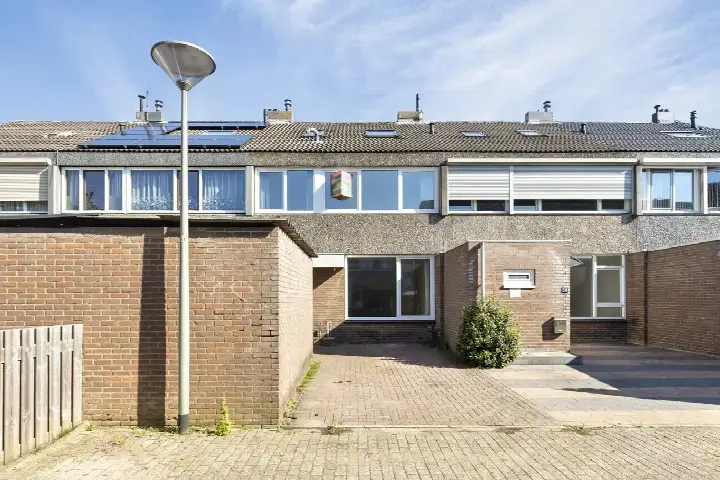
Auto-translated to English by AIThe housing stock is mainly post-war — 86% was built between 1945 and 1990. In addition, the most common type is terraced houses (45%).
Over the past year a home for sale in Ruwaard was listed for an average of €436,632 (€3,421 per m²). That is 17% below the Dutch national average.
A rental home in Ruwaard cost an average of €1,259 per month (€17 per m²). That is 42% below the national average.
Residents give Ruwaard a 7.2 out of 10 based on 6 reviews. The strongest score is for education (8.2), the weakest for housing (5.8).
From Ruwaard you can on average reach a supermarket at 0.7 km, a GP at 0.9 km, a railway station at 1.4 km, a primary school at 0.7 km (as the crow flies, source: CBS).
Right now you will find 44 homes for sale and 7 homes for rent in Ruwaard.