District in Amsterdam
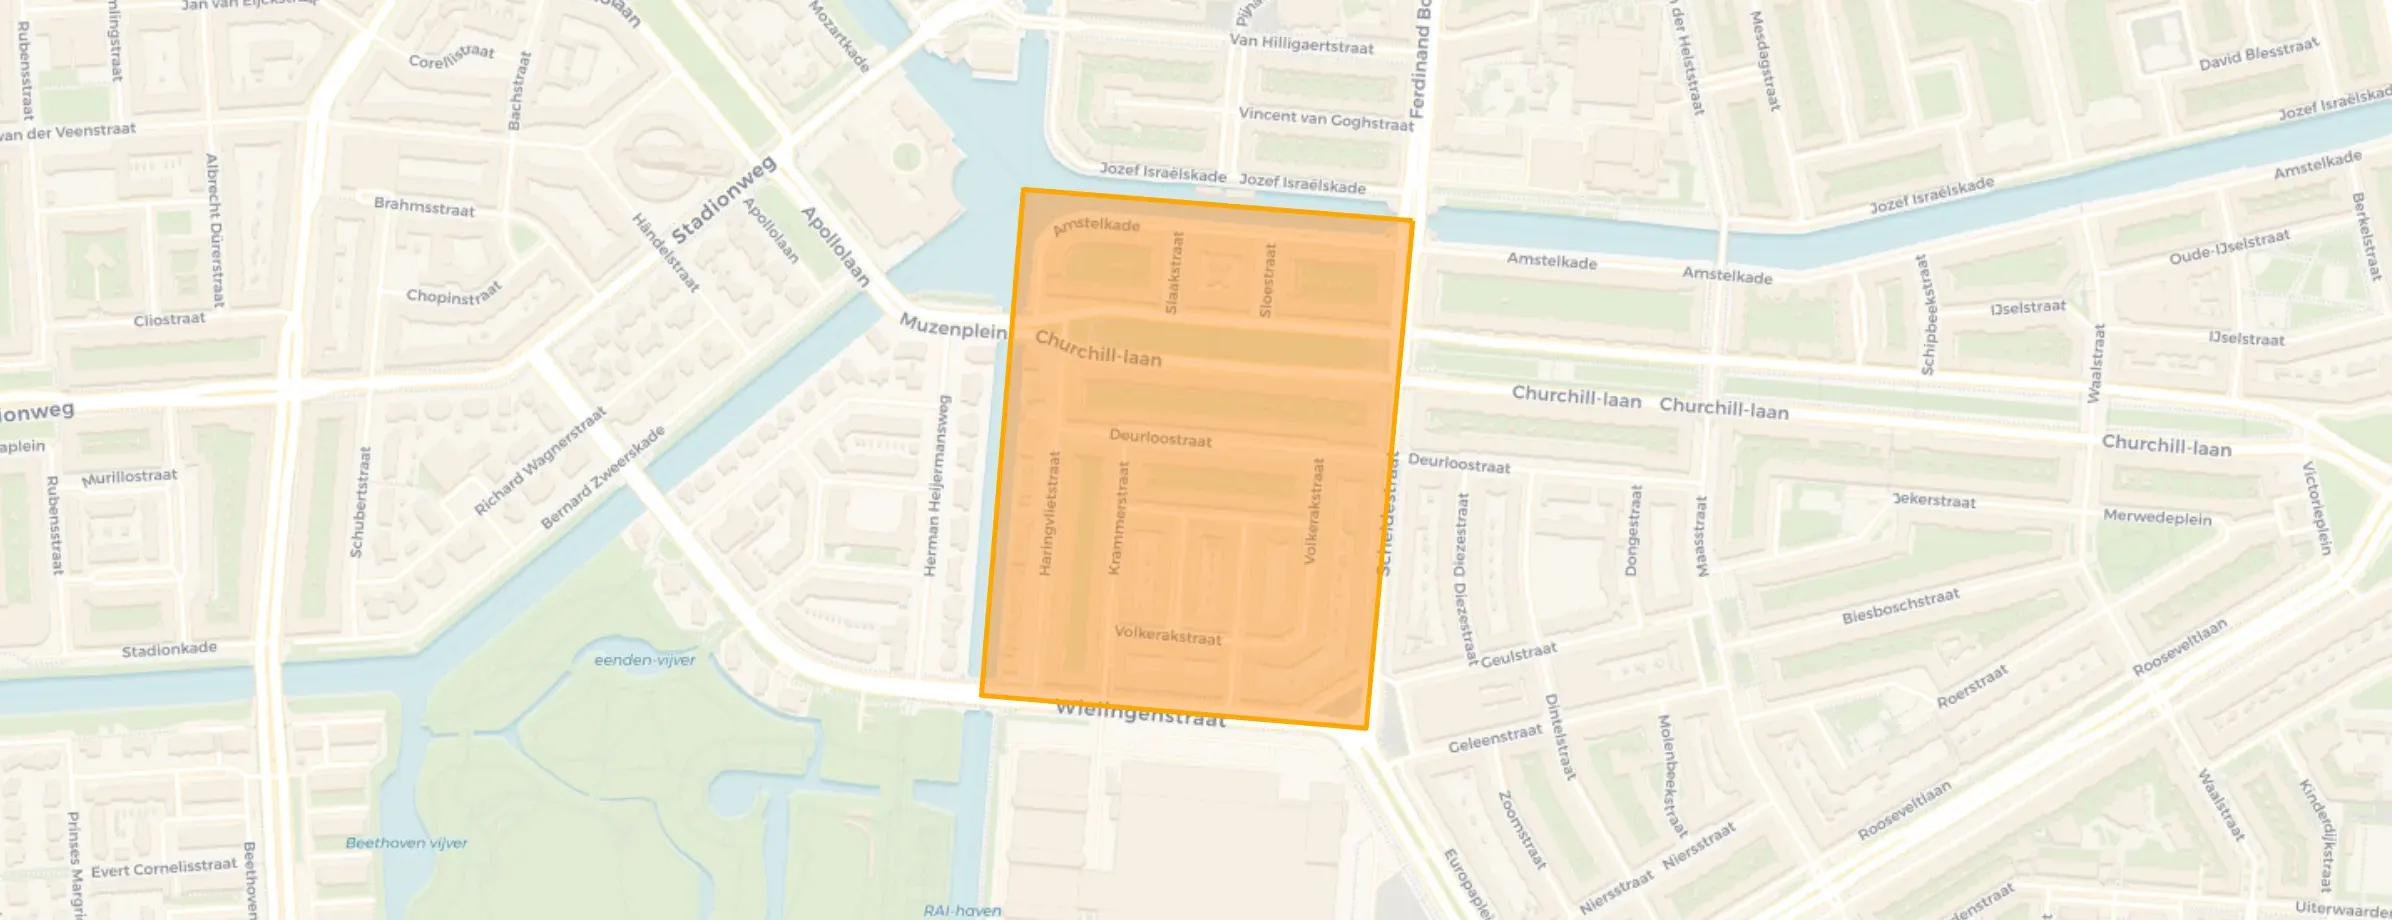
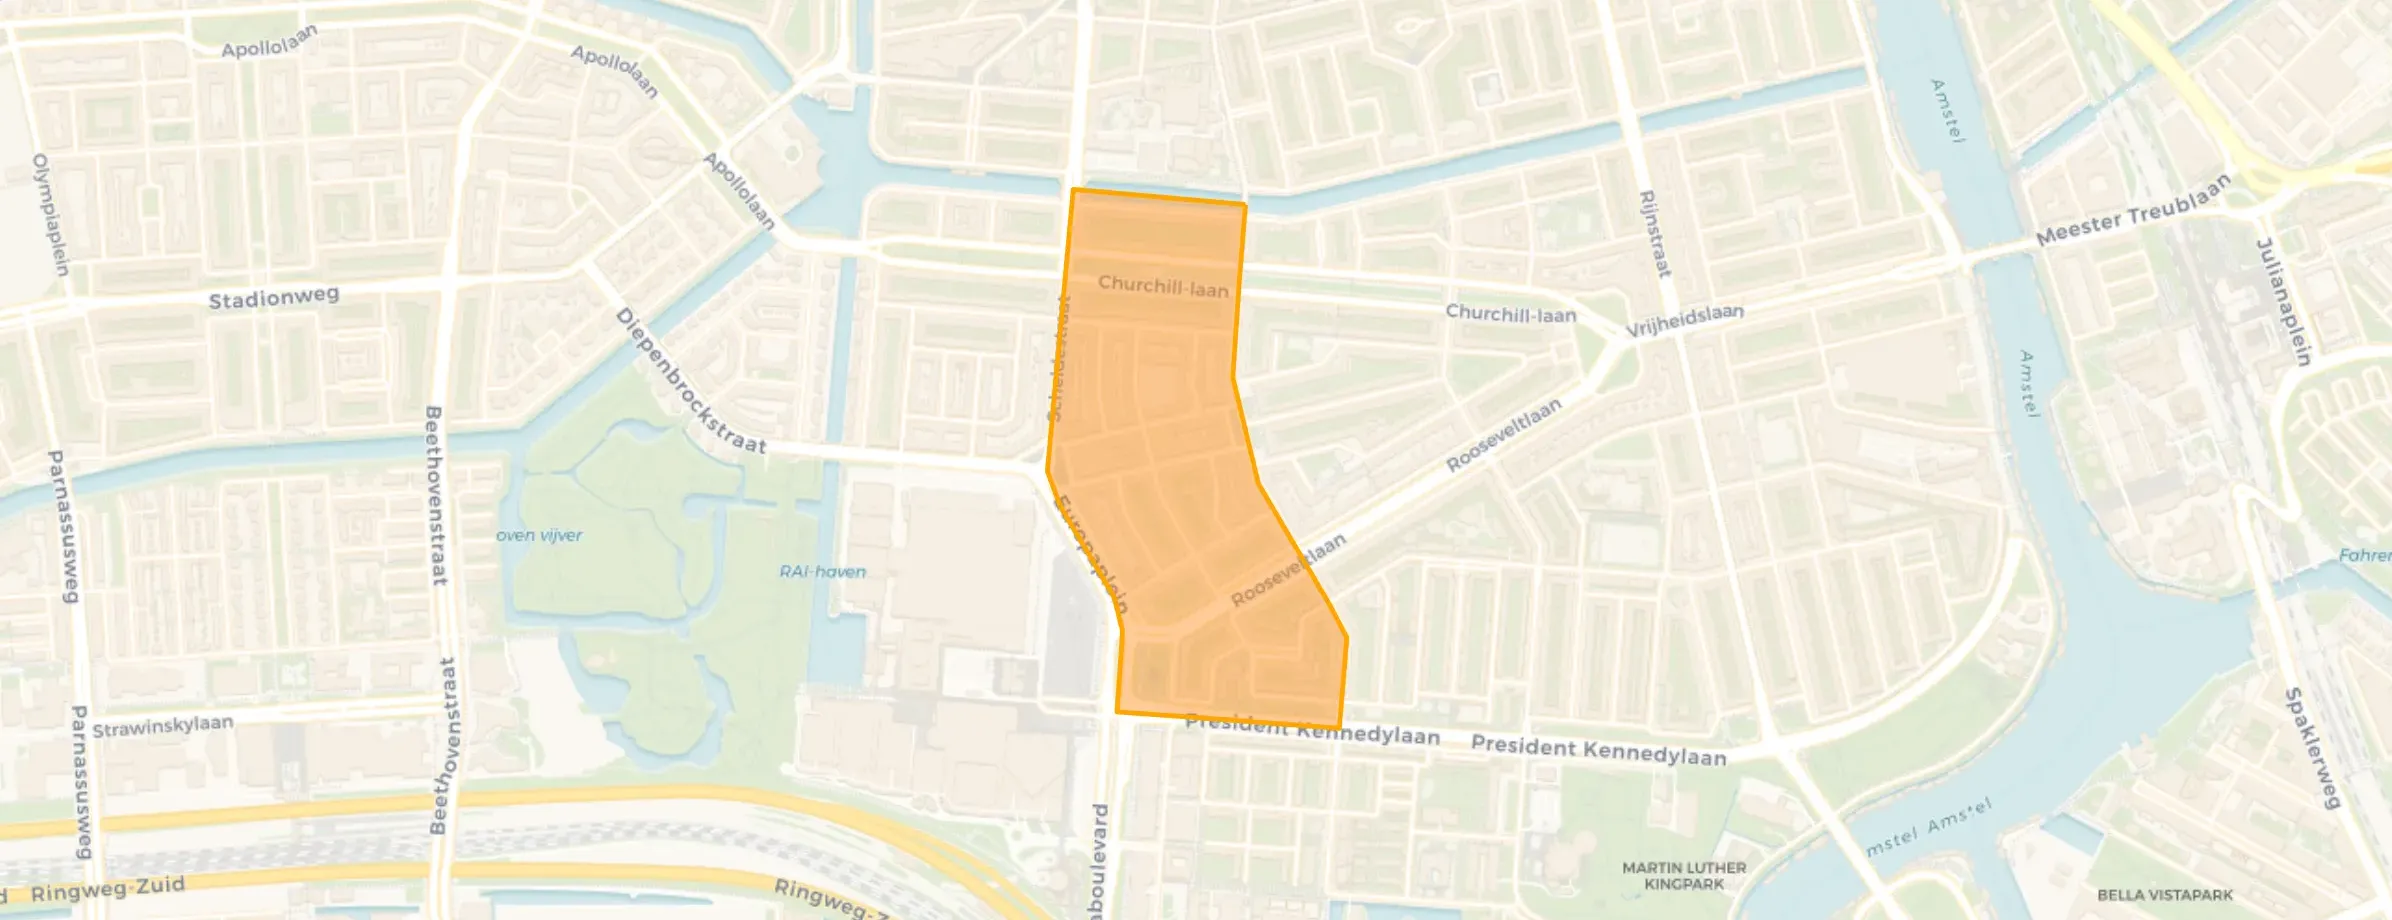
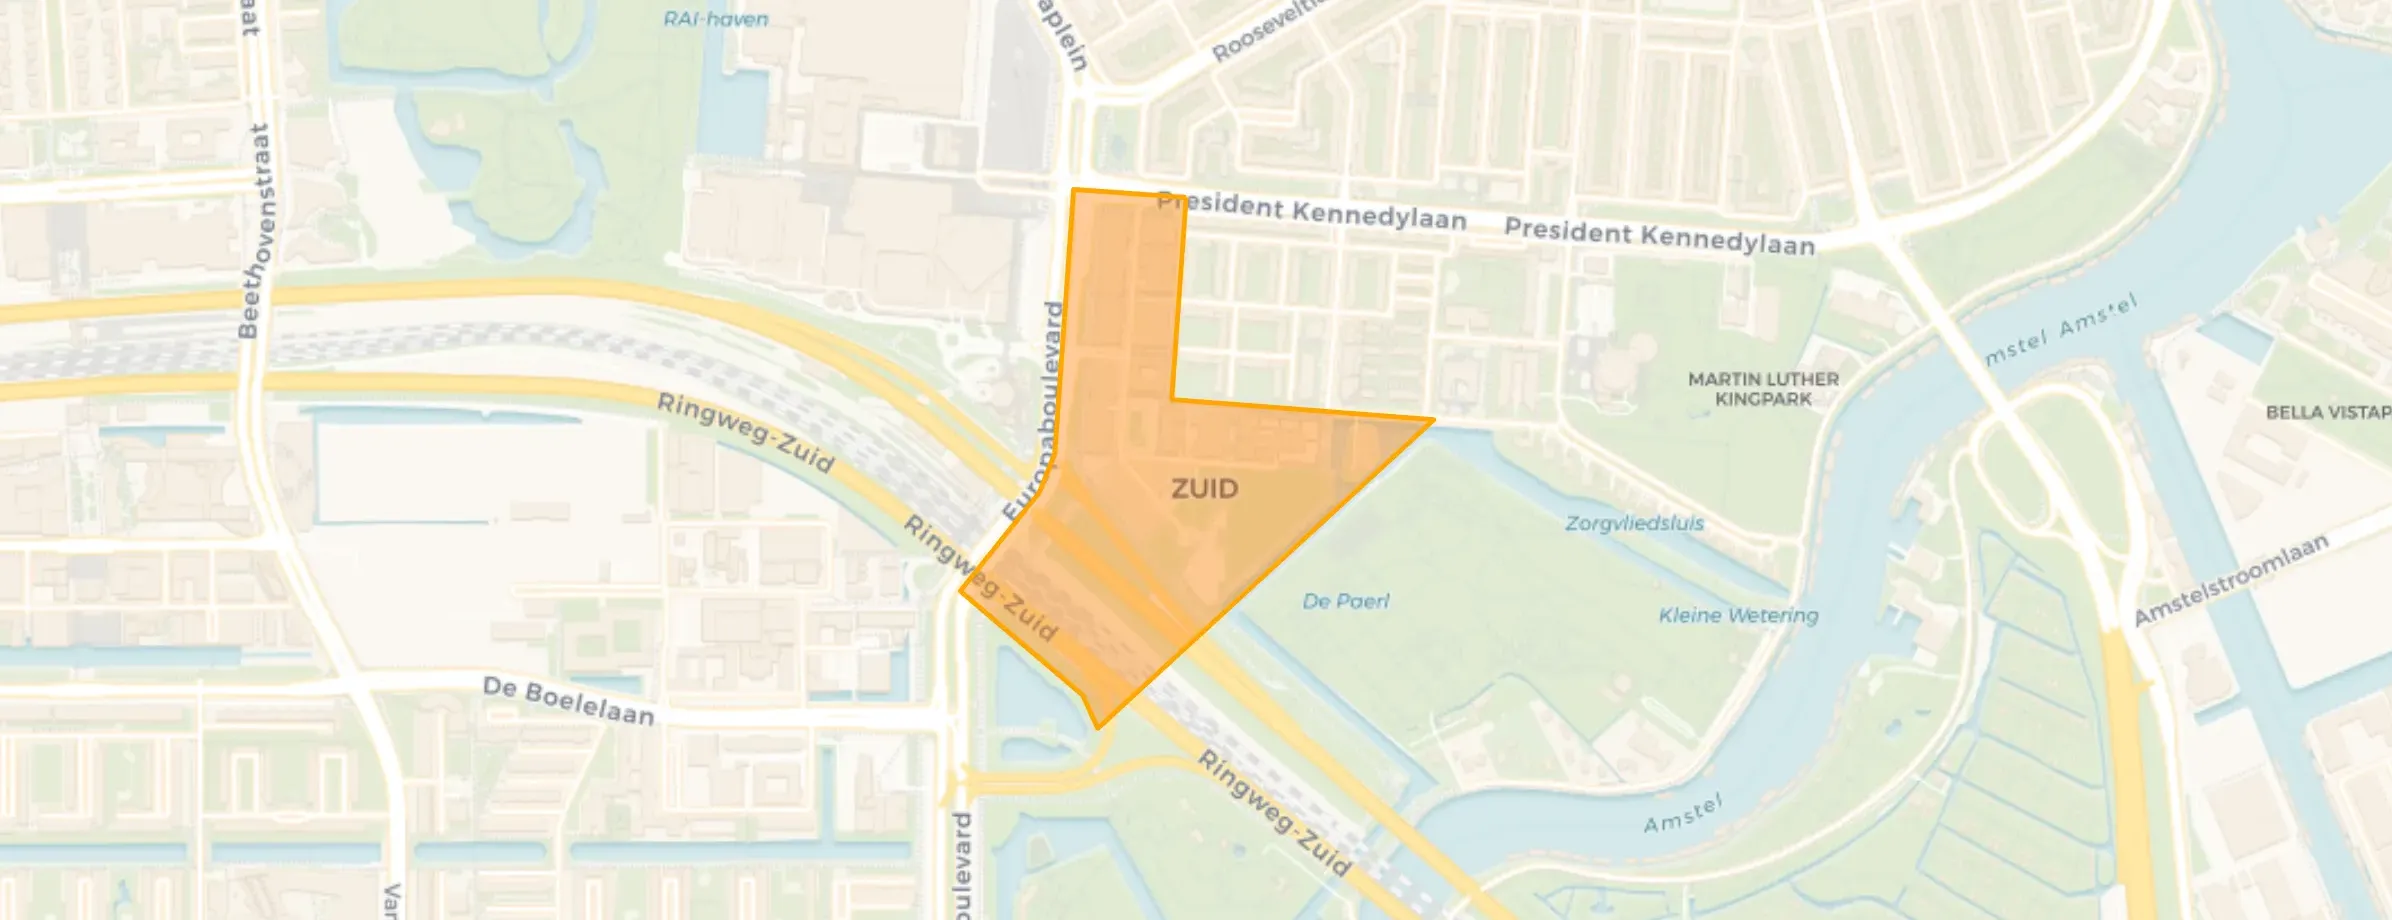
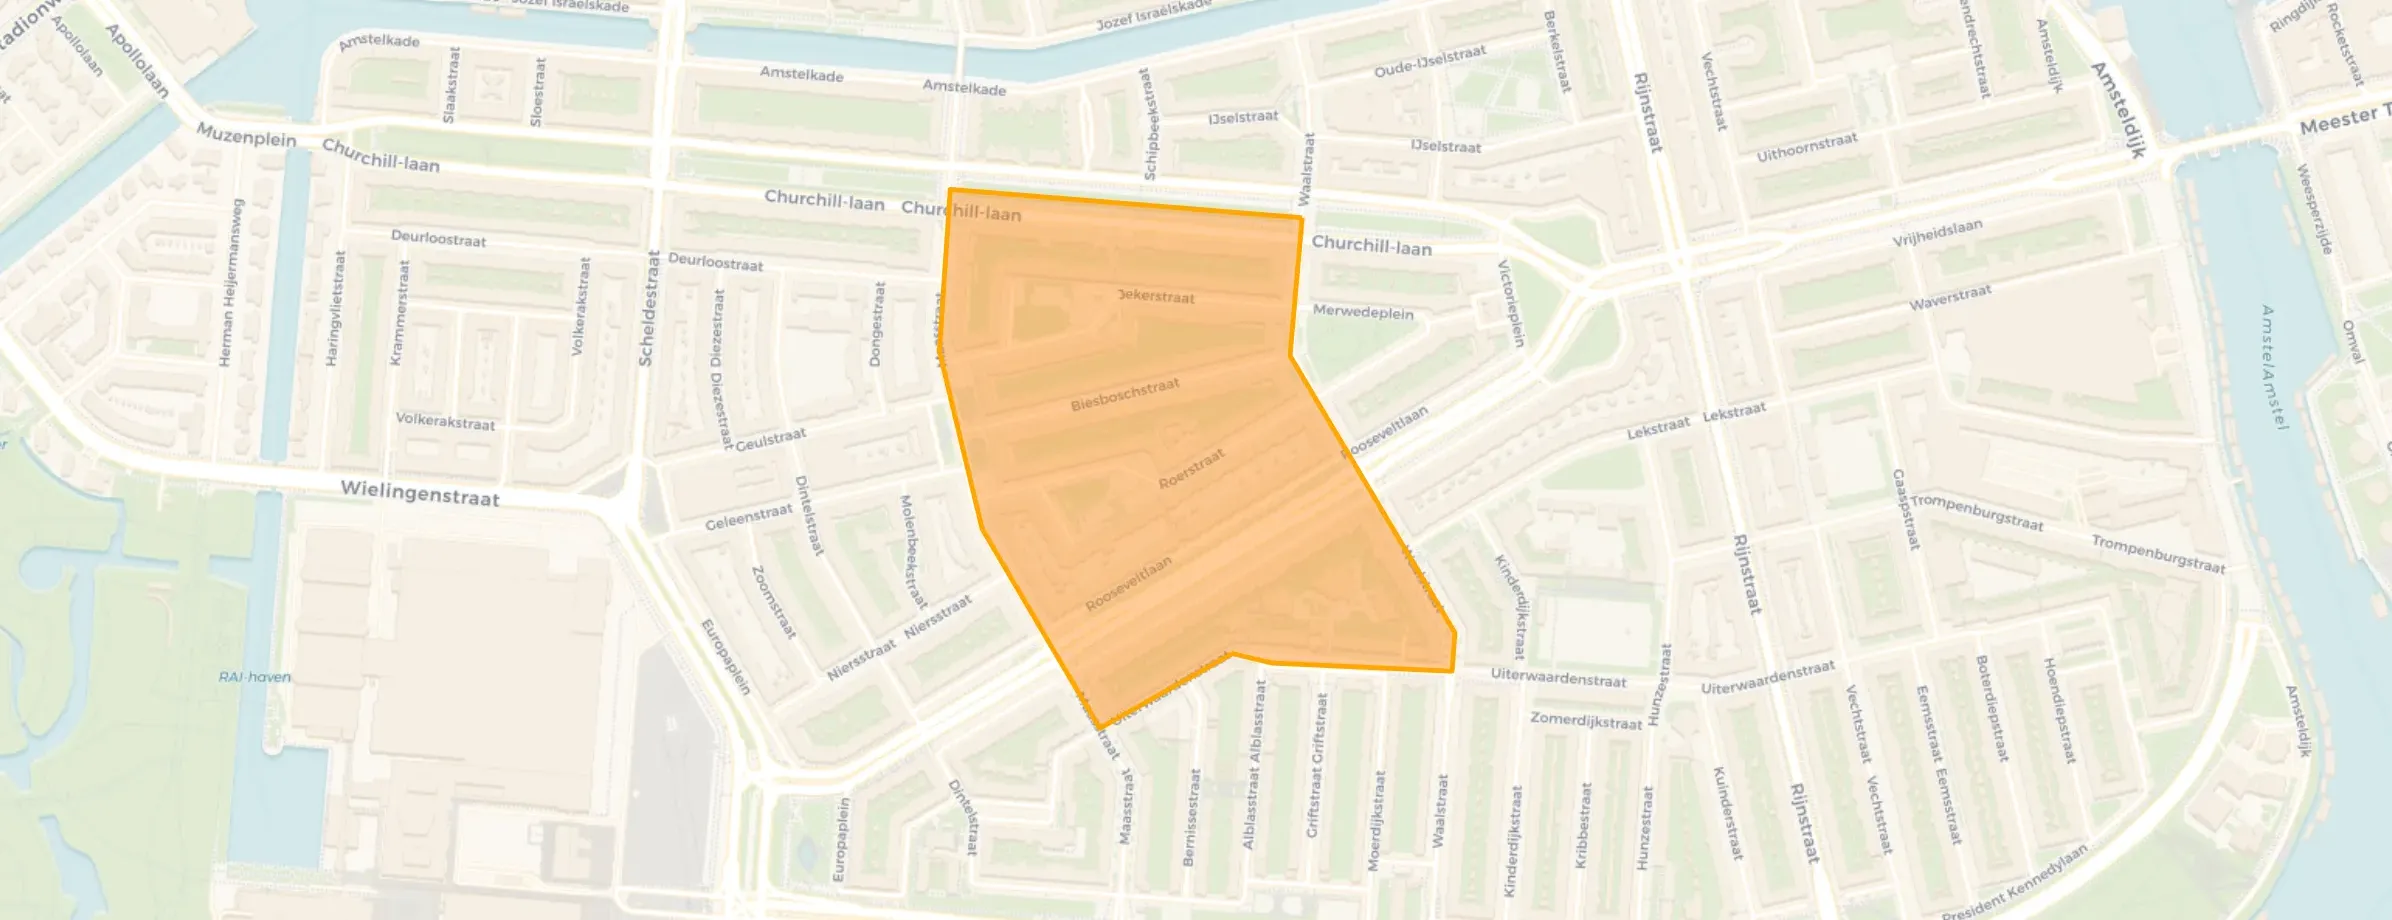
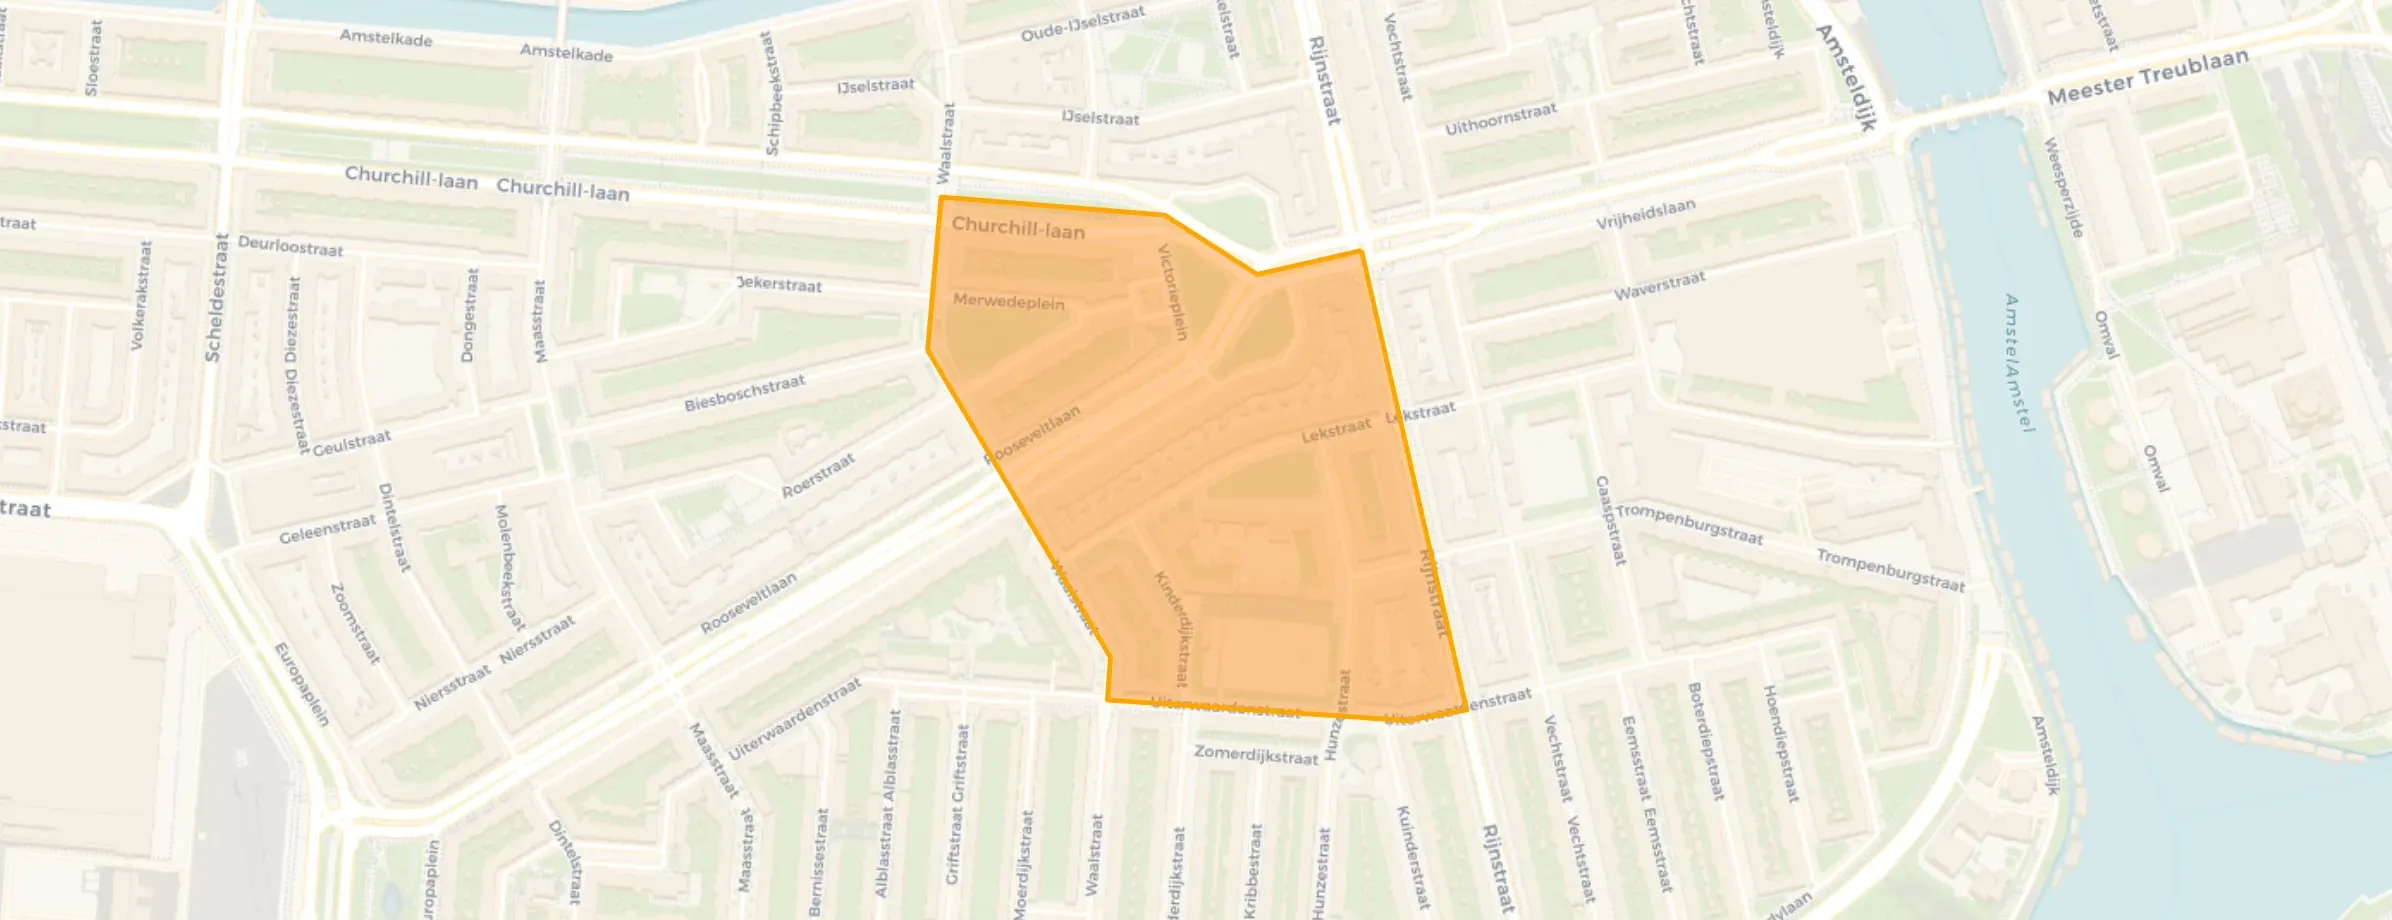
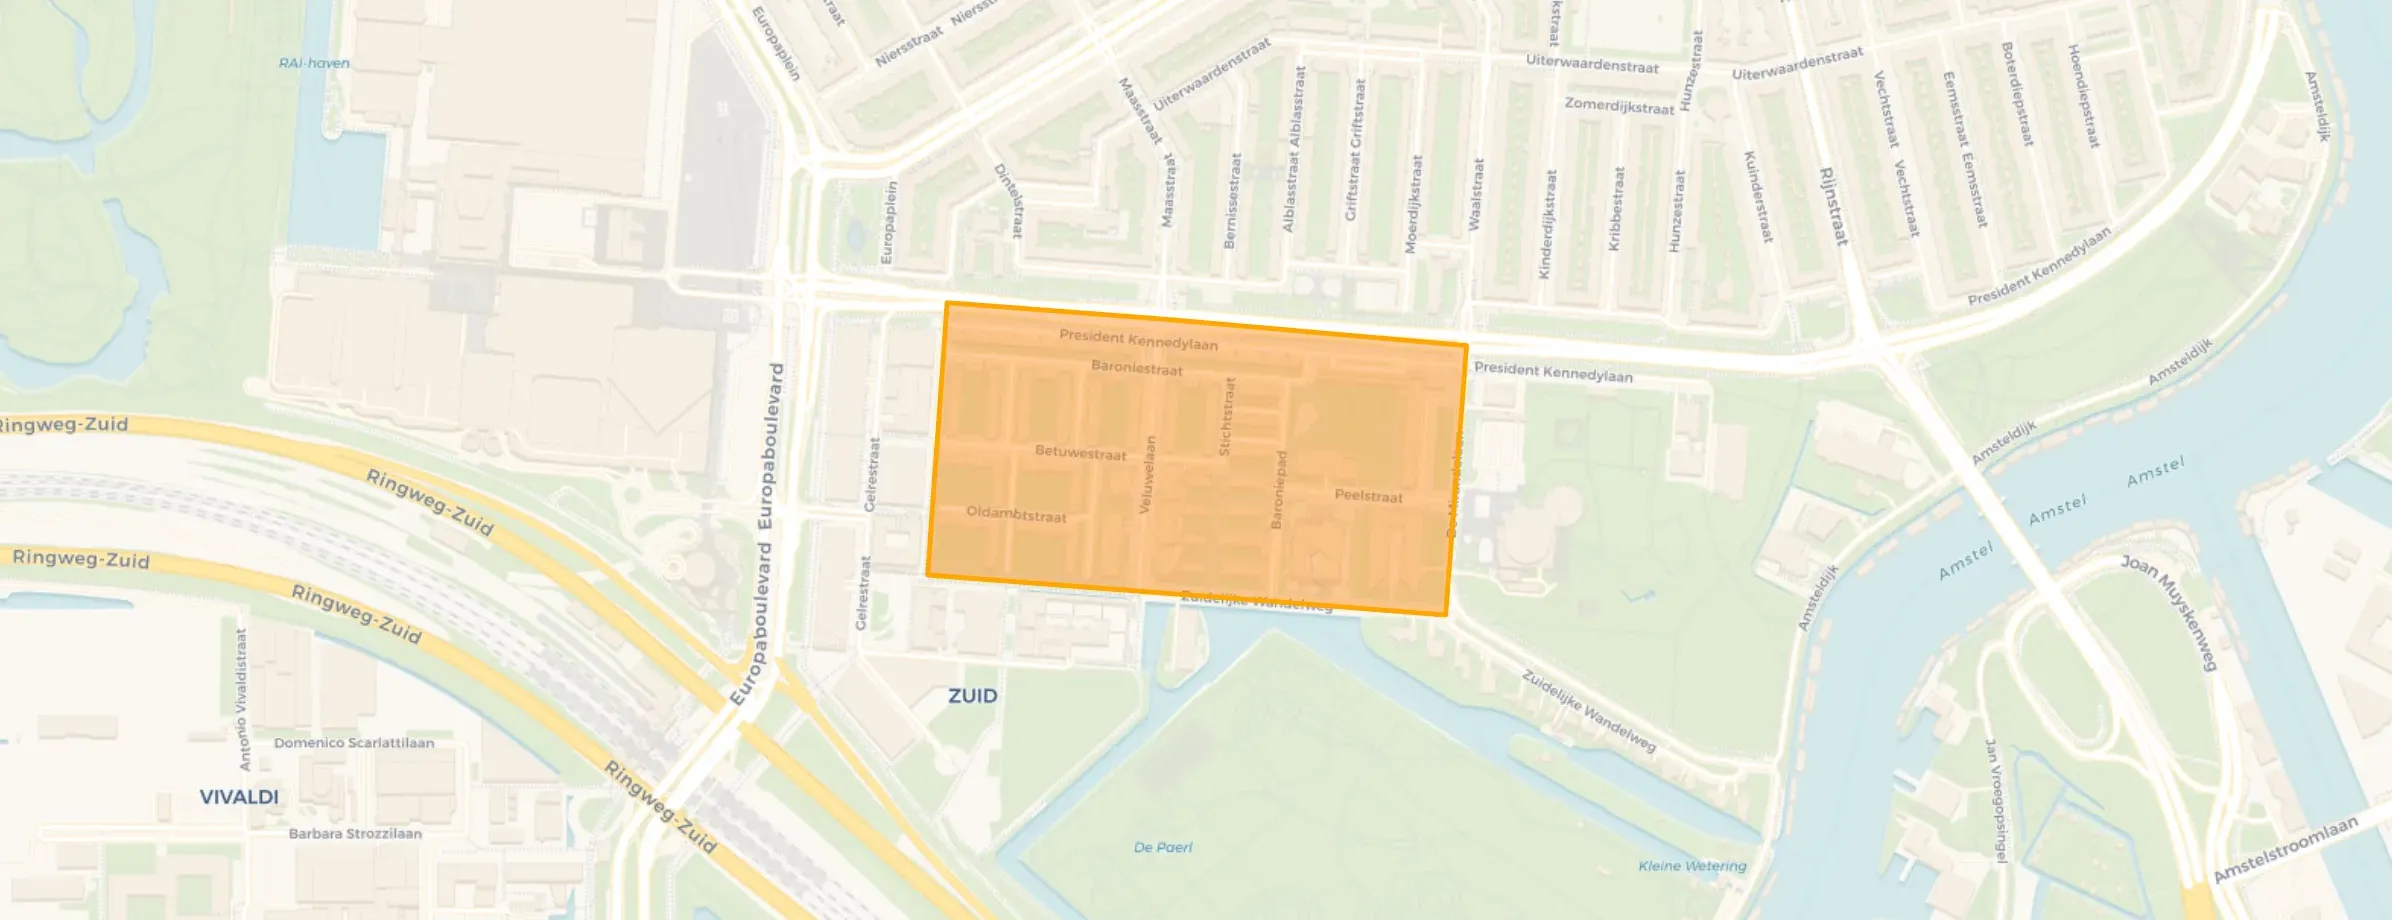
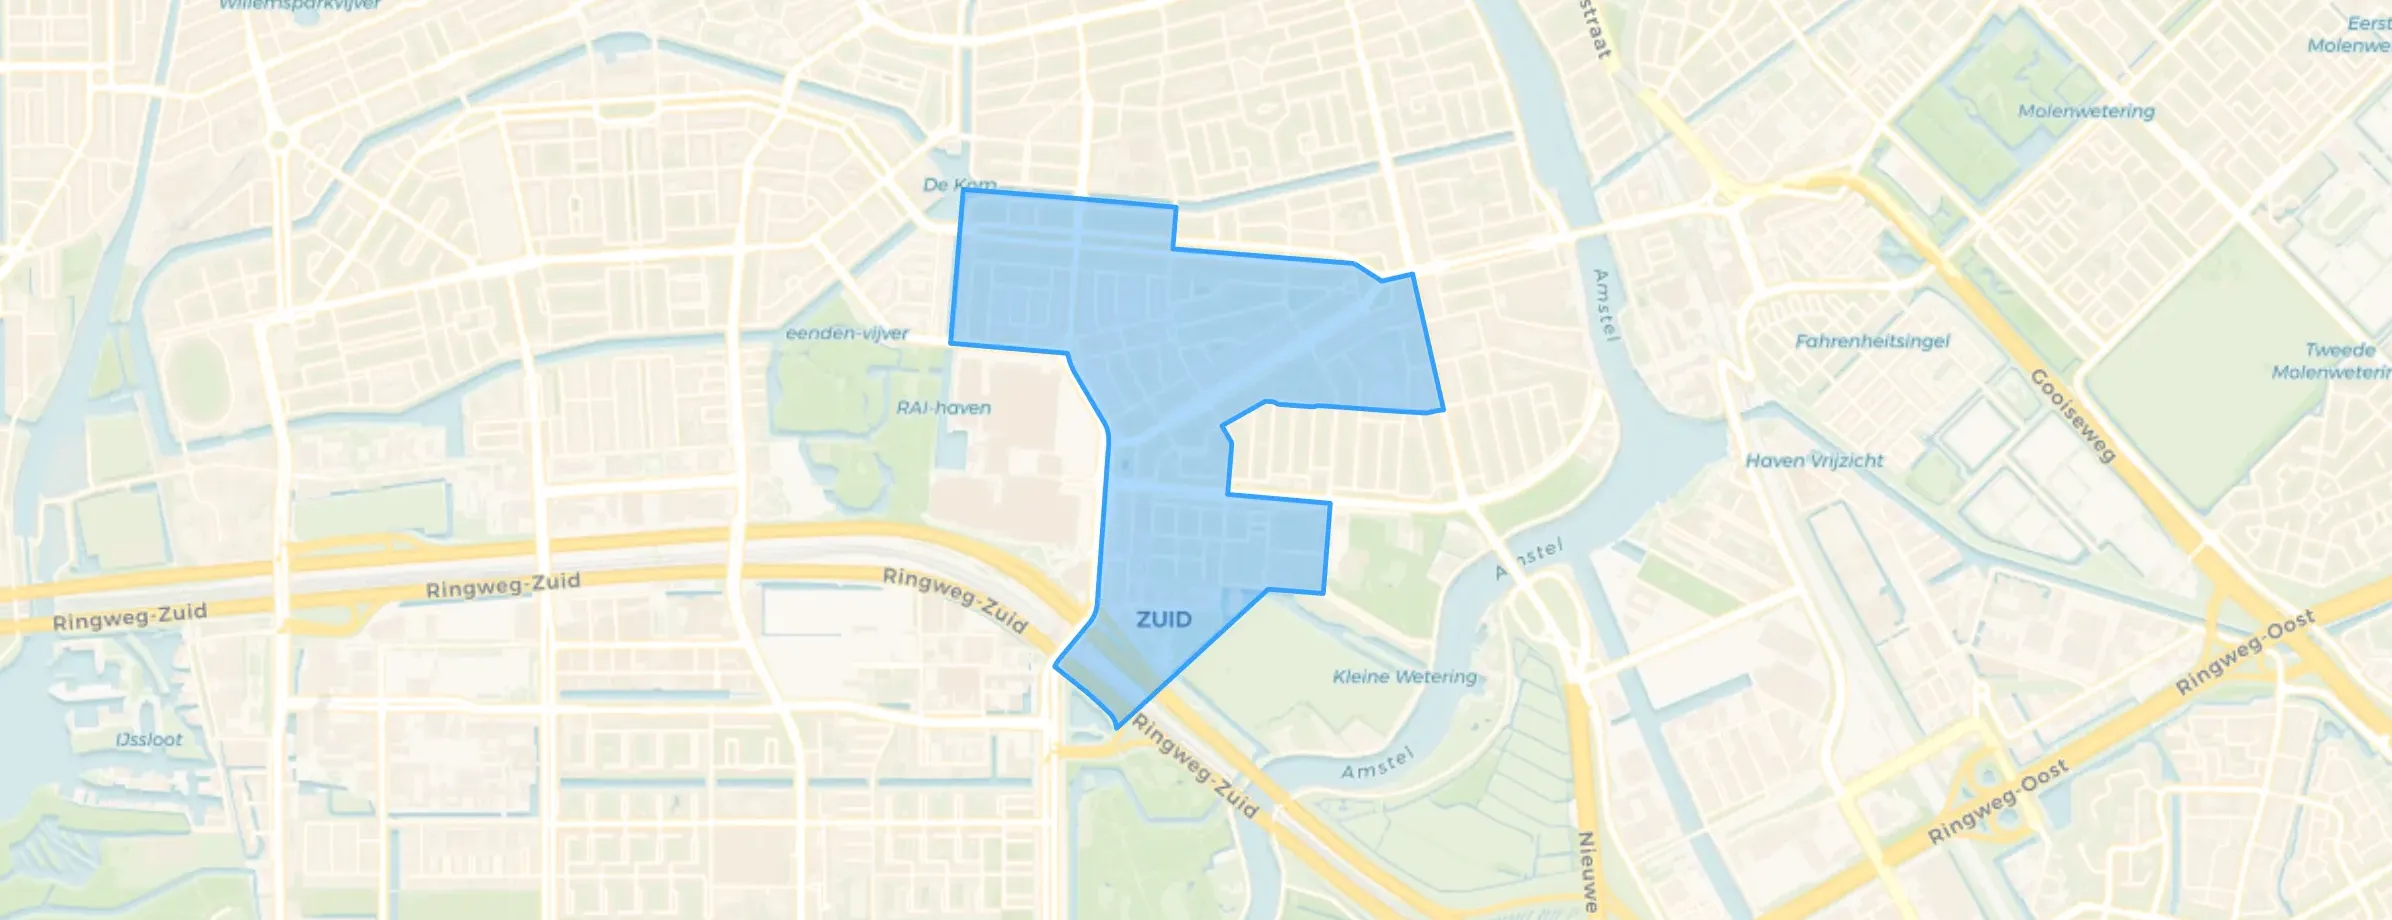
Scheldebuurt is located in the province of Noord-Holland, in the municipality of Amsterdam The district has a total area of 101 hectares, of which 99 hectares are land and 2 hectares are water. The district is coded as WK0363KK. The postcode area is 1078AP-1079WD.
Scheldebuurt has 15.125 residents. Of these, 46,9% are men and 53,1% are women. Most residents are 25 to 45 years (42,5%). The other age groups are 18,8% for '45 to 65 years', 15,2% for '65 years or older', 12,3% for '0 to 15 years' and 11,2% for '15 to 25 years'. Of the residents, 67,3% is unmarried, 22,9% is married, 7,0% is divorced and 2,9% is widowed. 8.580 residents originate from the Netherlands, 2.985 come from Europe and 3.560 come from countries outside Europe.
There are 8.285 households in Scheldebuurt. 49,1% of these are single-person households, 29,3% households without children and 21,6% households with children. The average household size is 1,8 persons. The national average is 2,1 persons.
In Scheldebuurt there are 12.600 income recipients. The average income per income recipient is €64.200, which is €22.000 (52%) higher than the national average of €42.200. Per resident, the average income is €54.300, which is €19.400 (56%) higher than the national average of €34.900. Most residents of Scheldebuurt are highly educated. 69,2% have a university or higher professional education (HBO/WO), 20,1% have an intermediate education (HAVO, VWO or MBO 2-4) and 10,7% have a lower education (VMBO or MBO 1).
Of the 15.125 residents, around 78% are in paid employment, which amounts to 11.798 people. This is 6% higher than the national average of 72%. The majority of workers are in salaried employment (79%), while 21% are self-employed. In Scheldebuurt, 18% of residents receive a benefit. The largest group is those receiving a state pension (AOW). 2.080 people receive this benefit.
In Scheldebuurt there are 8.156 homes with an average assessed value (WOZ) of €654.000. Of these, around 91% are occupied and 9% unoccupied. Most homes are rental properties. This amounts to 69% rental homes and 31% owner-occupied homes. Of the homes, 31% privately owned, 17% owned by housing associations and 52% owned by other landlords. The most common construction periods in Scheldebuurt are 1925-1950 (77%) and 1950-1970 (9%).
There are currently no homes for sale in Scheldebuurt. The most recently listed home is Roerstraat 39-3 by Inter Immo Makelaars BV op Funda. No homes were sold in Scheldebuurt over the past year.
There are currently no homes for rent in Scheldebuurt. The most recent home is Amstelkade 168-4B, offered by www.vva.amsterdam. No homes were let in Scheldebuurt over the past year.
No recent rental data available for Scheldebuurt.
In Scheldebuurt there are 7.562 addresses with a registered energy label. The most common labels are C (28%), A (17%) and D (17%). On average, an address in Scheldebuurt uses 2.090 kWh of electricity per year. This is 18% below the national average of 2.550 kWh. Natural gas consumption in this neighbourhood, at 800 m³ per year, exactly matches the national average.

I have been living in this neighbourhood for 19 years now and have a good relationship with our neighbours. Fun events are regularly organised that the neighbourhood can join in with. My children went to school here and have built up many friends in the area. It is a cosy little village, most people know each other and care about one another.
Auto-translated to English by AIPleasant living in this neighbourhood. Mostly local traffic, so the bustle is very manageable. Feels like a village in the city. Close to various schools, Beatrixpark and the centre. The Scheldestraat, Maasstraat and Beethovenstraat shopping streets are within walking distance. Child-friendly. The only downside is the busy traffic on the Scheldestraat, which can cause dangerous situations.
Auto-translated to English by AIPros - Lots of green (Beatrixpark opposite us) - Good amenities - Quiet street where kids can play - Cosy Maasstraat around the corner - Feels like a village in the middle of the city Cons - Dangerous traffic on Scheldestraat - Rubbish bins often too full, causing lots of waste next to the bins
Auto-translated to English by AIThe housing stock is predominantly pre-war — 82% of the homes date from before 1945. In addition, the most common type is flats (98%).
Over the past year a home for sale in Scheldebuurt was listed for an average of €823,870 (€8,990 per m²). Last quarter prices rose by 6%.
A rental home in Scheldebuurt cost an average of €2,997 per month (€36 per m²).
Residents give Scheldebuurt a 8.3 out of 10 based on 3 reviews. Safety stands out with a 9.3; cleanliness lags behind with a 7.3.
Wijk Scheldebuurt has 15,125 residents. The largest age group is 25 to 45 years (43%).
The housing supply in Scheldebuurt is remarkably efficient: 55% has an A, A+ or B label. The average natural gas consumption per household is 800 m³ per year.
From Scheldebuurt you can on average reach a supermarket at 0.4 km, a GP at 0.4 km, a railway station at 1.2 km, a primary school at 0.6 km (as the crow flies, source: CBS).
Right now you will find 109 homes for sale and 31 homes for rent in Scheldebuurt.