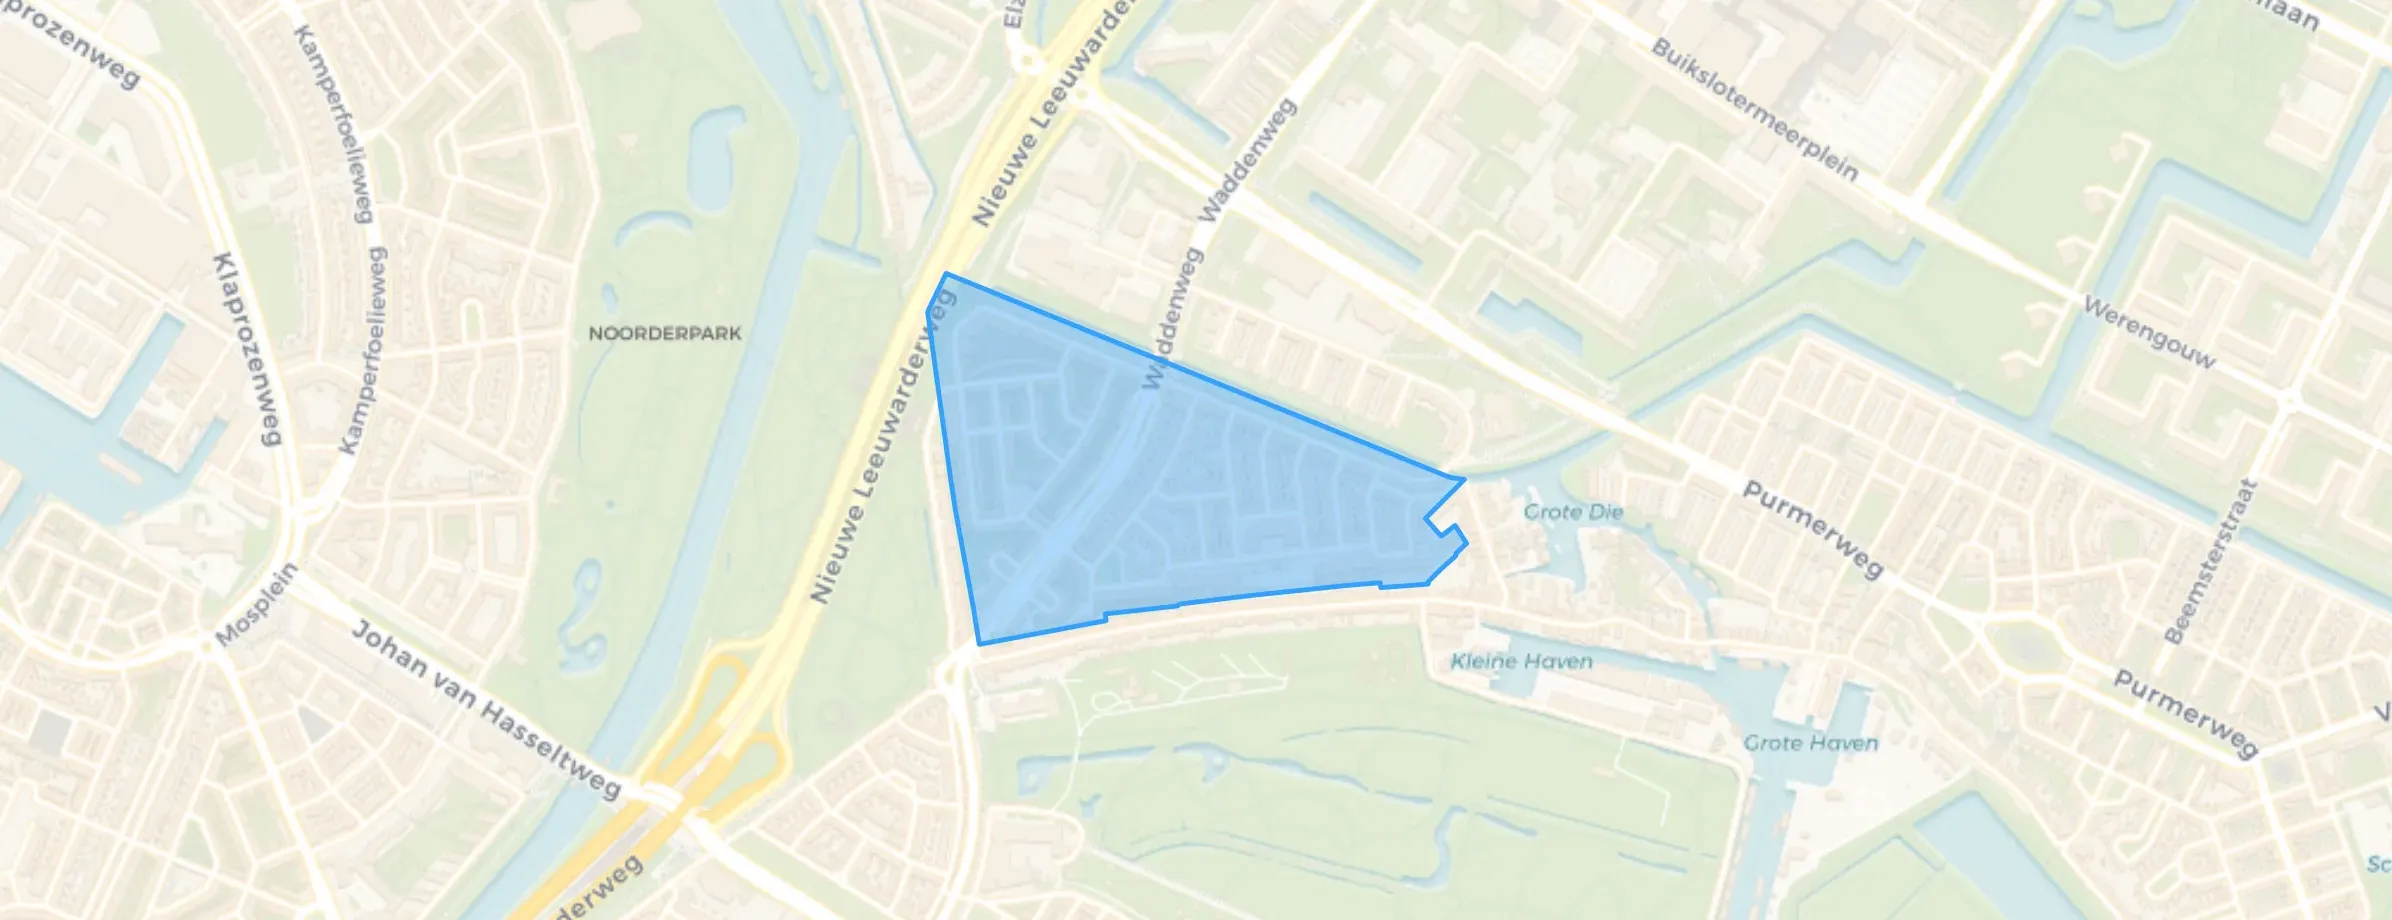
District in Amsterdam
Tuindorp Buiksloot is located in the province of Noord-Holland, in the municipality of Amsterdam The district has a total area of 17 hectares, of which 17 hectares are land and 0 hectares are water. The district is coded as WK0363NM. The postcode area is 1025MB-1025XW.
Tuindorp Buiksloot has 1.905 residents. Of these, 47,2% are men and 52,5% are women. Most residents are 25 to 45 years (28,3%). The other age groups are 25,5% for '45 to 65 years', 19,7% for '65 years or older', 17,3% for '0 to 15 years' and 8,9% for '15 to 25 years'. Of the residents, 55,6% is unmarried, 28,9% is married, 9,2% is divorced and 6,0% is widowed. 1.155 residents originate from the Netherlands, 180 come from Europe and 565 come from countries outside Europe.
There are 930 households in Tuindorp Buiksloot. 41,9% of these are single-person households, 21,0% households without children and 37,1% households with children. The average household size is 2,0 persons.
In Tuindorp Buiksloot there are 1.500 income recipients. The average income per income recipient is €28.100, which is €7.700 (22%) lower than the national average of €35.800. Per resident, the average income is €23.200, which is €6.000 (21%) lower than the national average of €29.200. Most residents of Tuindorp Buiksloot are highly educated. 40,7% have a university or higher professional education (HBO/WO), 30,3% have a lower education (VMBO or MBO 1) and 29,0% have an intermediate education (HAVO, VWO or MBO 2-4).
Of the 1.905 residents, around 57% are in paid employment, which amounts to 1.086 people. This is 8% lower than the national average of 65%. The majority of workers are in salaried employment (85%), while 15% are self-employed. In Tuindorp Buiksloot, 30% of residents receive a benefit. The largest group is those receiving a state pension (AOW). 310 people receive this benefit.
In Tuindorp Buiksloot there are 912 homes with an average assessed value (WOZ) of €422.000. Of these, around 97% are occupied and 3% unoccupied. Most homes are rental properties. This amounts to 81% rental homes and 19% owner-occupied homes. Of the homes, 19% privately owned, 80% owned by housing associations and 1% owned by other landlords. The most common construction periods in Tuindorp Buiksloot are 1925-1950 (84%) and 1980-1990 (13%).
There are currently no homes for sale in Tuindorp Buiksloot. The most recently listed home is Voornestraat 17 by Recourt Makelaars. No homes were sold in Tuindorp Buiksloot over the past year.
There are currently no homes for rent in Tuindorp Buiksloot. The most recent home is Waddendijk 3, offered by Openbare Makelaardij op Pararius. No homes were let in Tuindorp Buiksloot over the past year.
No recent rental data available for Tuindorp Buiksloot.
In Tuindorp Buiksloot there are 913 addresses with a registered energy label. The most common labels are C (31%), D (23%) and E (15%). On average, an address in Tuindorp Buiksloot uses 2.160 kWh of electricity per year. This is 23% below the national average of 2.810 kWh. With an annual consumption of 940 m³ per address, natural gas consumption is 27% below the national average of 1.280 m³.
We moved from Elandsgracht 2 hoog-voor with one child and pregnant with number two to North 22 years ago. Everyone thought we were crazy, 'North is insane', etc. My husband was born and raised on Elandsgracht but we couldn't afford a larger home there. He grew up in 'the slum' and saw it turn into a 'yuppie neighbourhood'. Few real Jordaan residents left and hardly any social cohesion. We found that here. Amsterdammers, social cohesion and contact. Nice and green and a (then still) affordable rental house. We see that slowly changing. Blauwe Zand doesn't change as quickly as other parts of North but gentrification is hitting here too. After 22 years we have become Northerners (Blauwe Zanders) and if you ask our son where he's from, he'll never say Amsterdam but Amsterdam-Noord. Blauwe Zand is a nice neighbourhood but the new residents are less sociable and much has disappeared. Like the little building by the playground where the mothers used to sit cosily, they knew your child so you could let him go with peace of mind. That freedom was great for the children and parents. It hurts that our children will hardly be able to live here.
Auto-translated to English by AIThe most common type is terraced houses (56%).
Over the past year a home for sale in Tuindorp Buiksloot was listed for an average of €689,166 (€8,598 per m²).
A rental home in Tuindorp Buiksloot cost an average of €2,722 per month (€35 per m²).
Wijk Tuindorp Buiksloot has 1,905 residents. Many families: 37% of the households have children.
The housing supply in Tuindorp Buiksloot is remarkably efficient: 71% has an A, A+ or B label. The average natural gas consumption per household is 940 m³ per year.
From Tuindorp Buiksloot you can on average reach a supermarket at 1.1 km, a GP at 0.8 km, a railway station at 5.1 km, a primary school at 0.5 km (as the crow flies, source: CBS).

