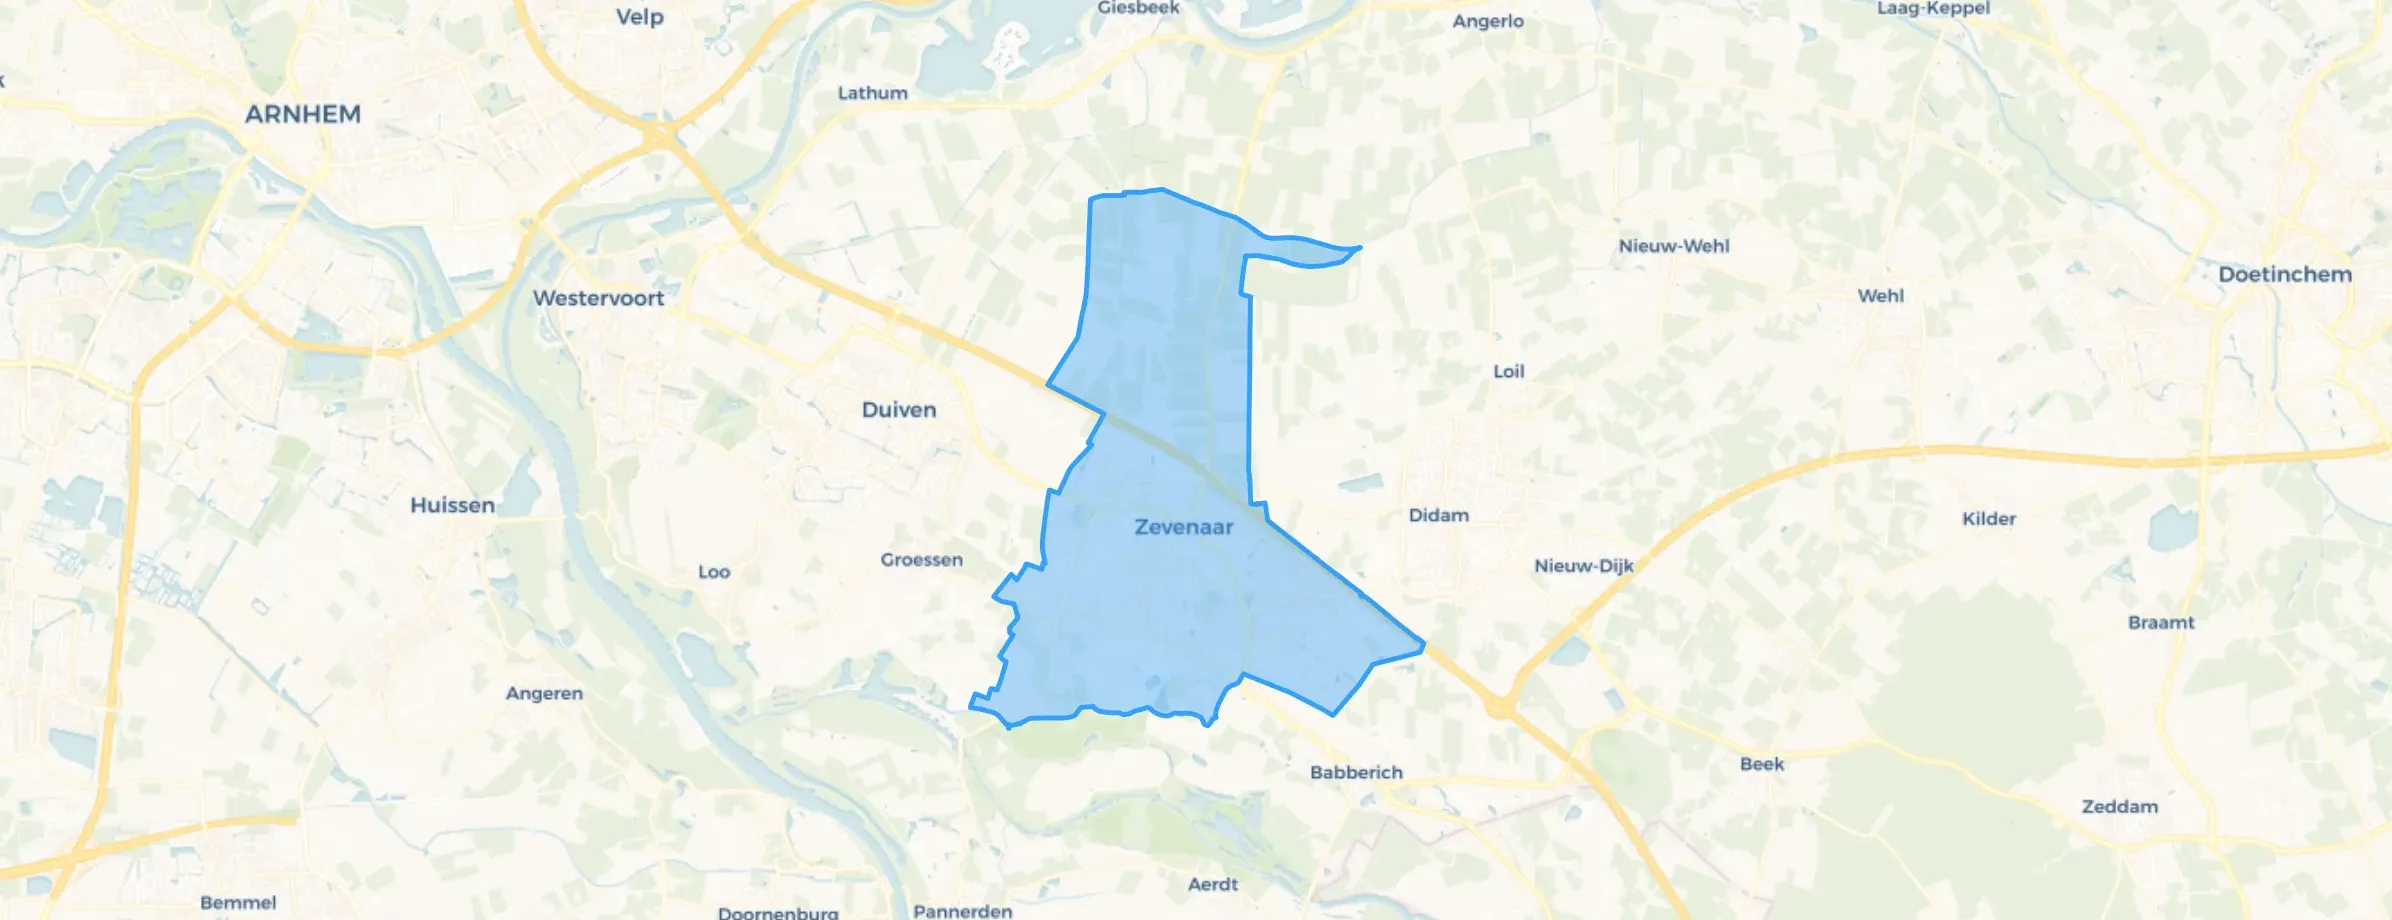
District in Zevenaar
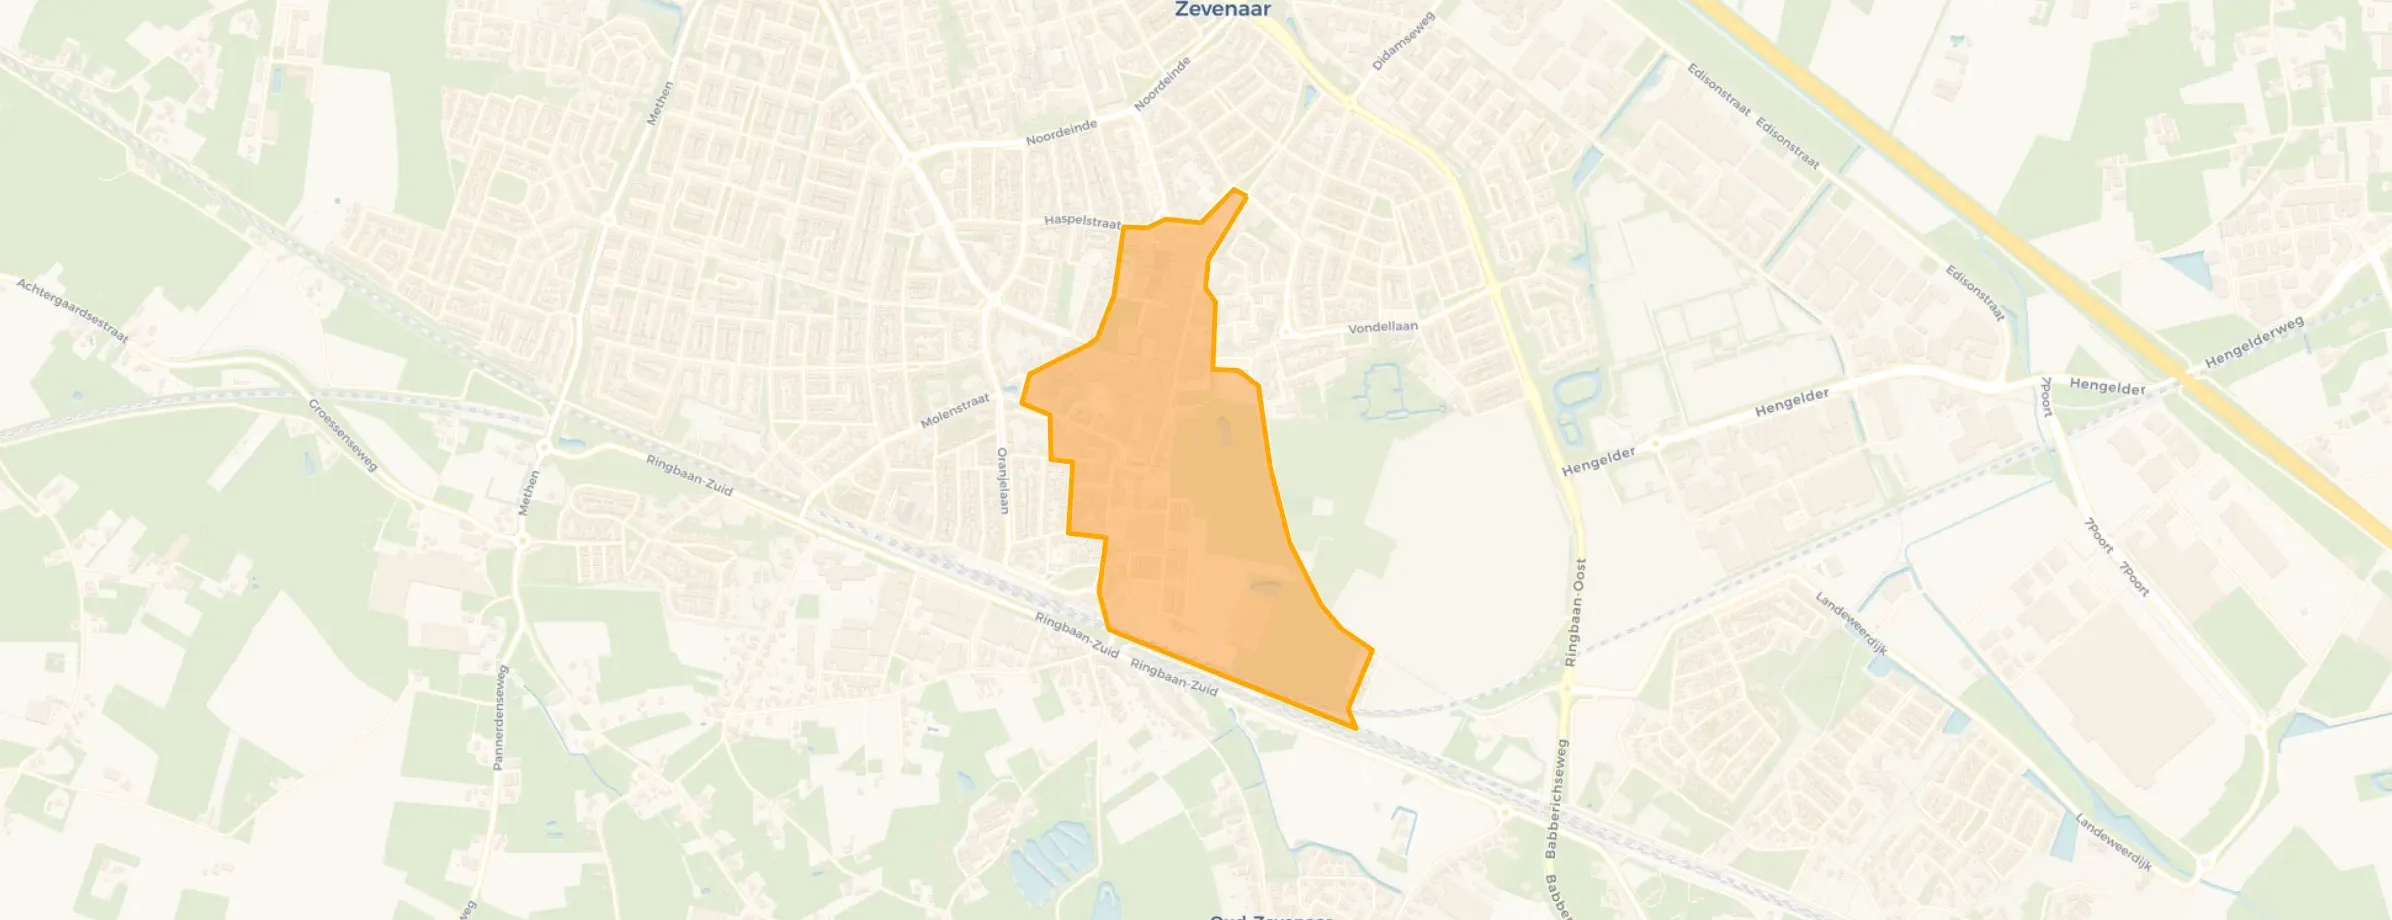
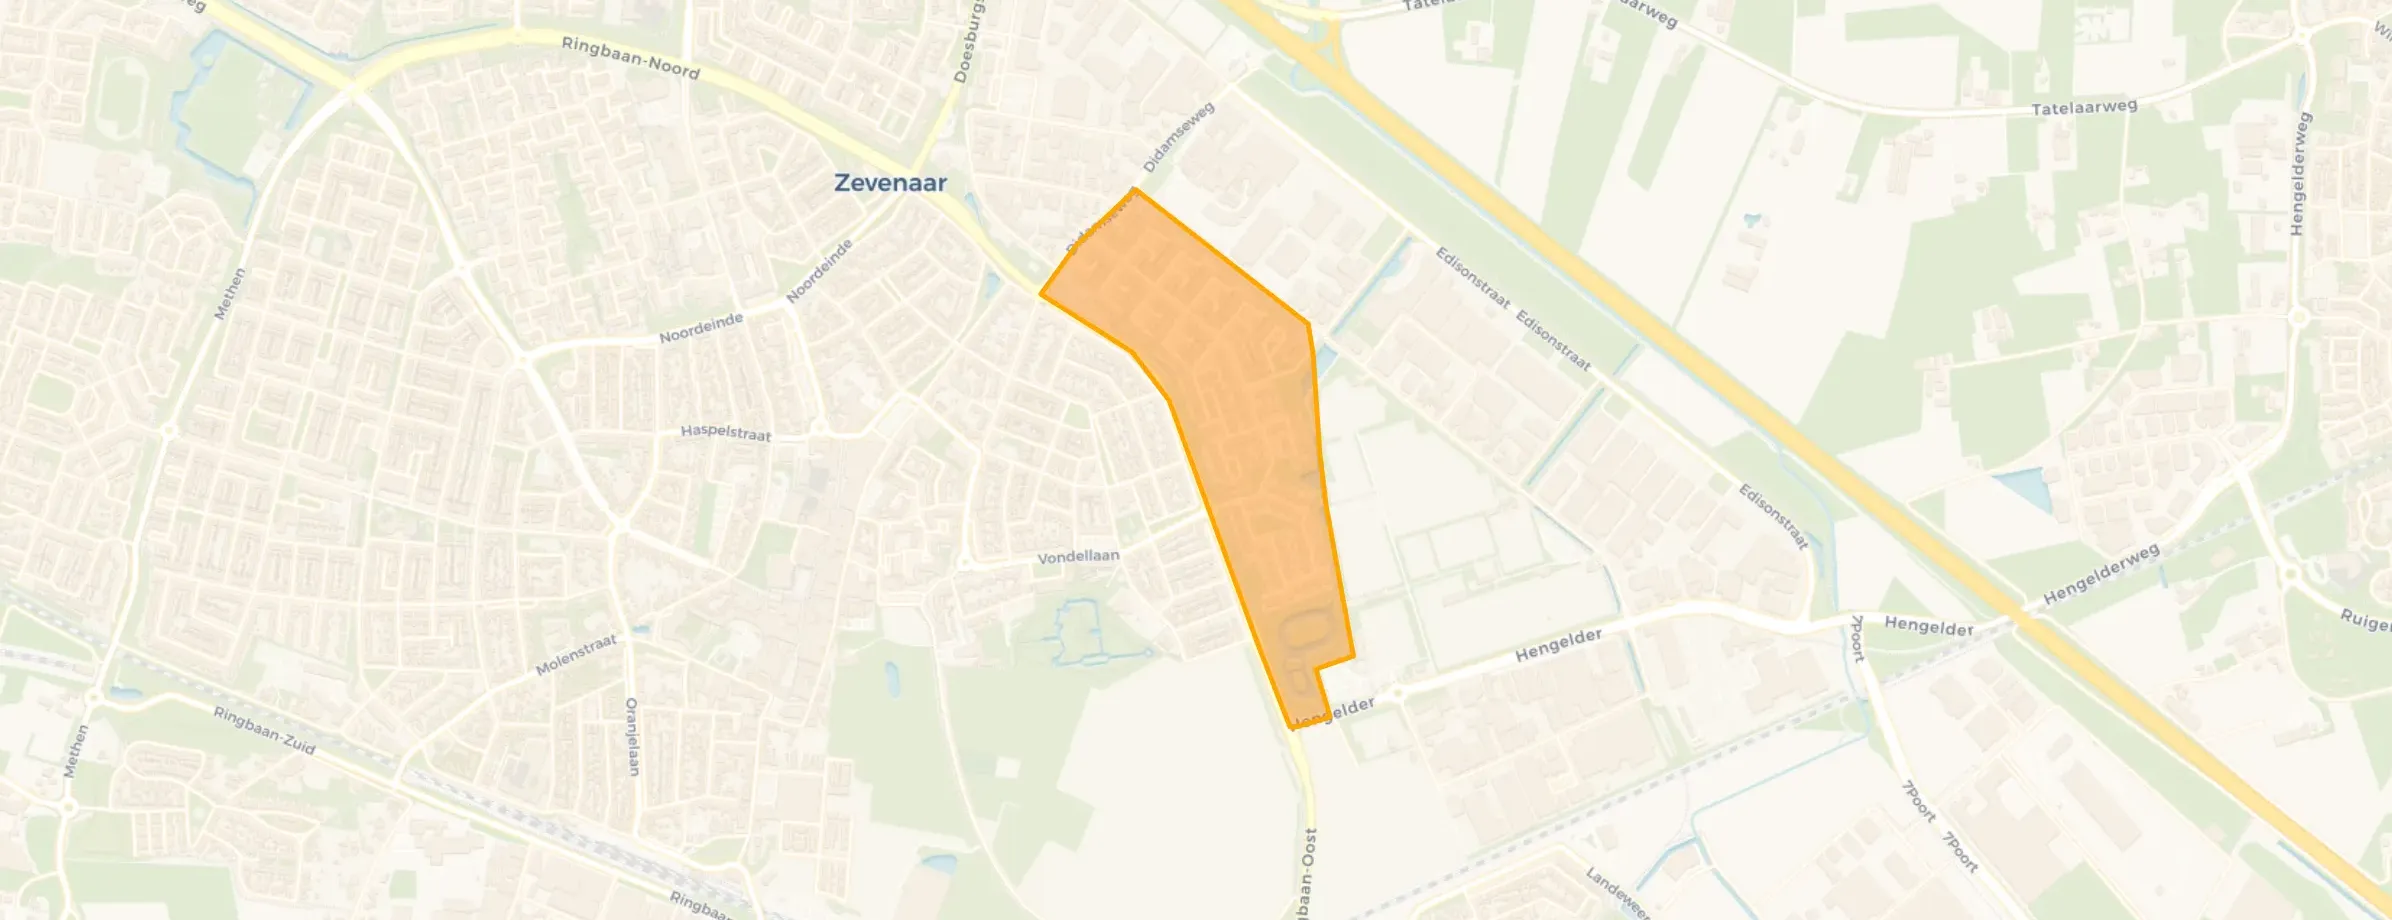
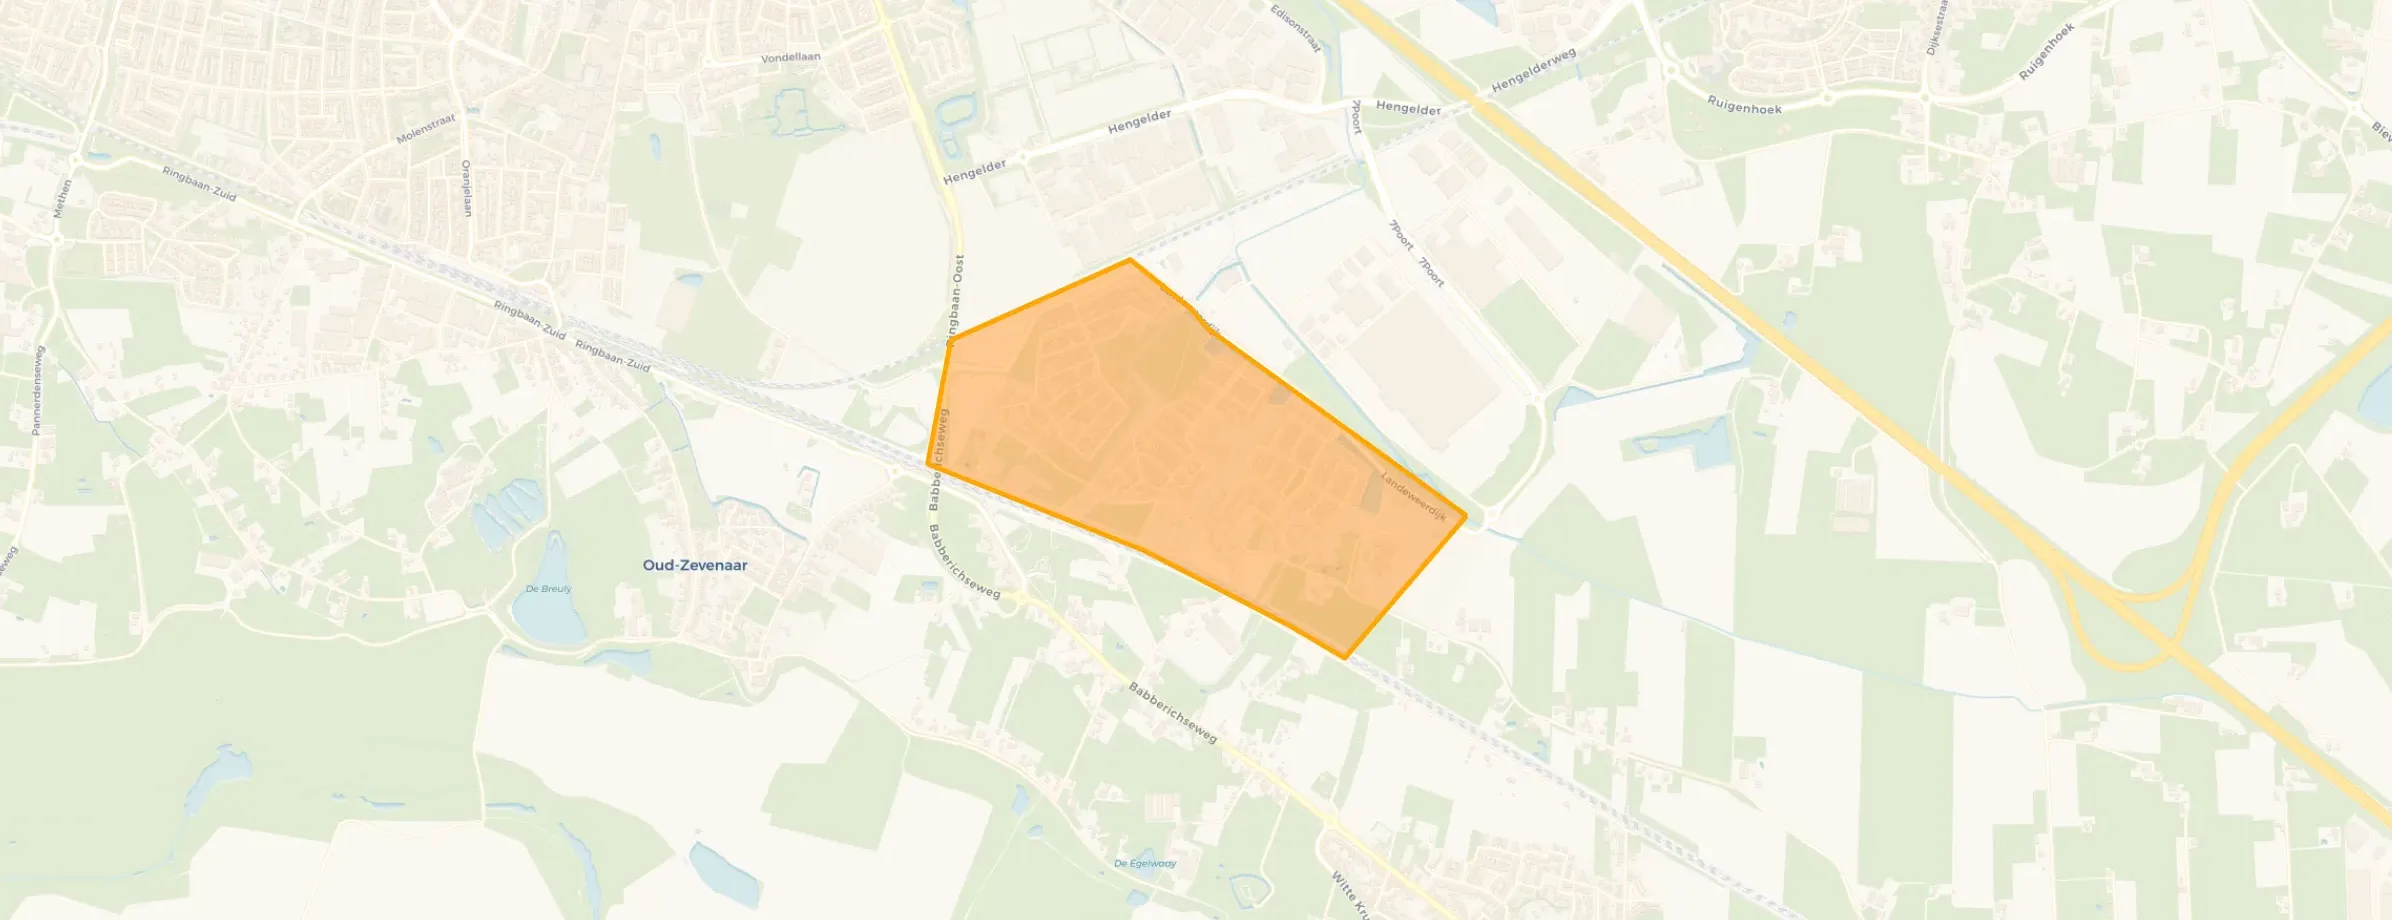
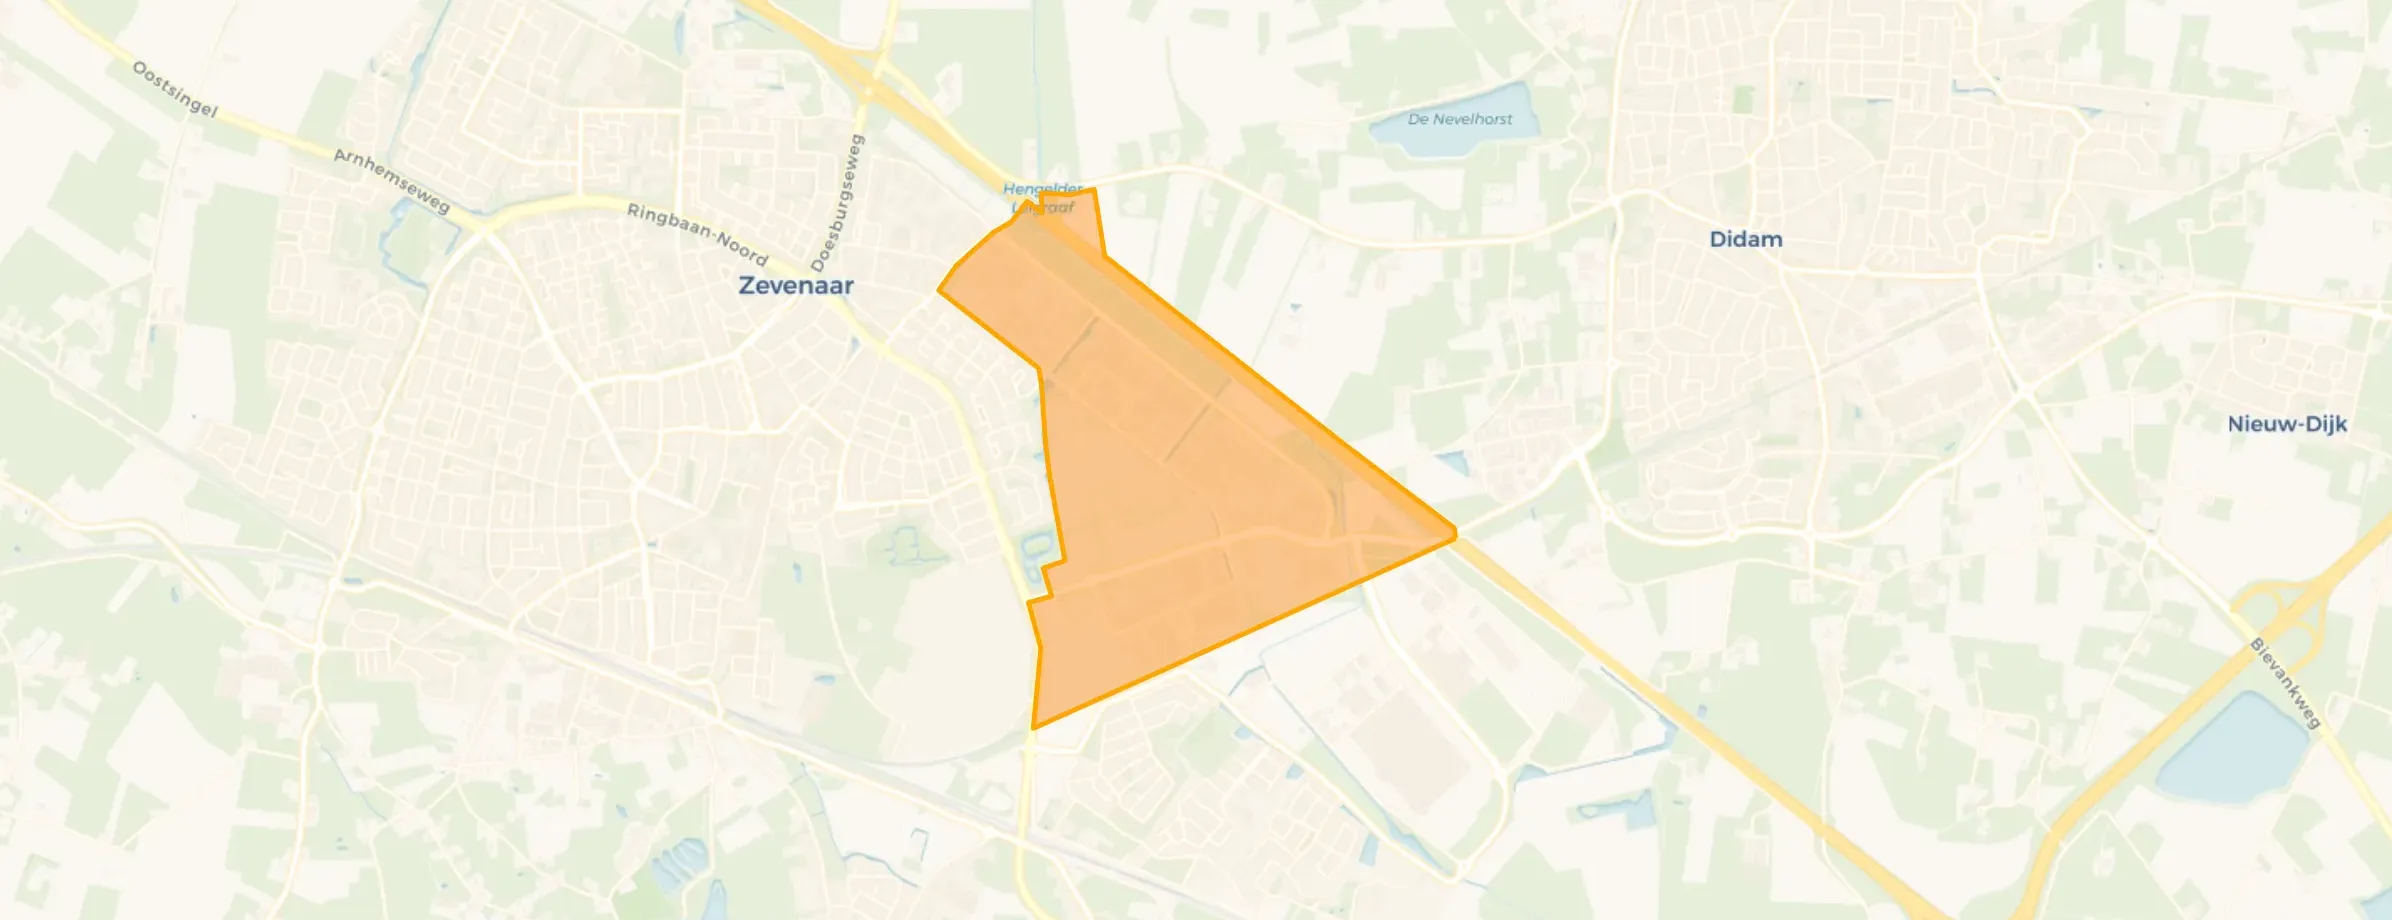
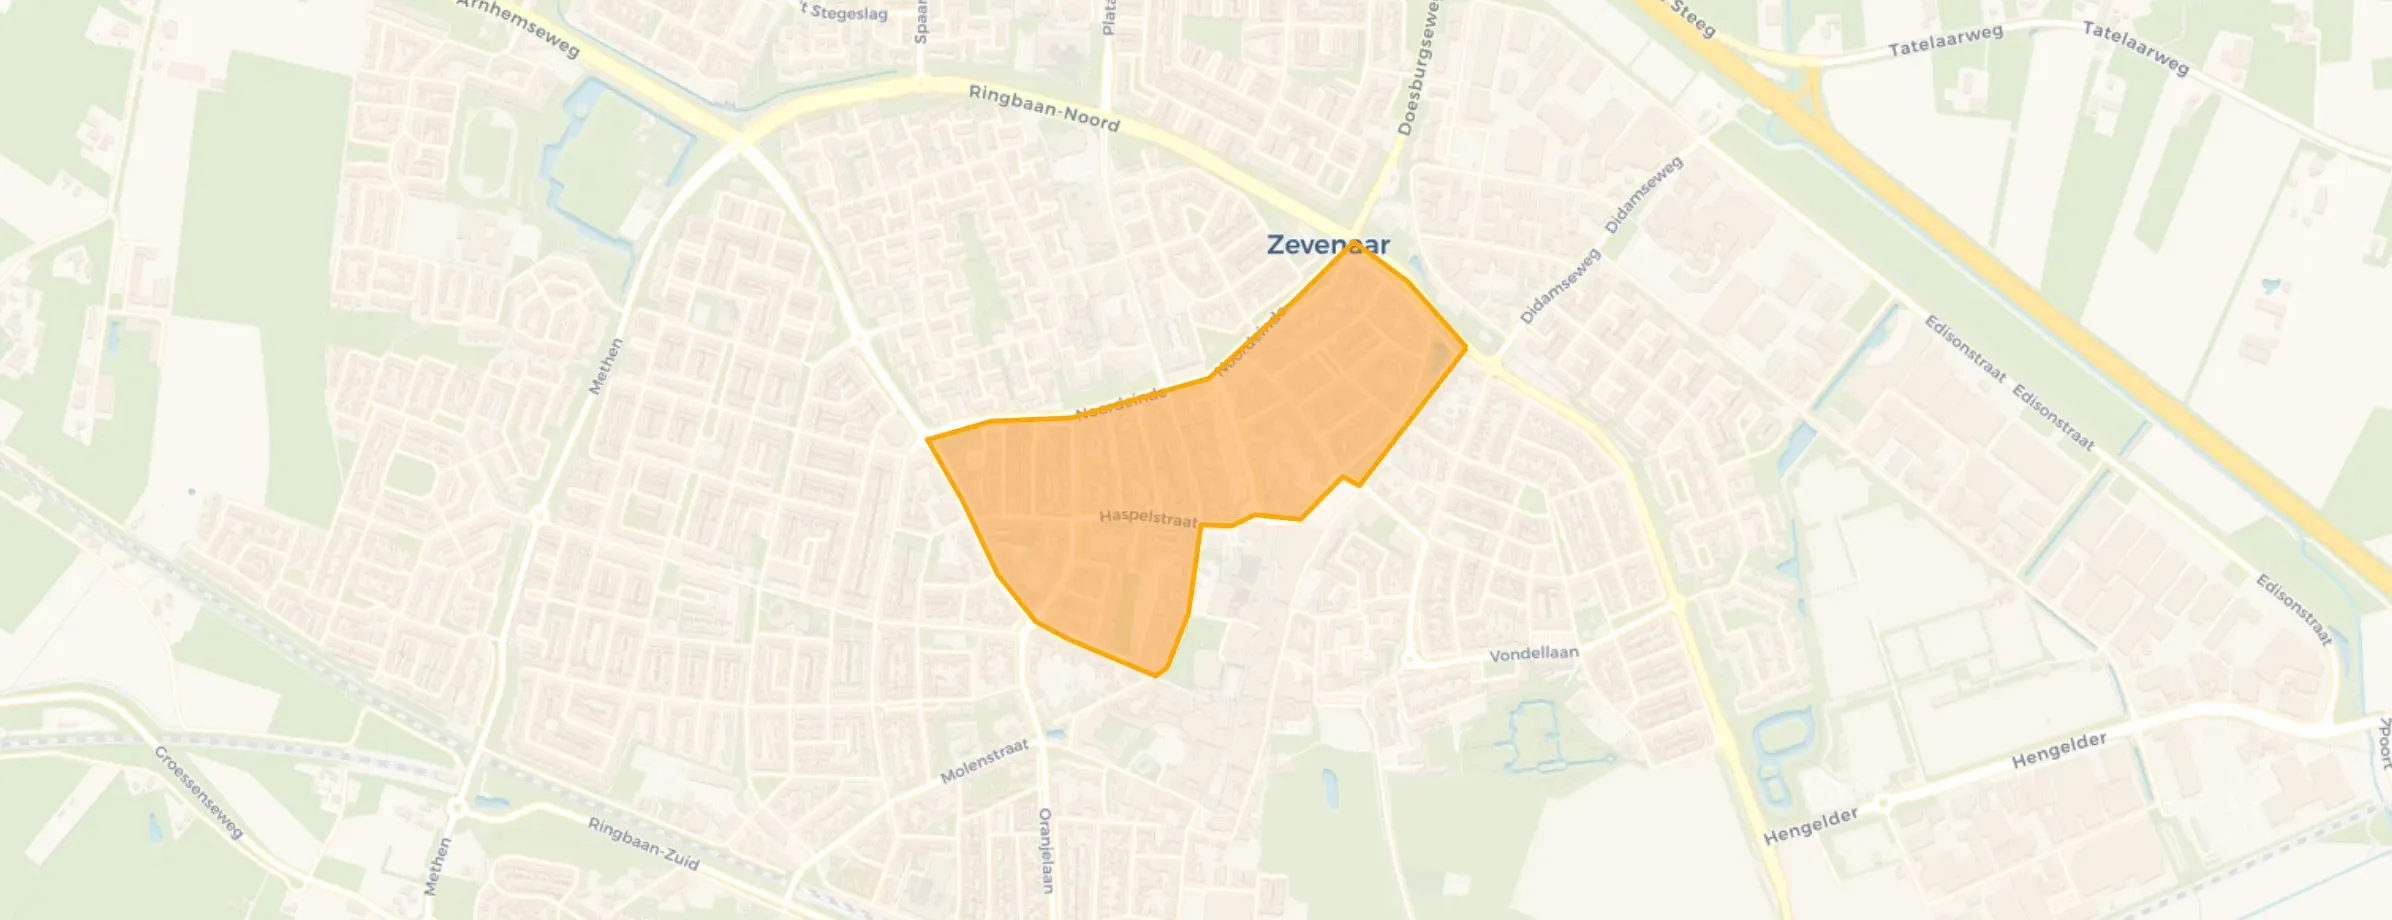
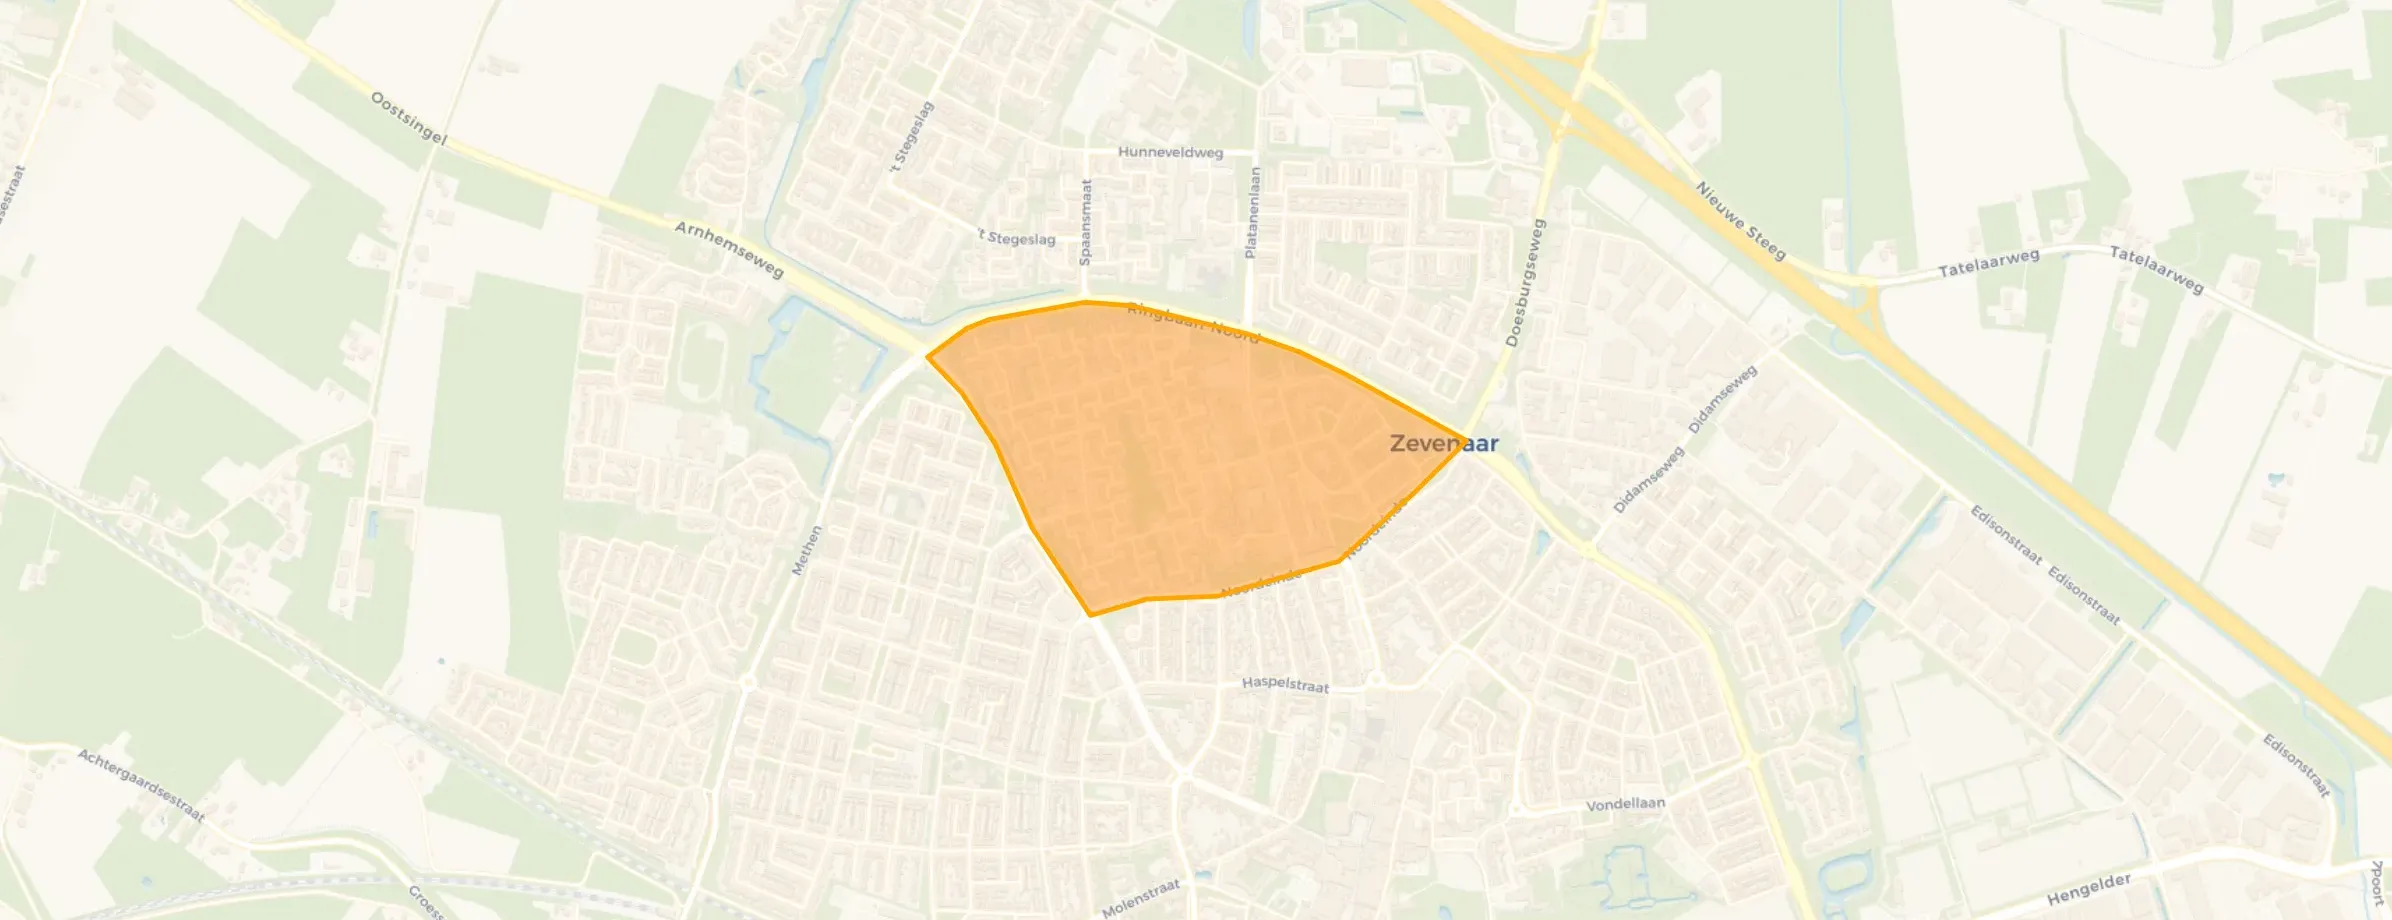
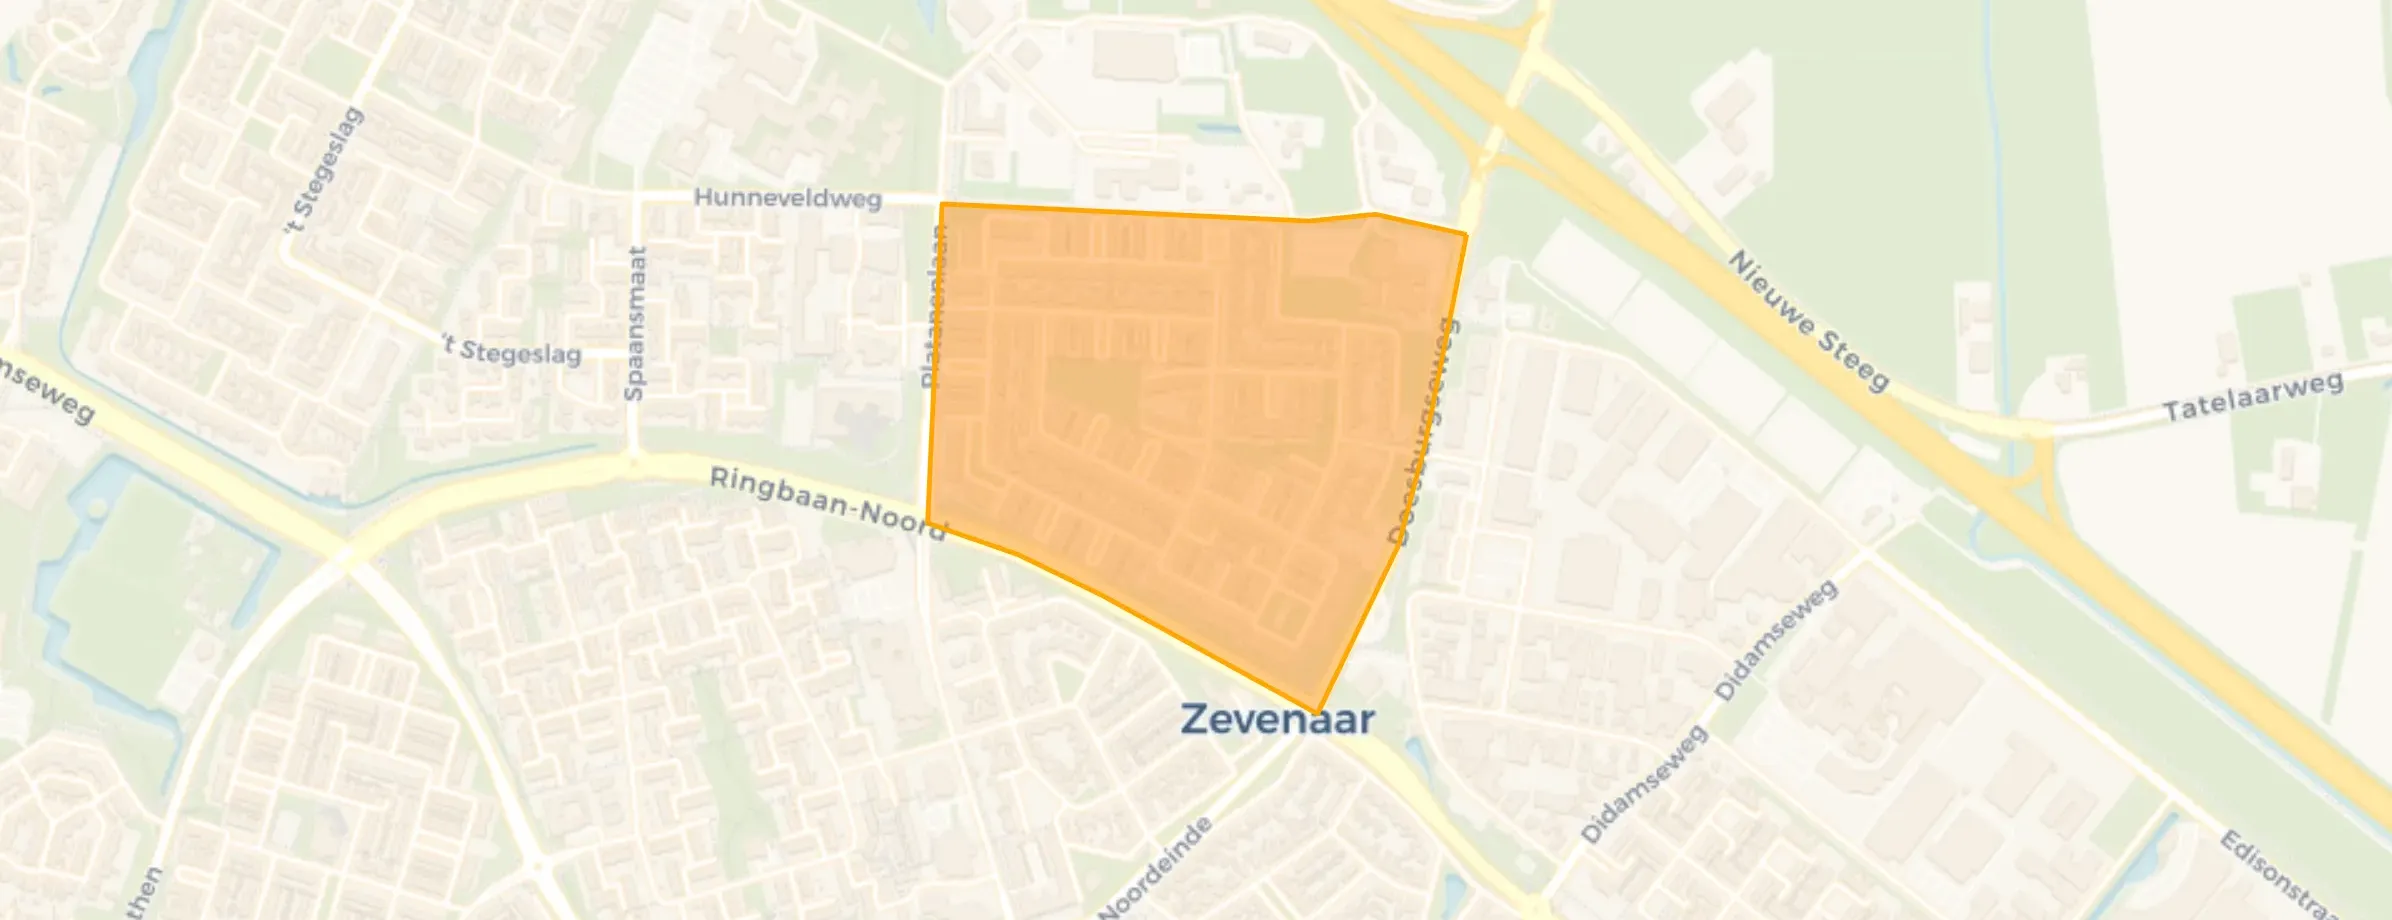
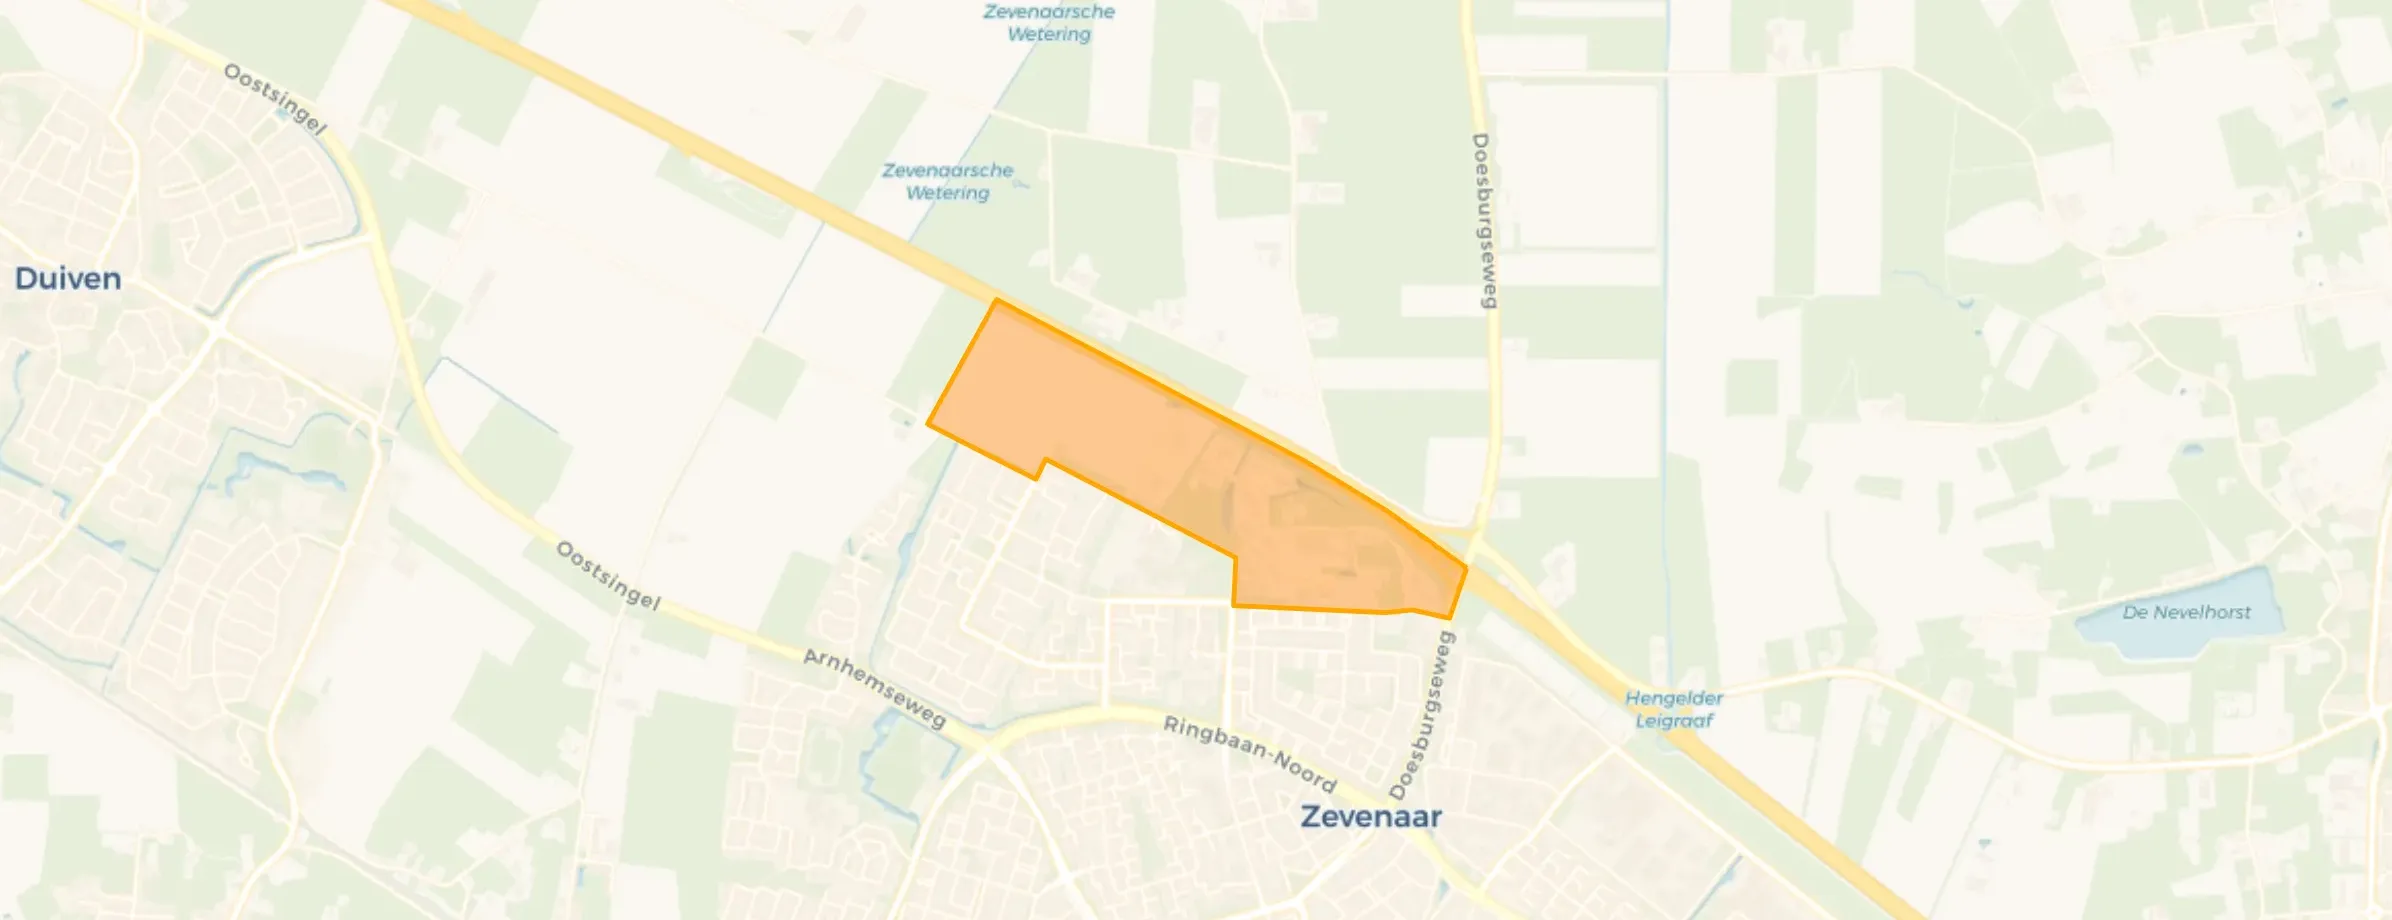
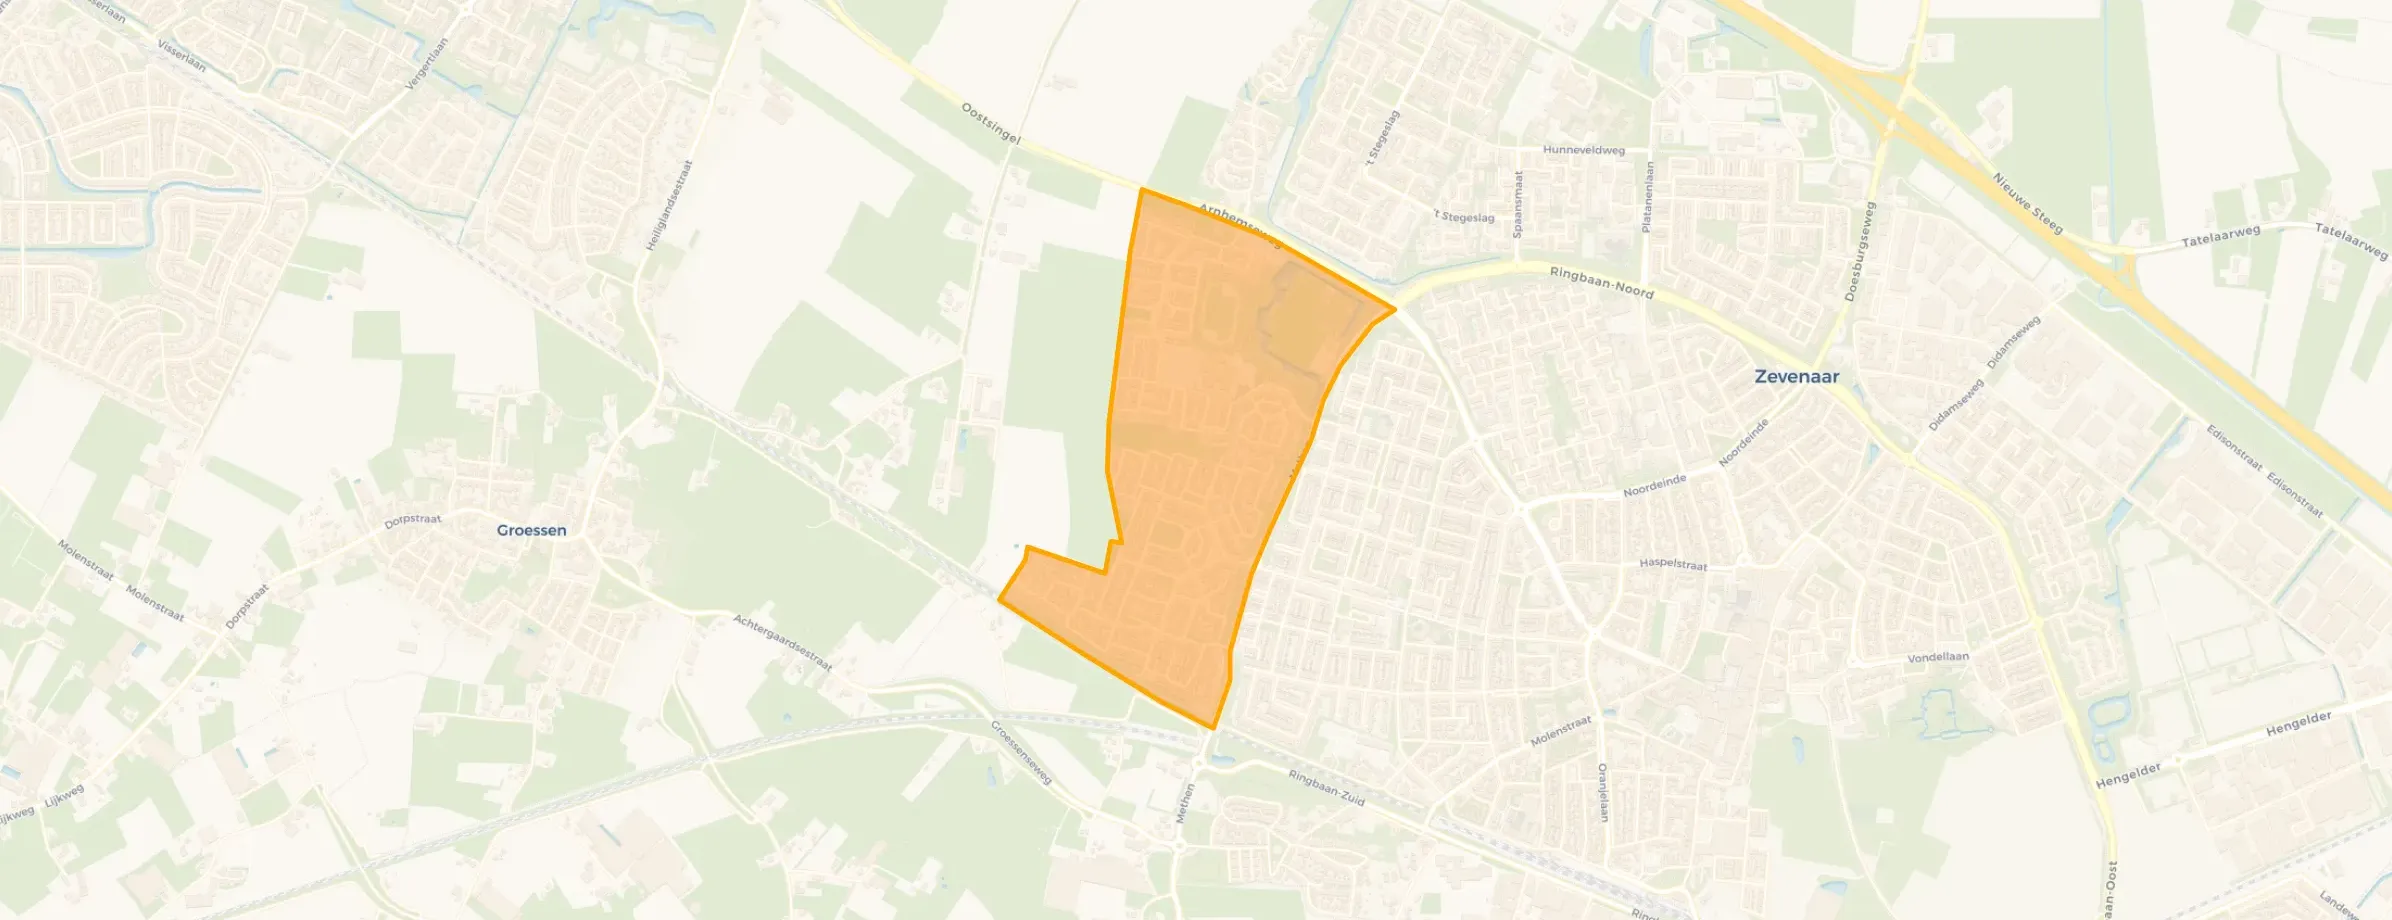
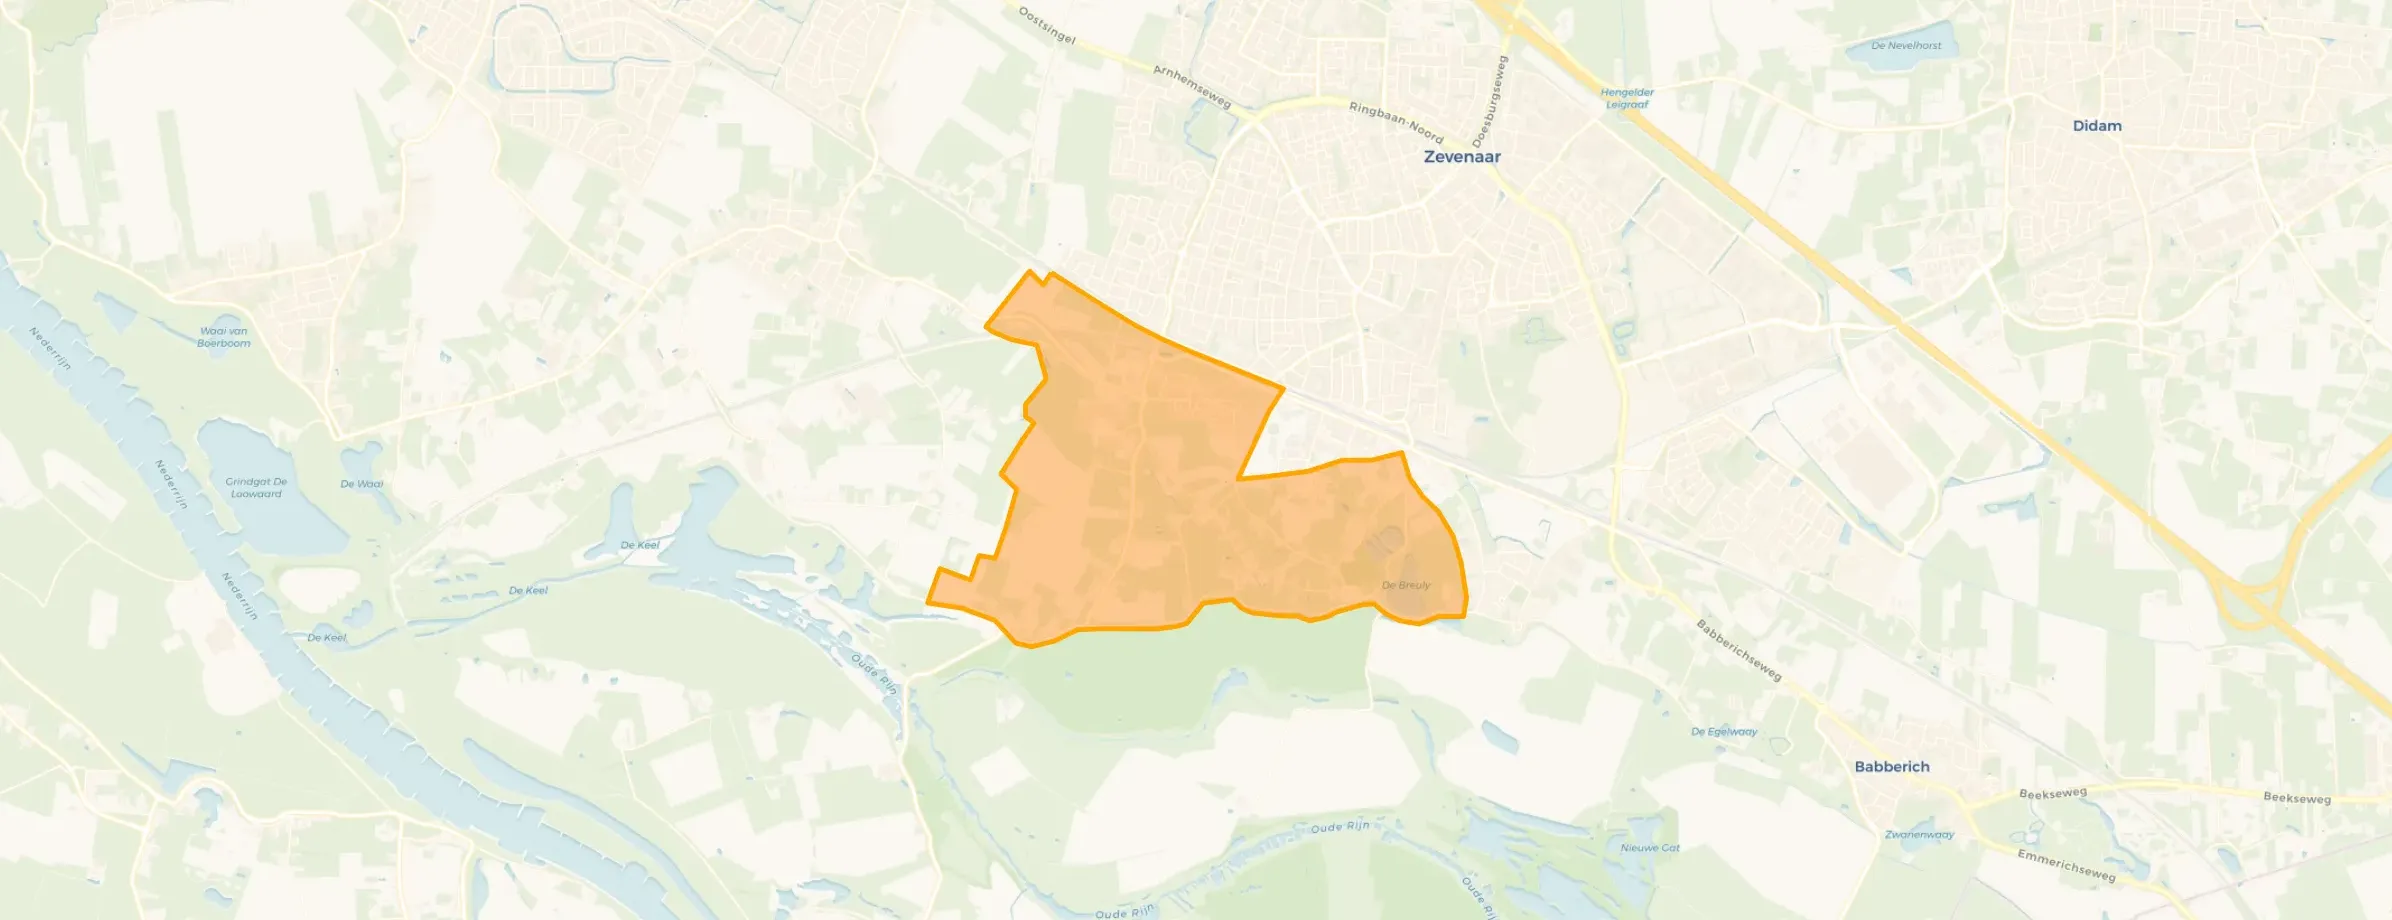
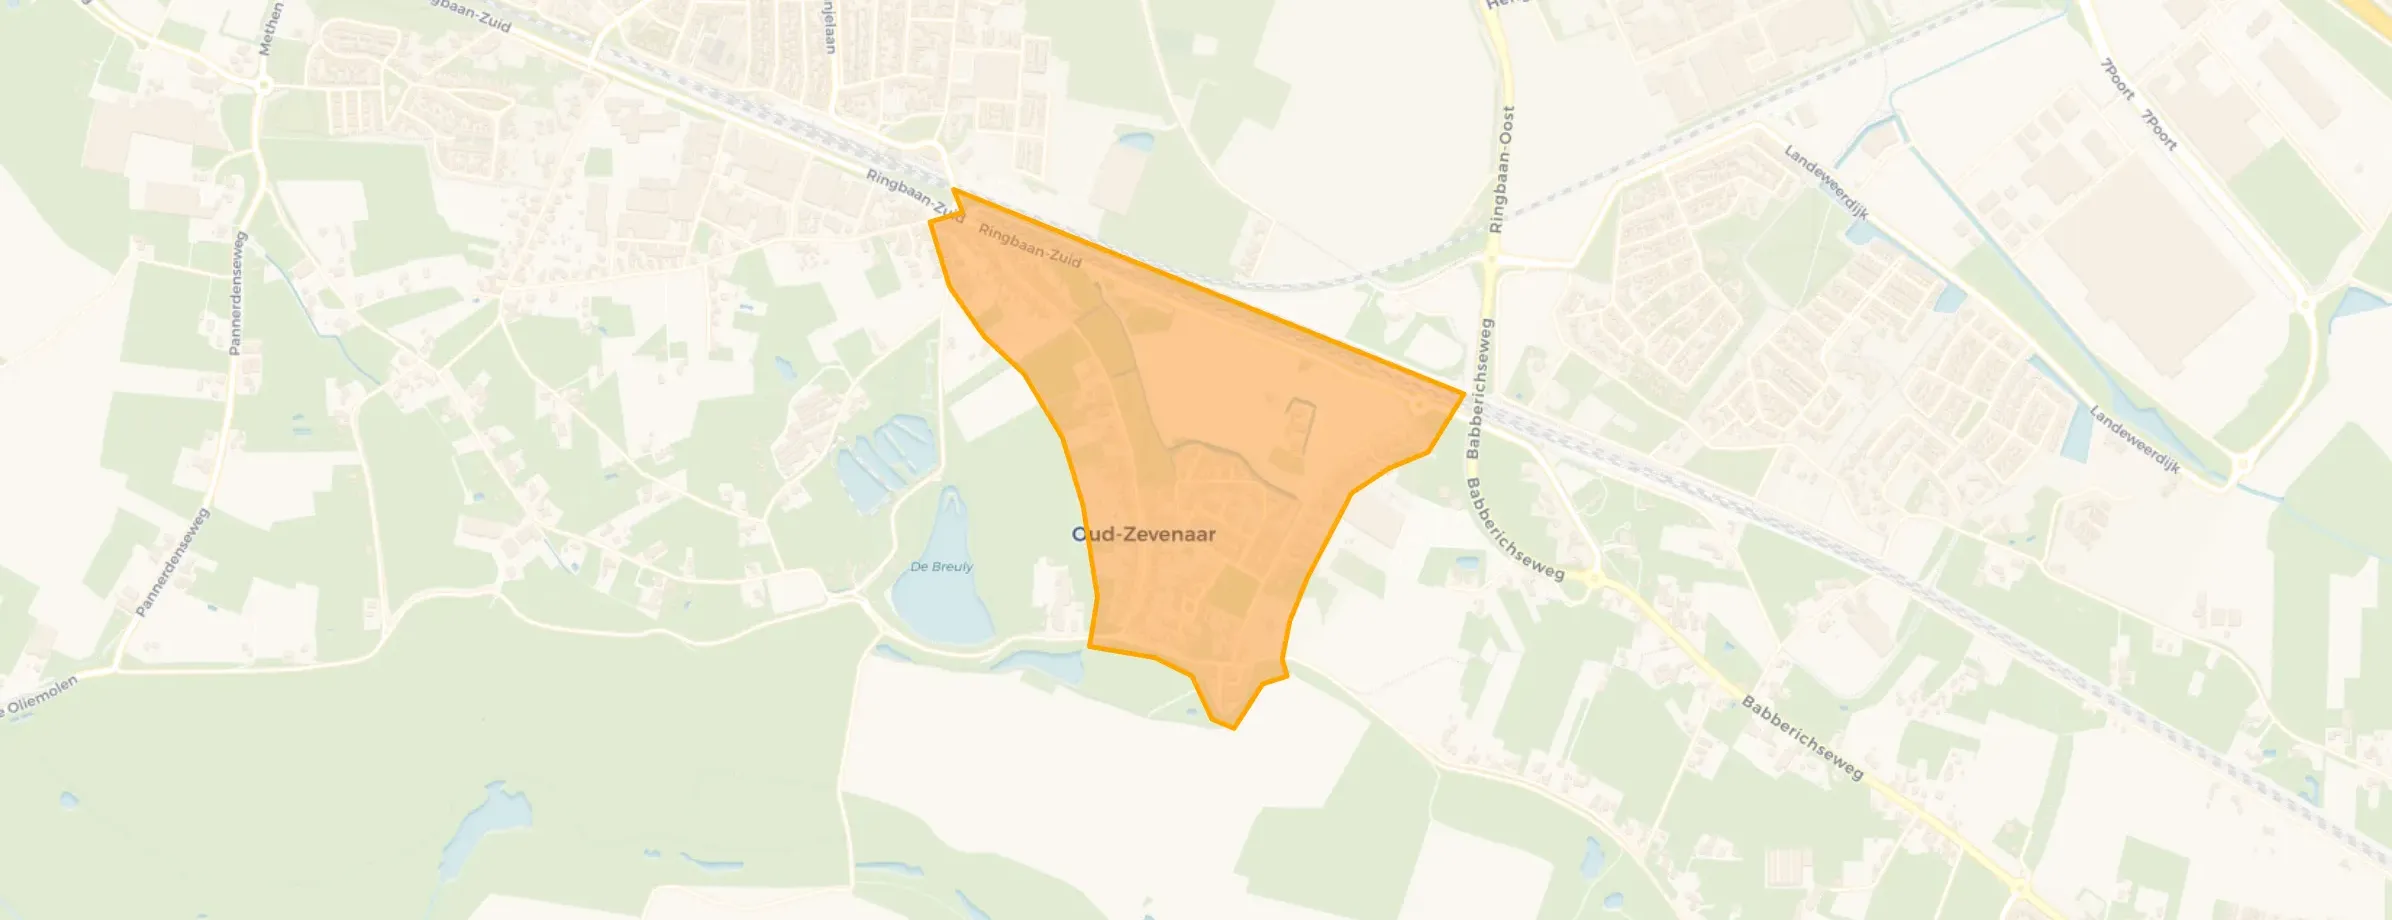
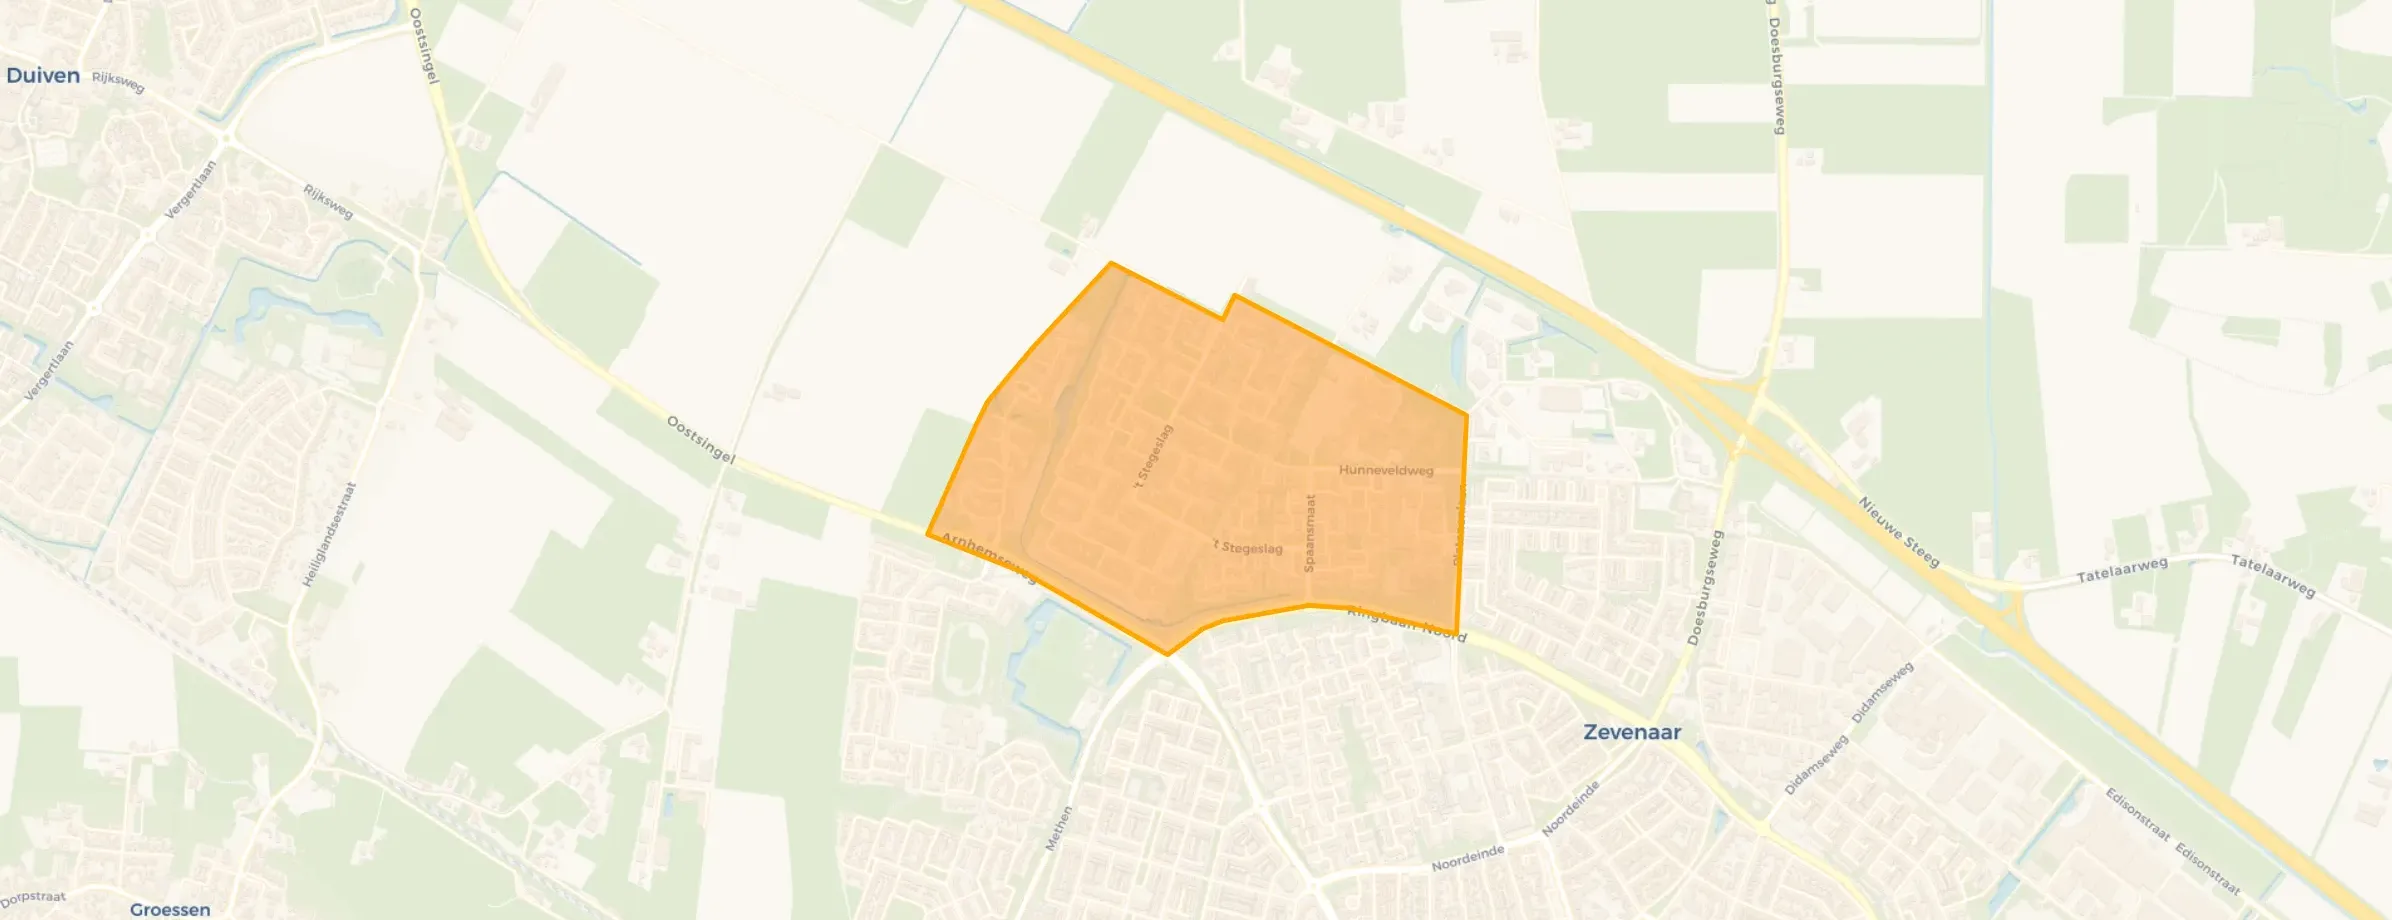
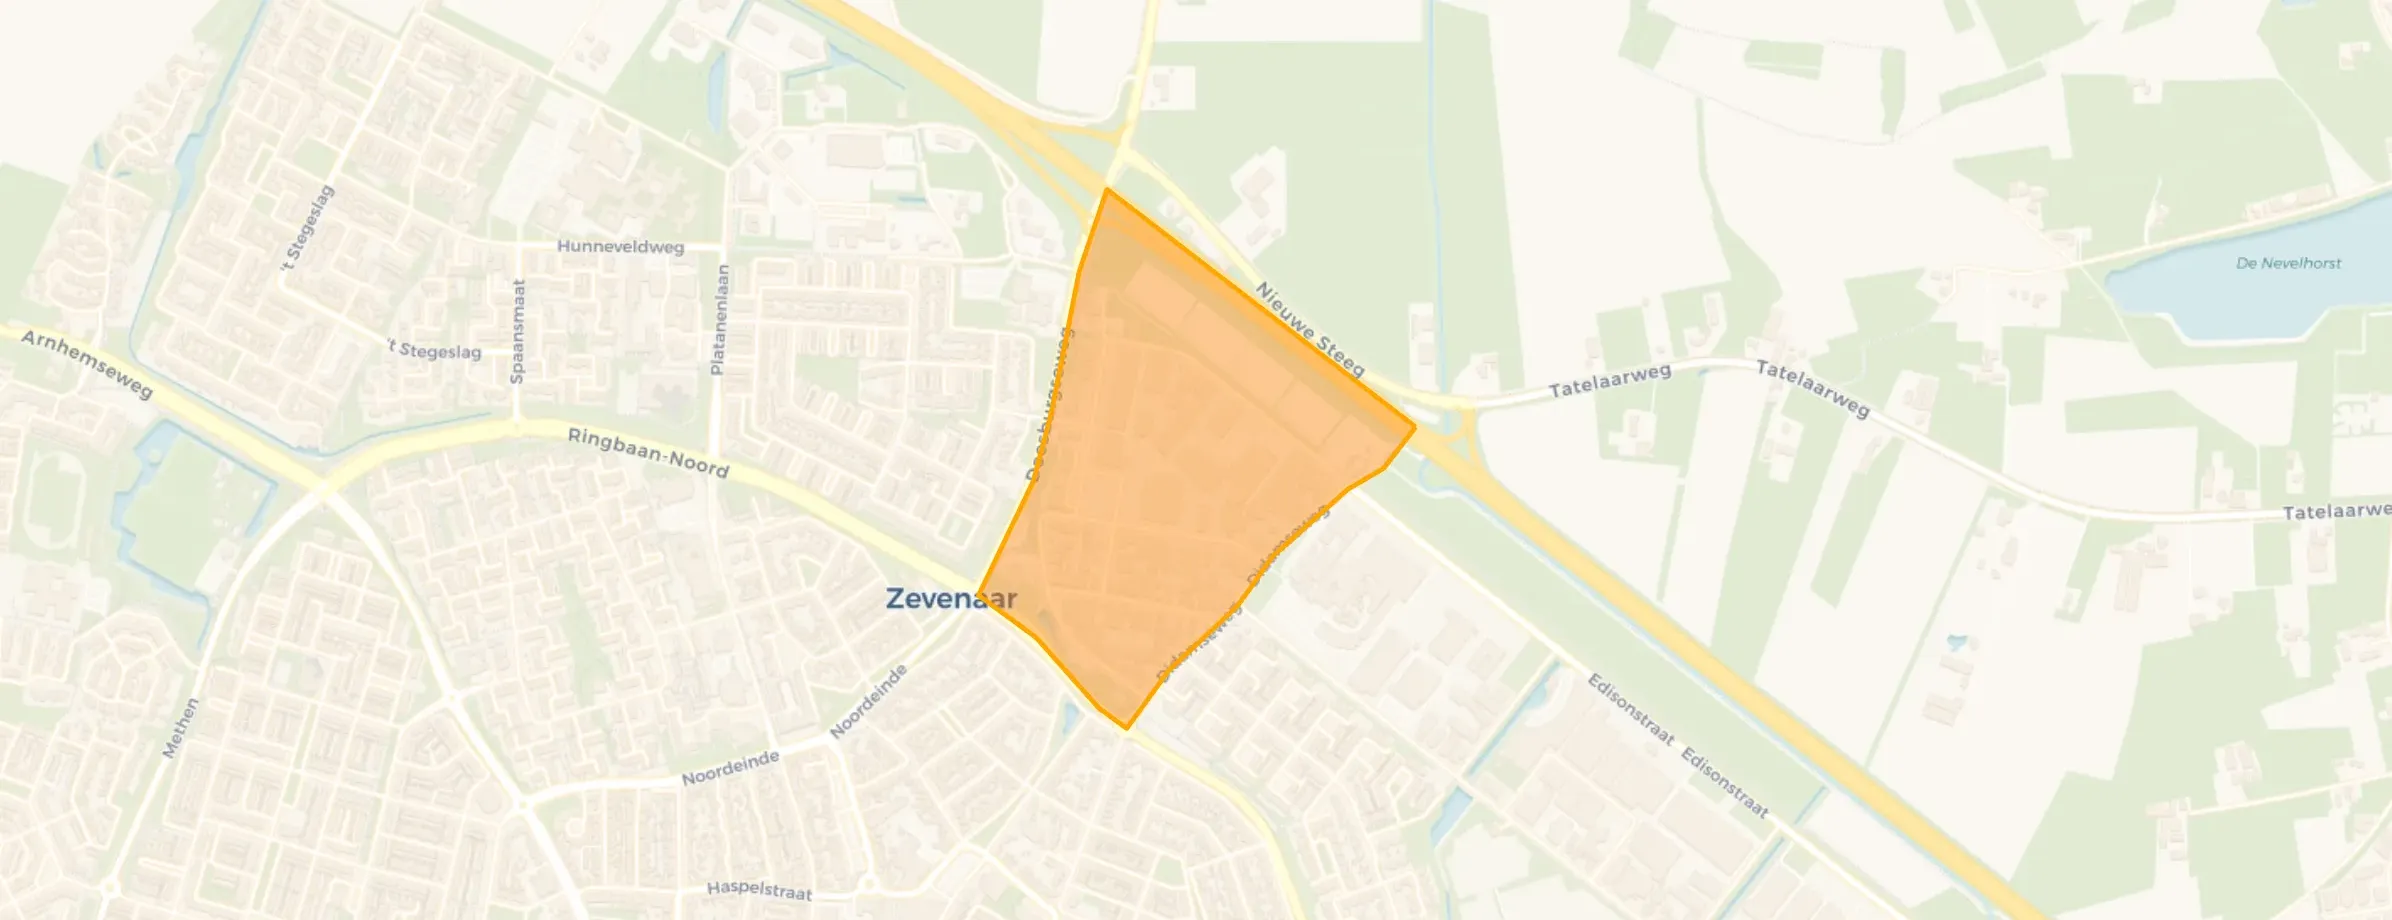
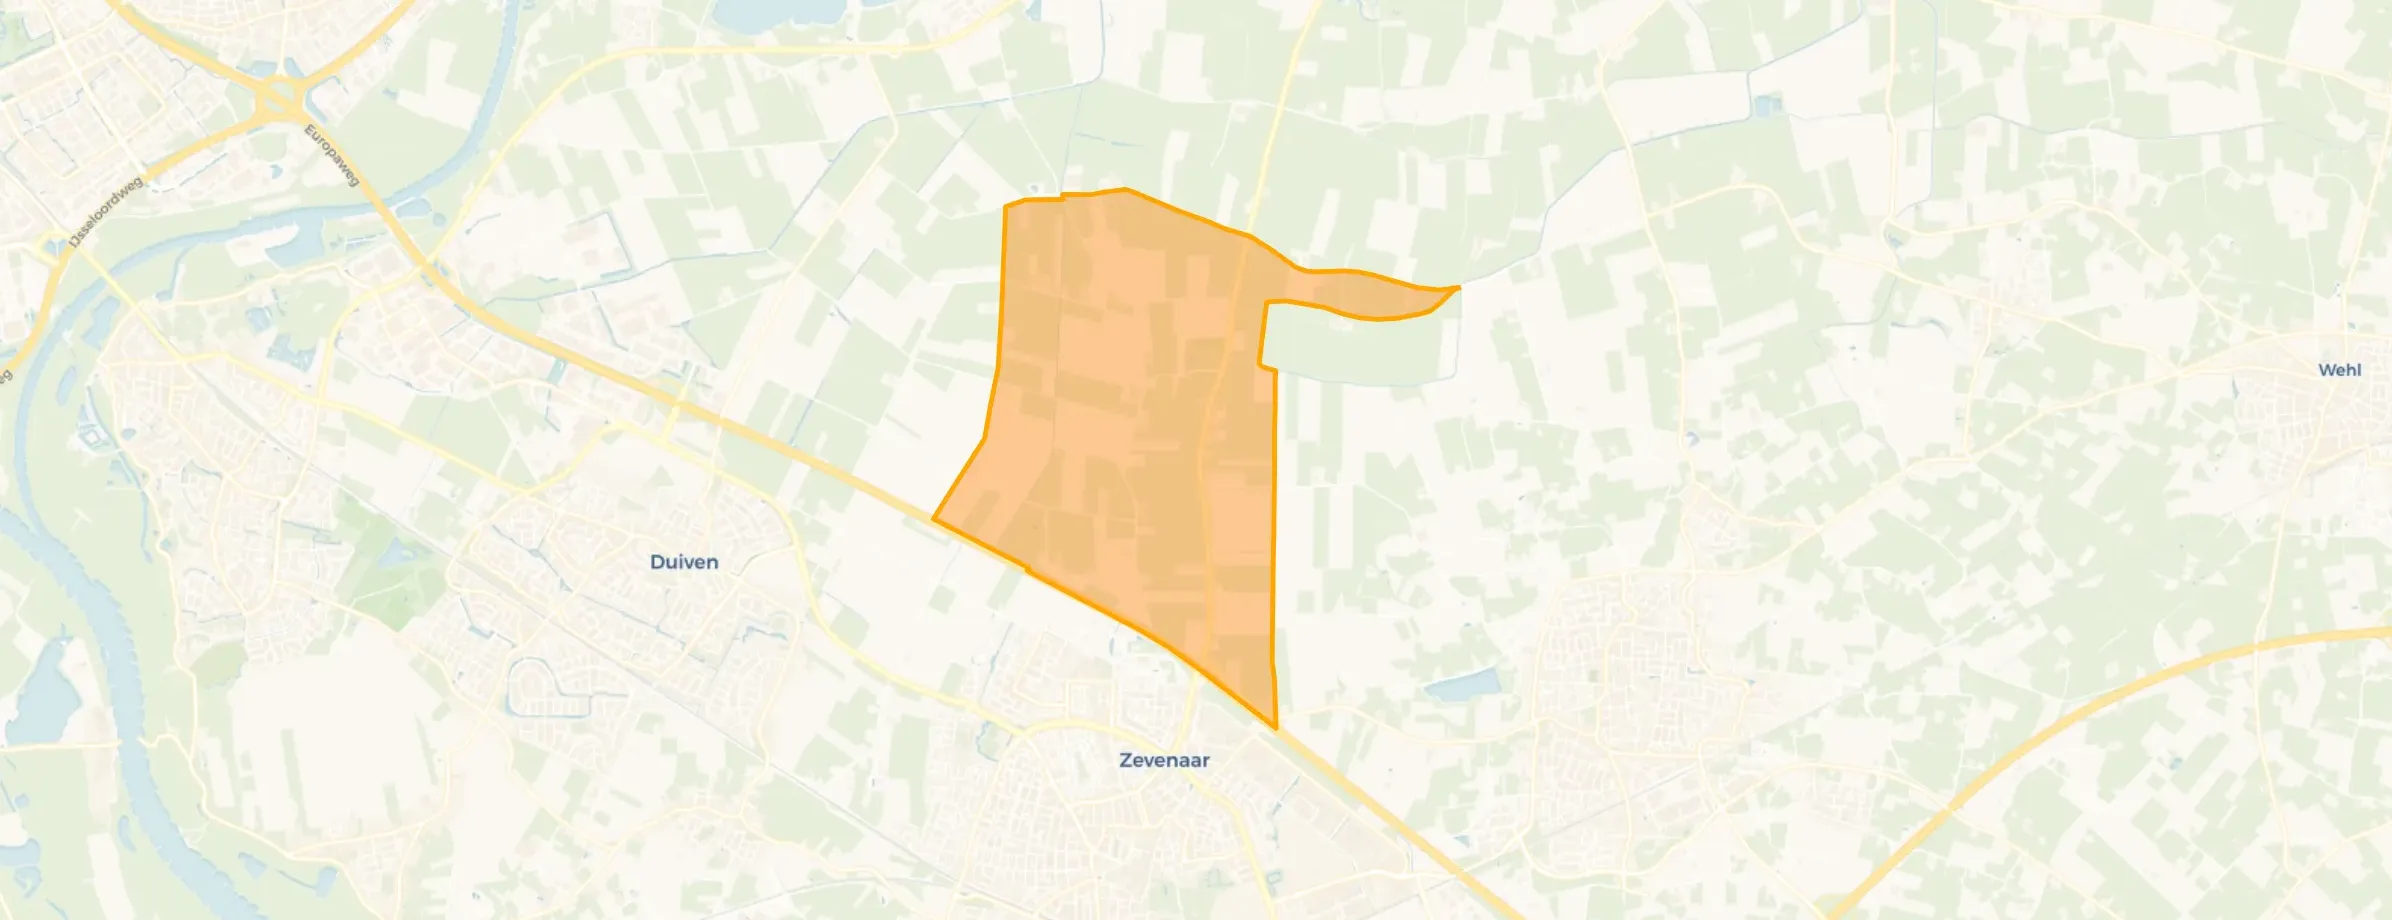
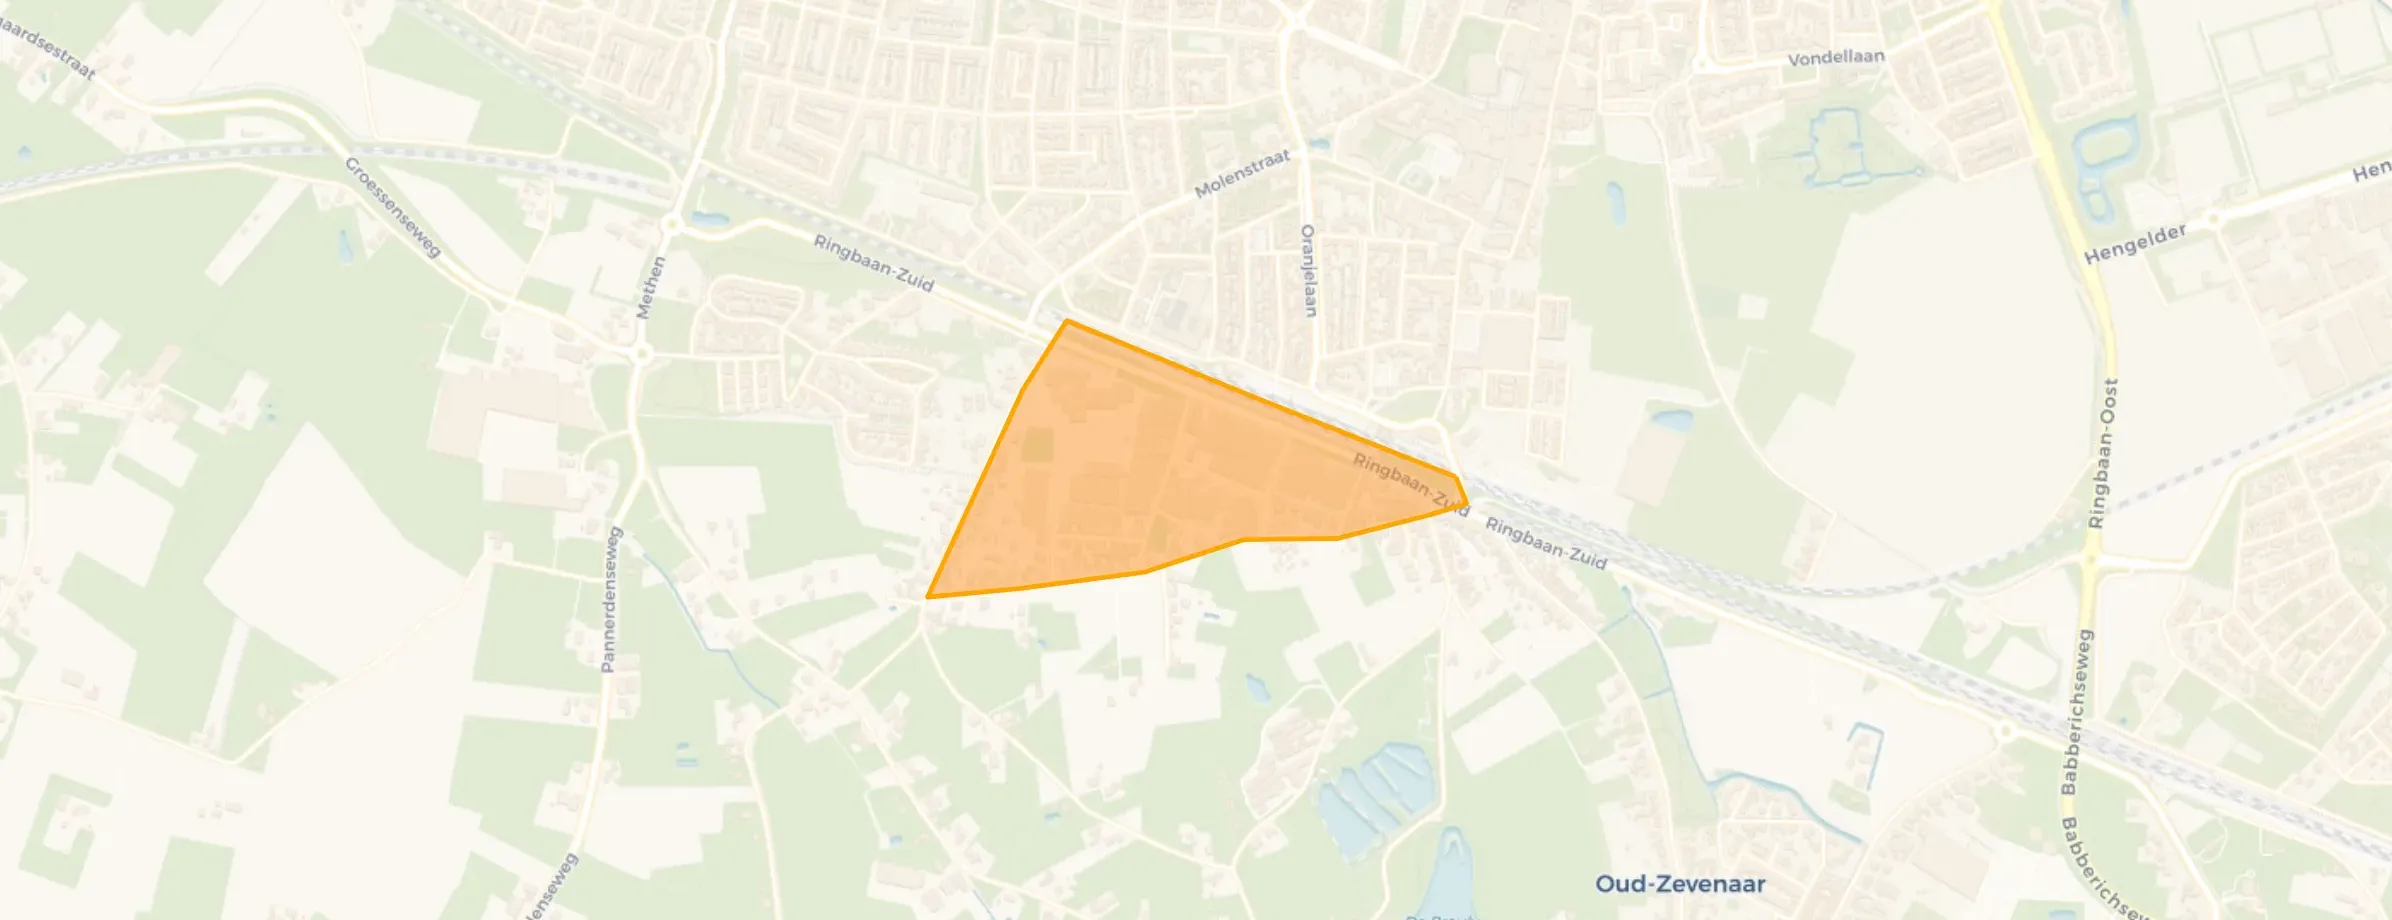
Zevenaar is located in the province of Gelderland, in the municipality of Zevenaar The district has a total area of 2.083 hectares, of which 2.074 hectares are land and 9 hectares are water. The district is coded as WK029900. The postcode area is 6901AA-6986CJ.
Zevenaar has 26.475 residents. Of these, 49,0% are men and 51,0% are women. Most residents are 45 to 65 years (25,7%). The other age groups are 25,3% for '65 years or older', 23,8% for '25 to 45 years', 14,9% for '0 to 15 years' and 10,2% for '15 to 25 years'. Of the residents, 44,7% is unmarried, 40,3% is married, 8,7% is divorced and 6,3% is widowed. 21.265 residents originate from the Netherlands, 1.925 come from Europe and 3.285 come from countries outside Europe.
There are 12.230 households in Zevenaar. 36,0% of these are single-person households, 31,4% households without children and 32,6% households with children. The average household size is 2,1 persons. The national average is 2,1 persons.
In Zevenaar there are 21.800 income recipients. The average income per income recipient is €38.200, which is €4.000 (9%) lower than the national average of €42.200. Per resident, the average income is €32.000, which is €2.900 (8%) lower than the national average of €34.900. Most residents of Zevenaar are educated to an intermediate level. 46,3% have an intermediate education (HAVO, VWO or MBO 2-4), 27,4% have a university or higher professional education (HBO/WO) and 26,3% have a lower education (VMBO or MBO 1).
Of the 26.475 residents, around 71% are in paid employment, which amounts to 18.797 people. This is 1% lower than the national average of 72%. The majority of workers are in salaried employment (88%), while 12% are self-employed. In Zevenaar, 31% of residents receive a benefit. The largest group is those receiving a state pension (AOW). 6.100 people receive this benefit.
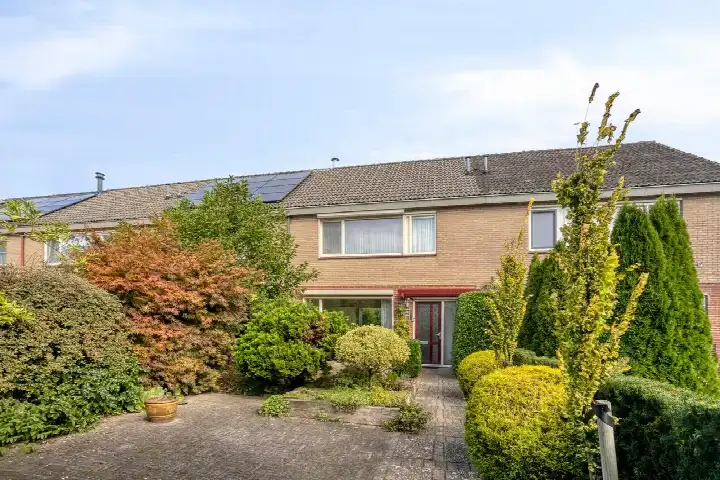
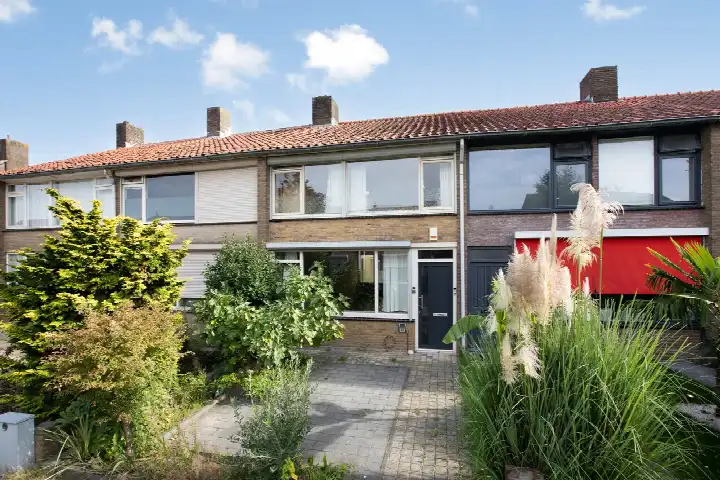
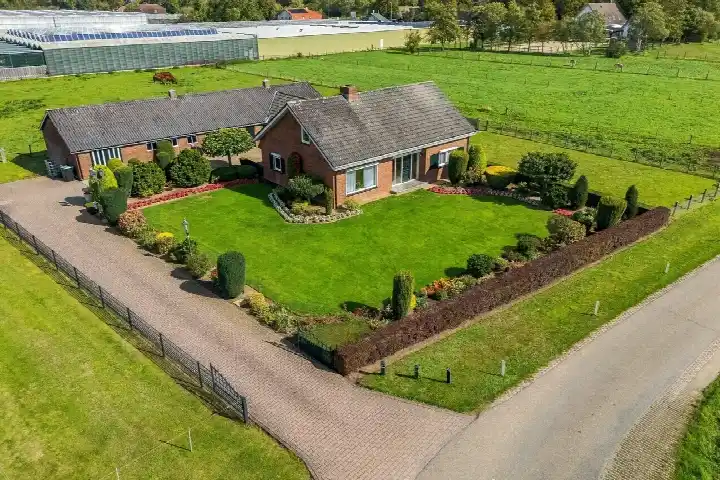
In Zevenaar there are 12.374 homes with an average assessed value (WOZ) of €323.000. Of these, around 98% are occupied and 2% unoccupied. Most homes are owner-occupied. This amounts to 38% rental homes and 62% owner-occupied homes. Of the homes, 63% privately owned, 29% owned by housing associations and 8% owned by other landlords. The most common construction periods in Zevenaar are 1970-1980 (29%) and 1950-1970 (26%).
There are currently no homes for sale in Zevenaar. The most recently listed home is Van Oldenbarneveldtlaan 18 by GABA Makelaardij op Funda. No homes were sold in Zevenaar over the past year.
There are currently no homes for rent in Zevenaar. The most recent home is Markt 35, offered by Spitman Makelaars. No homes were let in Zevenaar over the past year.
No recent rental data available for Zevenaar.
In Zevenaar there are 8.775 addresses with a registered energy label. The most common labels are A (32%), C (26%) and B (15%). On average, an address in Zevenaar uses 2.640 kWh of electricity per year. This is 4% above the national average of 2.550 kWh. With an annual consumption of 790 m³ per address, natural gas consumption is 1% below the national average of 800 m³.
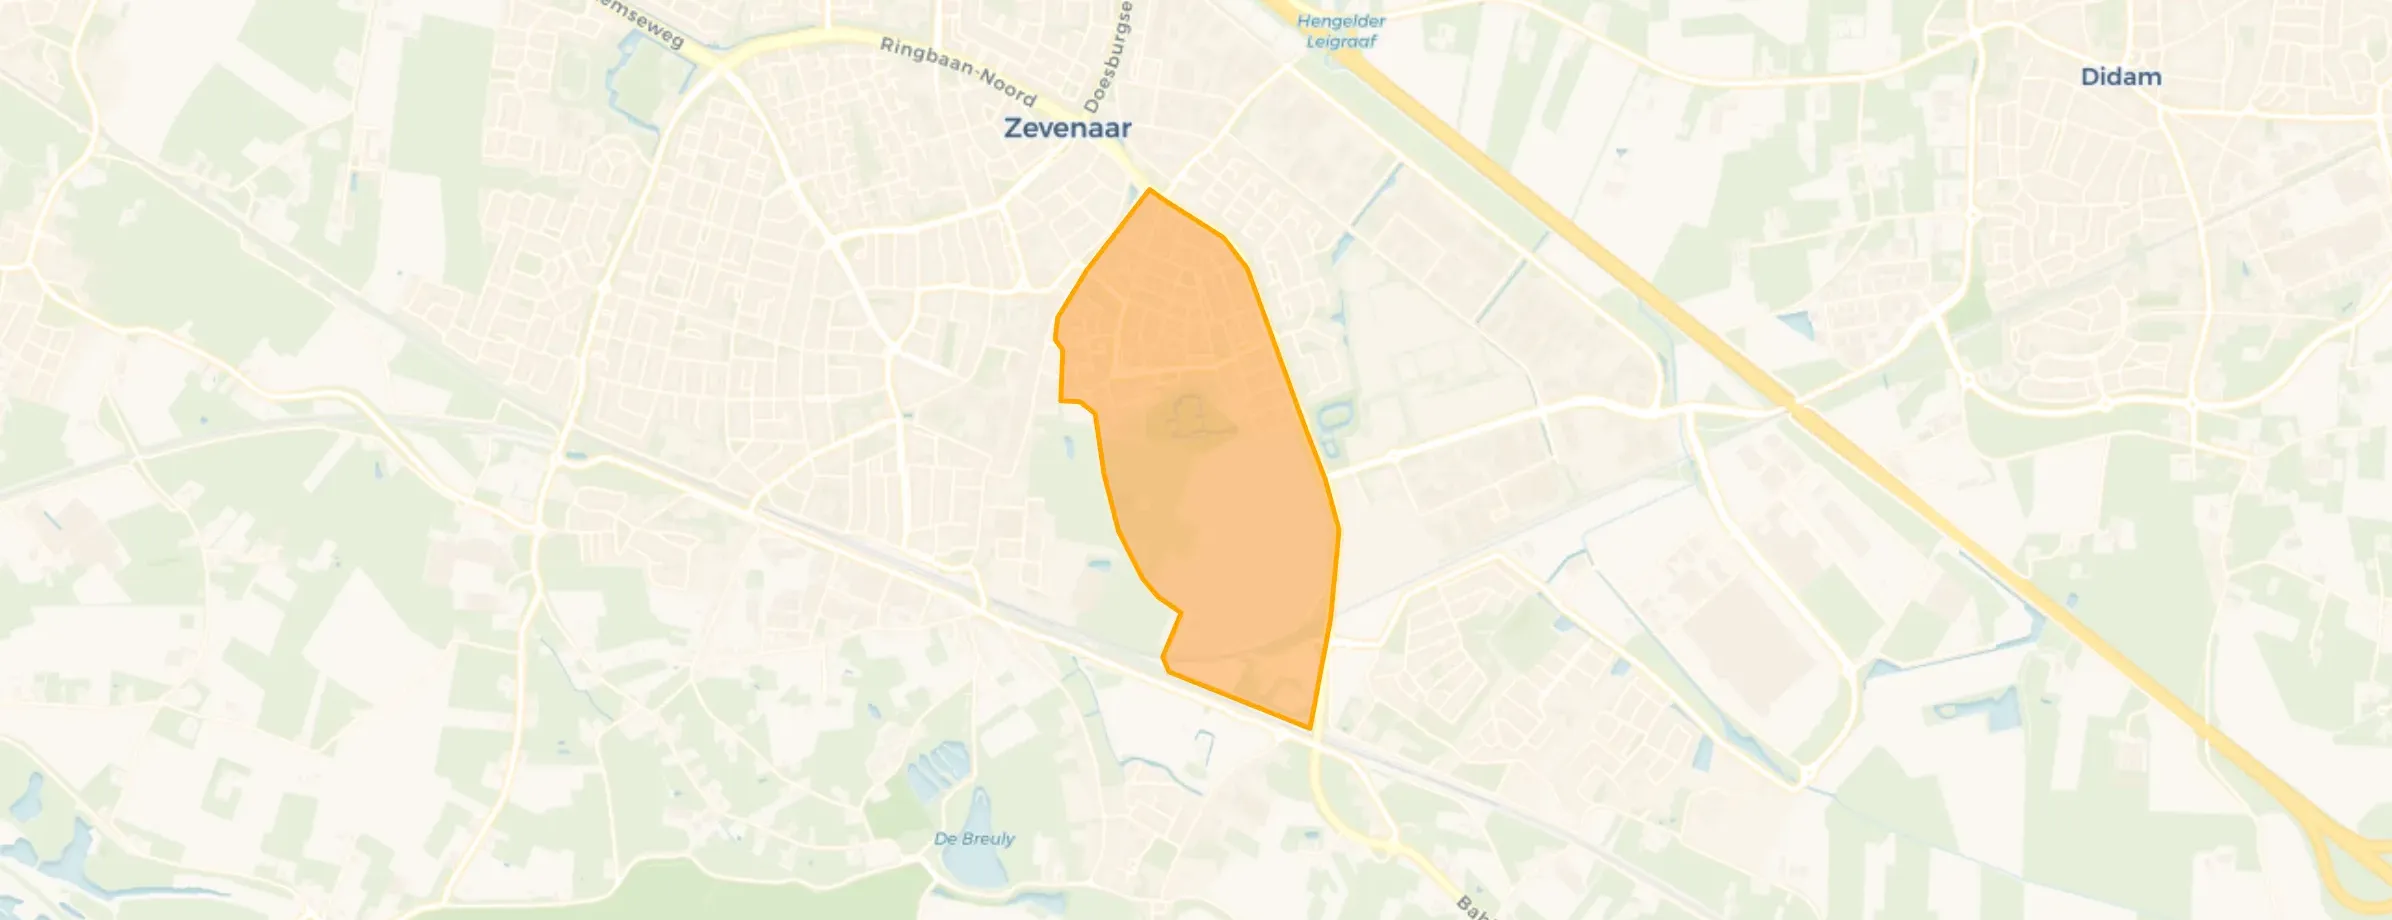

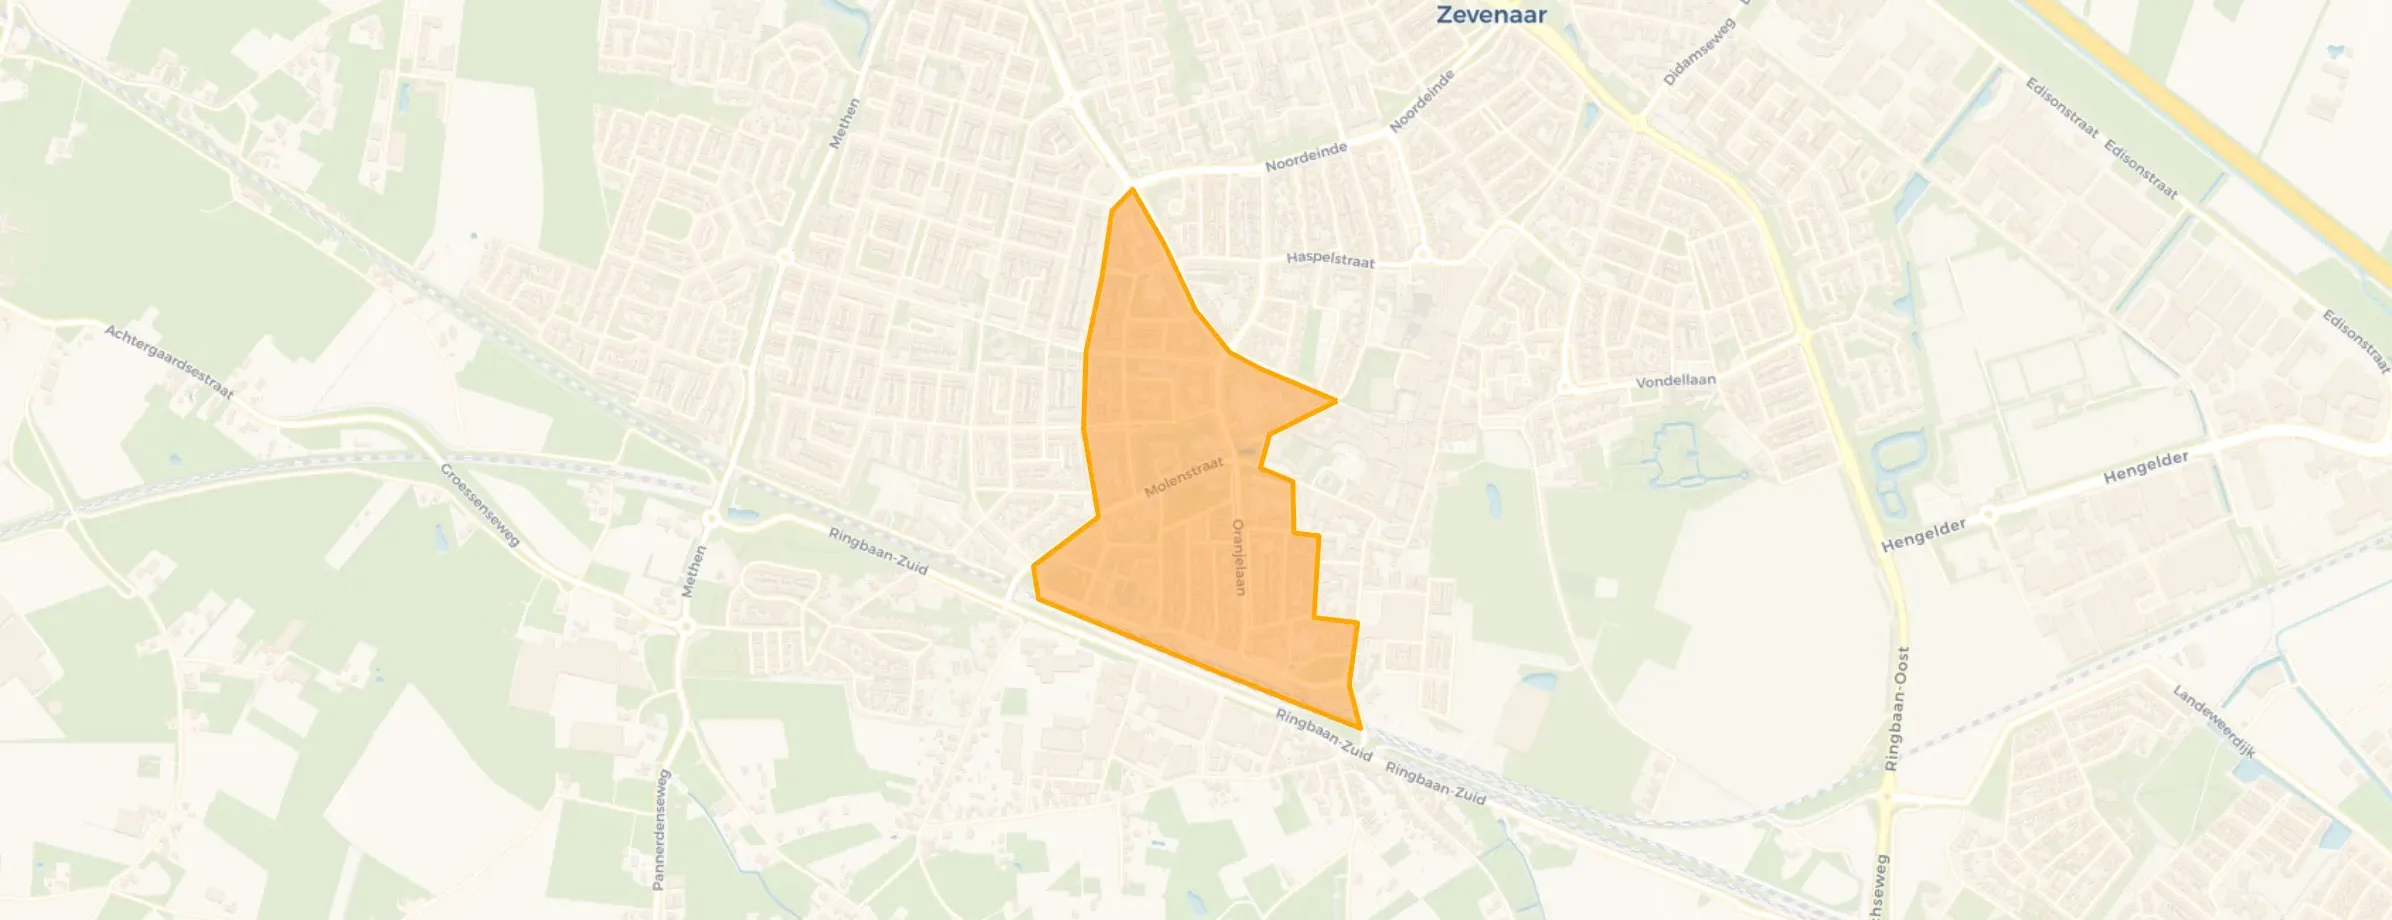
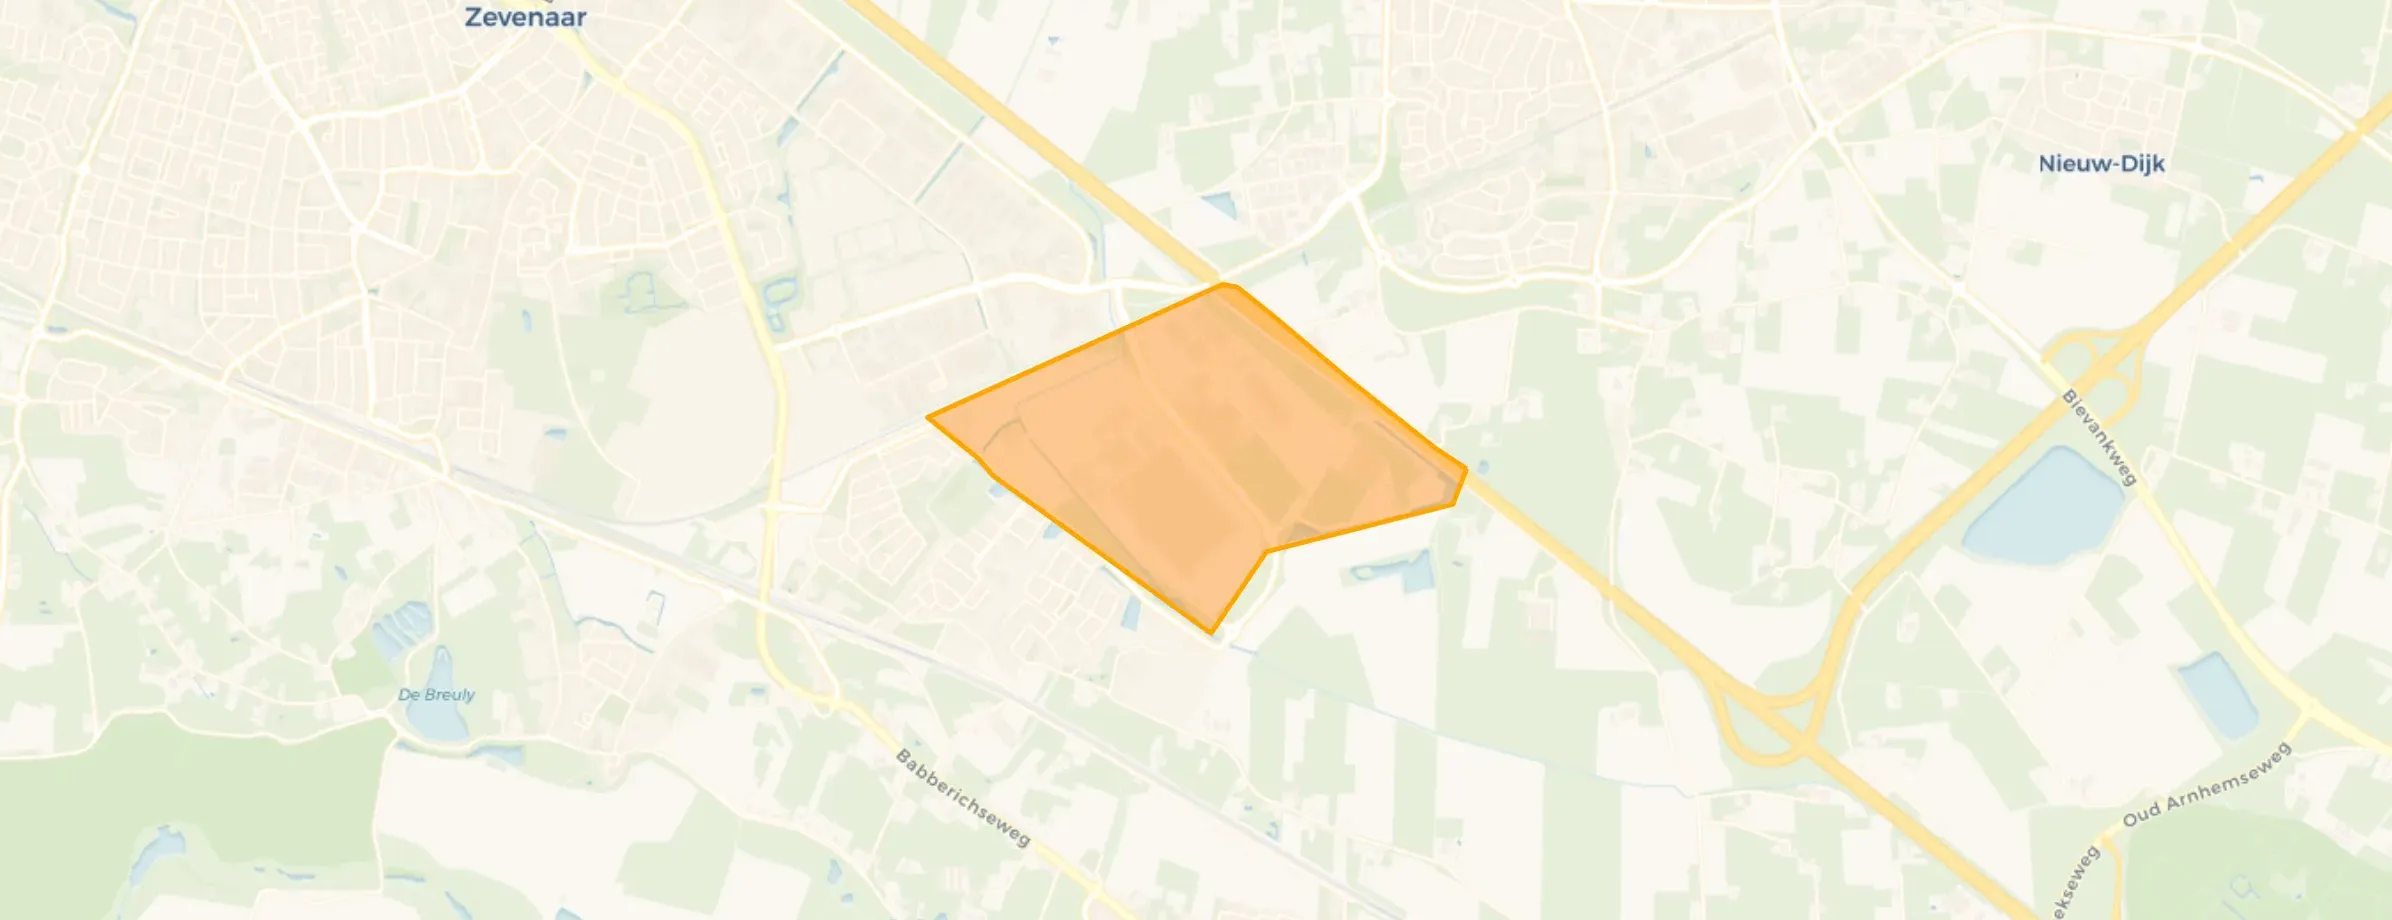
We moved here in October 2024, I must say I should have done it 10 years earlier. The neighbours are friendly, always up for a chat, helpful, shops nearby. In short, a lovely neighbourhood, and of course sometimes there is something, but that's everywhere.
Auto-translated to English by AIWe moved here on 27 October 2024, we had only just lived there a while when I immediately said I never want to leave here.
Auto-translated to English by AIModest and pleasant residents. Many have lived in their homes for a long time, so there is little turnover. The average age has risen considerably over the years. Most children have now left home and live on their own. This autumn, the neighbourhood will undergo major renovations: pipes and paving will be renewed, and the current asphalt paving will be replaced with cobblestones, which not everyone is happy about. The neighbourhood is not far from the centre and is not busy with traffic.
Auto-translated to English by AIA quiet and pleasant neighbourhood. It is nice to live here and there are good contacts with fellow residents. The average age is probably a bit higher than in other districts. Most houses were built in the 1960s and early 1970s. There is a good balance between owner-occupied and rental homes. The main amenities are also present, such as a square and a grass field. For young people it may not be enough, but they are usually found in the city centre and entertain themselves more with their mobile phones. Job seekers will usually find a job outside the neighbourhood because there are few businesses in the Schrijvershoek district. Hopefully the municipality of Zevenaar has no big plans for this neighbourhood and it may stay as it is now! Lifra.
Auto-translated to English by AIToo many differently coloured scum
Auto-translated to English by AIThe housing stock is mainly post-war — 67% was built between 1945 and 1990.
Over the past year a home for sale in Zevenaar was listed for an average of €451,886 (€3,507 per m²). That is 14% below the Dutch national average. Last quarter prices rose by 39%.
A rental home in Zevenaar cost an average of €1,424 per month (€14 per m²). That is 34% below the national average.
Residents give Zevenaar a 7.0 out of 10 based on 5 reviews. The strongest score is for accessibility (7.0), the weakest for education (5.5).
The housing supply in Zevenaar is remarkably efficient: 55% has an A, A+ or B label. The average natural gas consumption per household is 790 m³ per year.
From Zevenaar you can on average reach a supermarket at 0.8 km, a GP at 1.2 km, a railway station at 1.9 km, a primary school at 0.9 km (as the crow flies, source: CBS).
Right now you will find 89 homes for sale and 4 homes for rent in Zevenaar.