Municipality in Gelderland
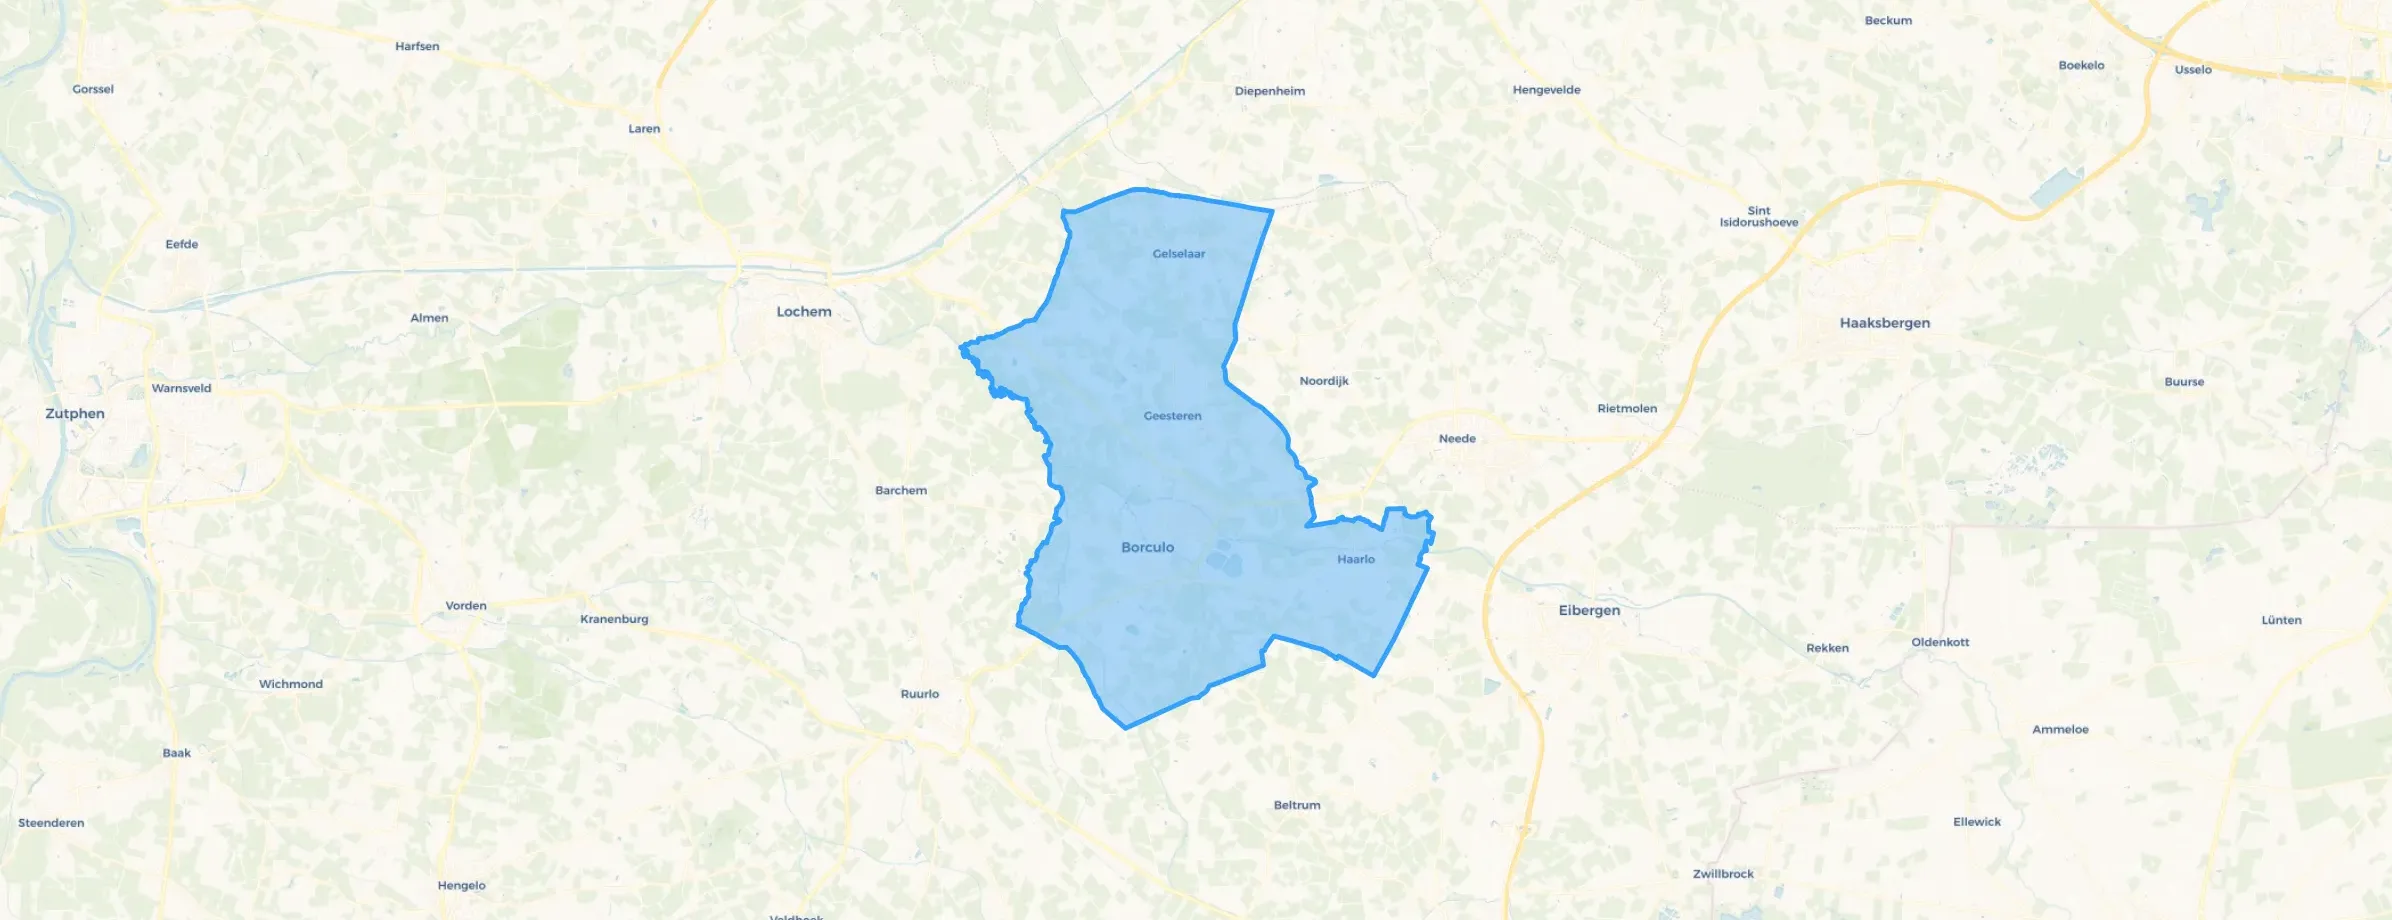
Berkelland is located in the province of Gelderland The municipality has a total area of 26.021 hectares, of which 25.809 hectares are land and 212 hectares are water. The municipality is coded as GM1859. The postcode area is 7151AA-7275CZ.
Berkelland has 43.933 residents. Of these, 50,1% are men and 49,9% are women. Most residents are 45 to 65 years (29,6%). The other age groups are 26,7% for '65 years or older', 19,2% for '25 to 45 years', 13,2% for '0 to 15 years' and 11,3% for '15 to 25 years'. Of the residents, 42,5% is unmarried, 44,9% is married, 5,9% is divorced and 6,7% is widowed. 39.684 residents originate from the Netherlands, 2.102 come from Europe and 2.147 come from countries outside Europe.
There are 19.220 households in Berkelland. 30,9% of these are single-person households, 35,9% households without children and 33,1% households with children. The average household size is 2,2 persons.
In Berkelland there are 36.800 income recipients. The average income per income recipient is €33.300, which is €2.500 (7%) lower than the national average of €35.800. Per resident, the average income is €28.400, which is €800 (3%) lower than the national average of €29.200. Most residents of Berkelland are educated to an intermediate level. 49,6% have an intermediate education (HAVO, VWO or MBO 2-4), 26,3% have a lower education (VMBO or MBO 1) and 24,1% have a university or higher professional education (HBO/WO).
Of the 43.933 residents, around 67% are in paid employment, which amounts to 29.435 people. This is 2% higher than the national average of 65%. The majority of workers are in salaried employment (83%), while 17% are self-employed. In Berkelland, 30% of residents receive a benefit. The largest group is those receiving a state pension (AOW). 10.500 people receive this benefit.
In Berkelland there are 19.840 homes with an average assessed value (WOZ) of €357.000. Of these, around 96% are occupied and 4% unoccupied. Most homes are owner-occupied. This amounts to 32% rental homes and 68% owner-occupied homes. Of the homes, 68% privately owned, 24% owned by housing associations and 8% owned by other landlords. The most common construction periods in Berkelland are 1950-1970 (21%) and 1970-1980 (18%).
There are currently no homes for sale in Berkelland. The most recently listed home is Oudestraat 72 by Scheers Roes Makelaars op Funda. No homes were sold in Berkelland over the past year.
There are currently no homes for rent in Berkelland. The most recent home is Huttenhof 9, offered by www.thuisindeachterhoek.nl. No homes were let in Berkelland over the past year.
No recent rental data available for Berkelland.
In Berkelland there are 19.302 addresses with a registered energy label. The most common labels are C (26%), A (20%) and B (20%). On average, an address in Berkelland uses 2.970 kWh of electricity per year. This is 6% above the national average of 2.810 kWh. With an annual consumption of 1.250 m³ per address, natural gas consumption is 2% below the national average of 1.280 m³.
Addressing each other and asking how things are when something is up, and being there for one another
Auto-translated to English by AIIt's a nice little square, a bit quiet though. Occasionally we get together. We look out for each other and that's nice. Feeling at home somewhere is important.
Auto-translated to English by AIBecause we live on the outskirts, it is very quiet here. You enjoy nature every day.
Auto-translated to English by AIMost beautiful village of the Netherlands 2017 Togetherness...social...cosiness...parties...neighbourliness...rural Old-fashioned cosiness We have lived here for 4 years.....feels like 40 years!! The neighbourhood looks fantastic. We have a safety app just in case There is social control Primary school for the young children and parents are satisfied with that There is a village hall for childcare and activities We have neighbourhood associations and every year we do fun active things and a barbecue as a conclusion Once a year a marksmen's festival Every other year an Orange festival It attracts people from far and wide There are plenty of volunteers In short....a super nice village
Auto-translated to English by AIVery chatty people so it's a nice social neighbourhood, you can have a chat with almost anyone
Auto-translated to English by AIRegularly no consideration for each other (probably because I come from the west and there they did consider each other, the municipality was doing well in that regard). For example, in the west we had to keep the alley behind your garden clean; here in the alleys it's a jungle and mess of weeds. If an emergency service ever needs to get through, they'll have to clear the path first.
Auto-translated to English by AISocial, compassionate, cosy and beautiful. A small village in Gelderland. We know each other. You can count on your fellow villagers and especially your neighbours. Whether it's for a small errand, walking someone else's dog, or watering the plants when someone is on holiday. And the children are involved in everything and look after each other's children. We are there for each other! There is always something to do. Every year something special with the neighbourhood. We keep the neighbourhood tidy together. Would never want to leave here.
Auto-translated to English by AIIt's a very quiet neighbourhood in general, from our neighbourhood the Berkel is easily accessible for a walk, also it's just a few hundred metres walk to the bus station, the people here are very kind.
Auto-translated to English by AI
The housing stock is mainly post-war — 50% was built between 1945 and 1990.
Over the past year a home for sale in Berkelland was listed for an average of €646,200 (€3,632 per m²). Last quarter prices fell by 14%.
A rental home in Berkelland cost an average of €935 per month (€11 per m²).
Residents give Berkelland a 8.1 out of 10 based on 17 reviews. The strongest score is for safety (8.4), the weakest for education (6.9).
Gemeente Berkelland has 43,933 residents. The largest age group is 45 to 65 years (30%).
The housing supply in Berkelland is remarkably efficient: 54% has an A, A+ or B label. The average natural gas consumption per household is 1,250 m³ per year.
From Berkelland you can on average reach a supermarket at 1.5 km, a GP at 1.6 km, a railway station at 9.5 km, a primary school at 0.9 km (as the crow flies, source: CBS).
Right now you will find 166 homes for sale and 13 homes for rent in Berkelland.

Buurtje.nl uses cookies to make the site work and to improve it. In doing so, we process data such as your IP address and the pages you visit.
We use this data for three purposes: running the website (functional), measuring visits so we can improve Buurtje.nl (analytics), and — if you allow it — tailoring ads to your interests (marketing).
How we handle your data is described in our privacy policy. You can change your preferences at any time via 'Cookie preferences' at the bottom of every page.
Choose per category which cookies we may place. Read more in our privacy policy.