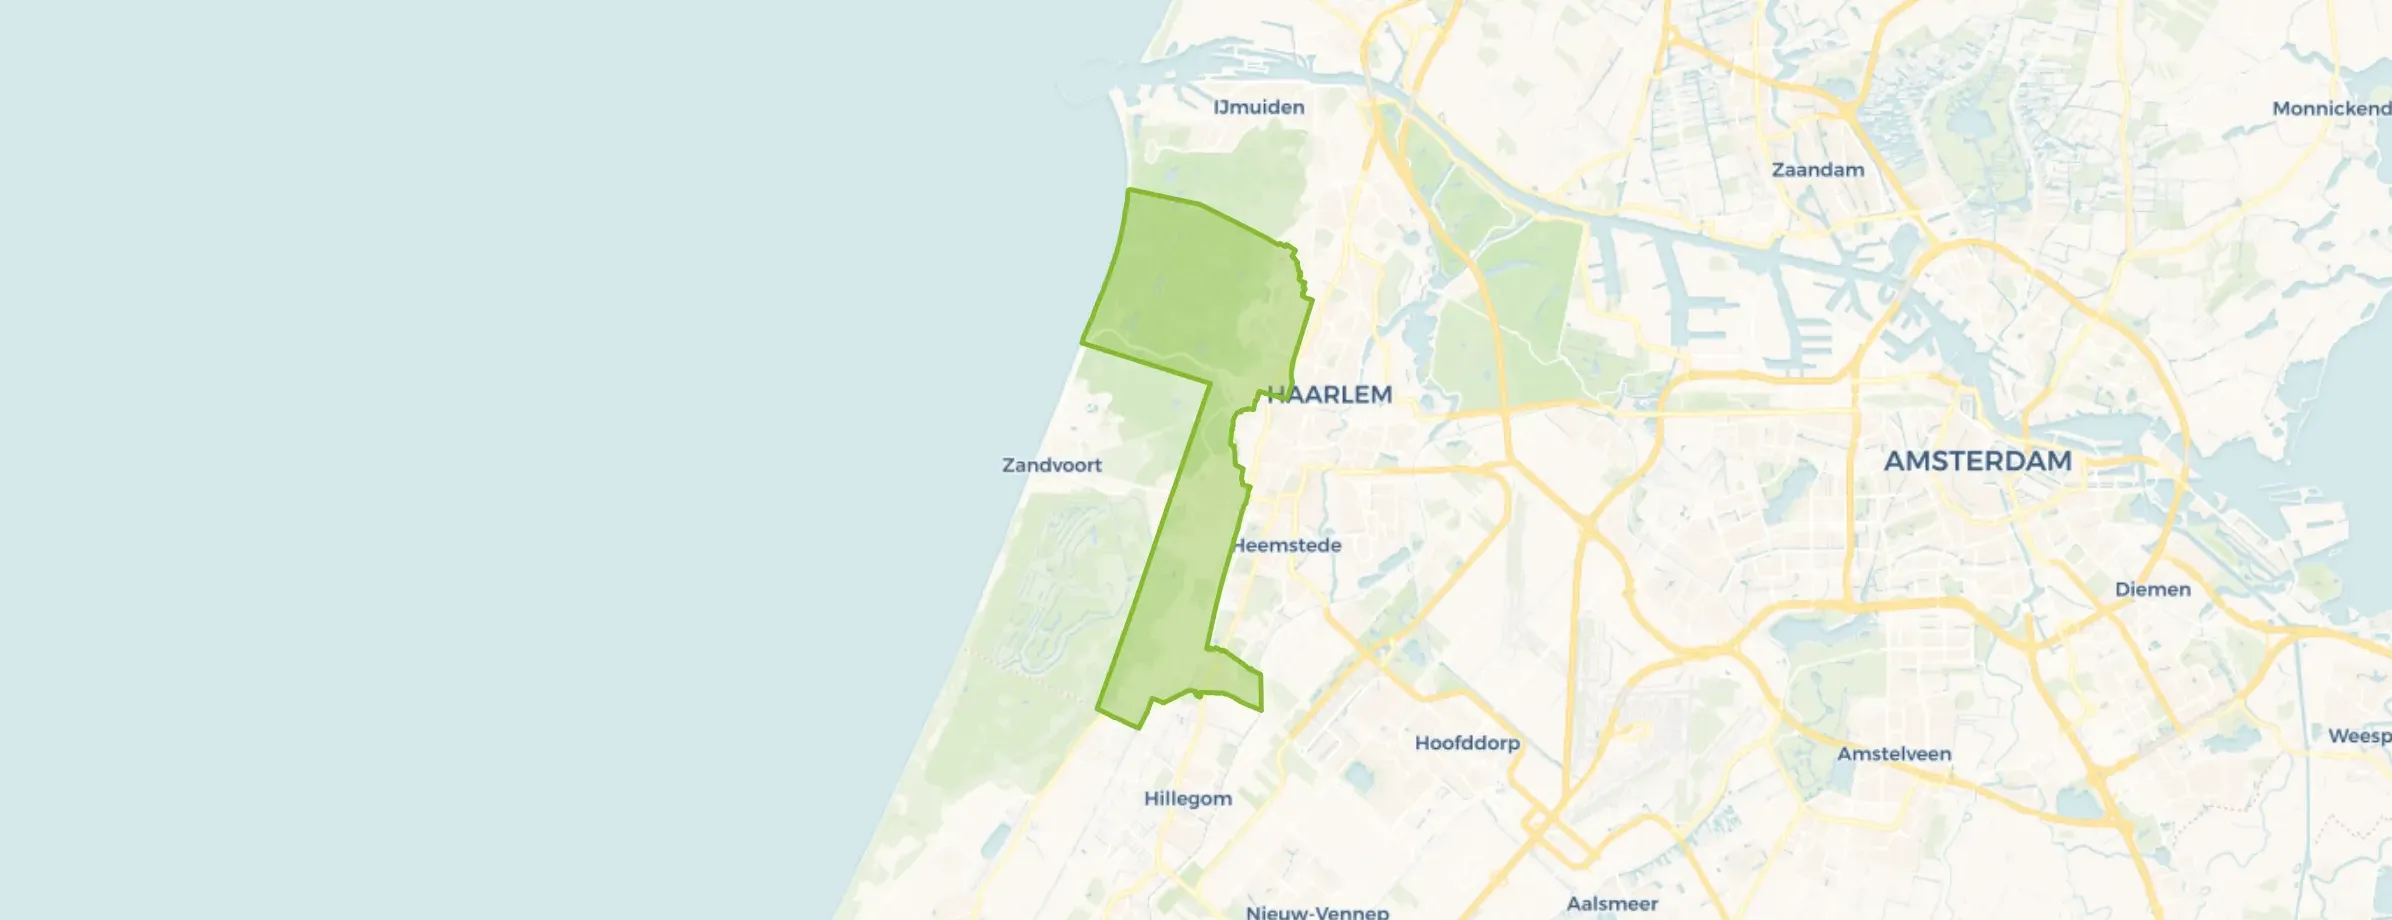
Municipality in Noord-Holland
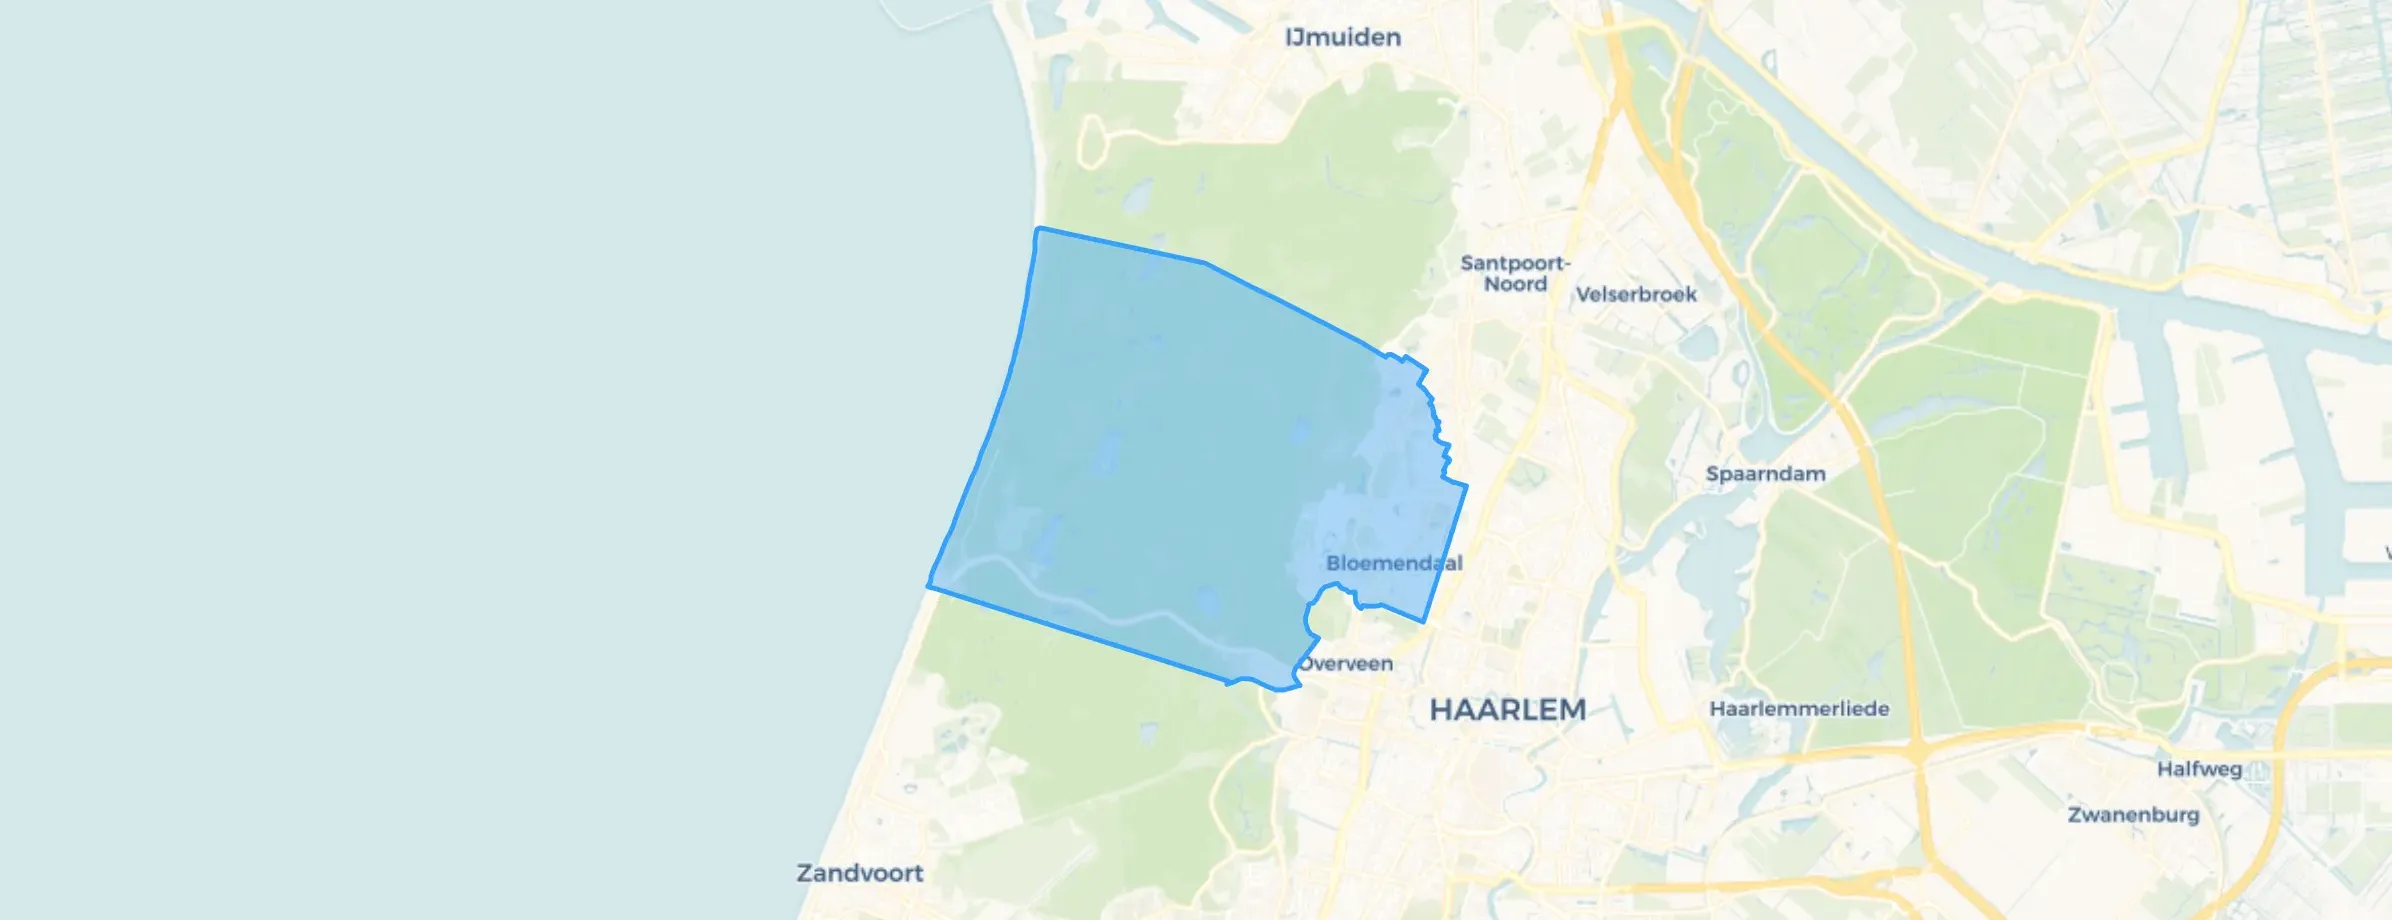
Bloemendaal is located in the province of Noord-Holland The municipality has a total area of 4.523 hectares, of which 3.977 hectares are land and 546 hectares are water. The municipality is coded as GM0377. The postcode area is 2051AA-2121XZ.
Bloemendaal has 23.592 residents. Of these, 48,1% are men and 51,9% are women. Most residents are 45 to 65 years (30,0%). The other age groups are 27,9% for '65 years or older', 16,7% for '0 to 15 years', 14,7% for '25 to 45 years' and 10,7% for '15 to 25 years'. Of the residents, 44,6% is unmarried, 42,4% is married, 7,0% is divorced and 6,0% is widowed. 17.874 residents originate from the Netherlands, 2.448 come from Europe and 3.270 come from countries outside Europe.
There are 10.035 households in Bloemendaal. 33,0% of these are single-person households, 31,2% households without children and 35,9% households with children. The average household size is 2,3 persons. The national average is 2,1 persons.
In Bloemendaal there are 18.400 income recipients. The average income per income recipient is €68.100, which is €25.900 (61%) higher than the national average of €42.200. Per resident, the average income is €54.400, which is €19.500 (56%) higher than the national average of €34.900. Most residents of Bloemendaal are highly educated. 56,0% have a university or higher professional education (HBO/WO), 26,7% have an intermediate education (HAVO, VWO or MBO 2-4) and 17,3% have a lower education (VMBO or MBO 1).
Of the 23.592 residents, around 70% are in paid employment, which amounts to 16.514 people. This is 2% lower than the national average of 72%. The majority of workers are in salaried employment (70%), while 30% are self-employed. In Bloemendaal, 30% of residents receive a benefit. The largest group is those receiving a state pension (AOW). 5.940 people receive this benefit.
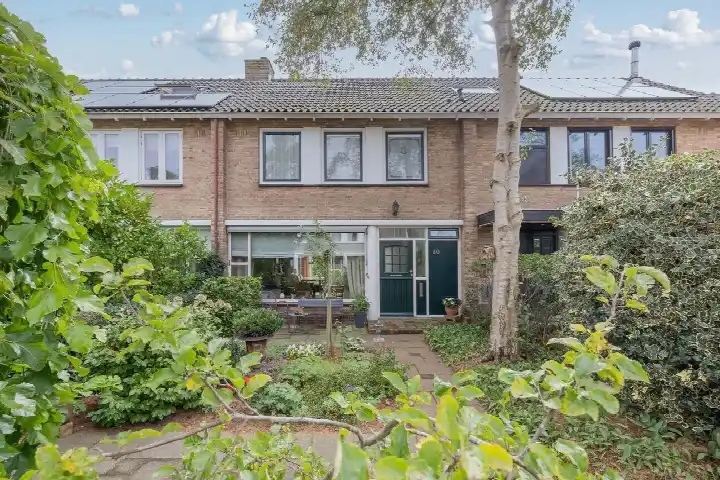
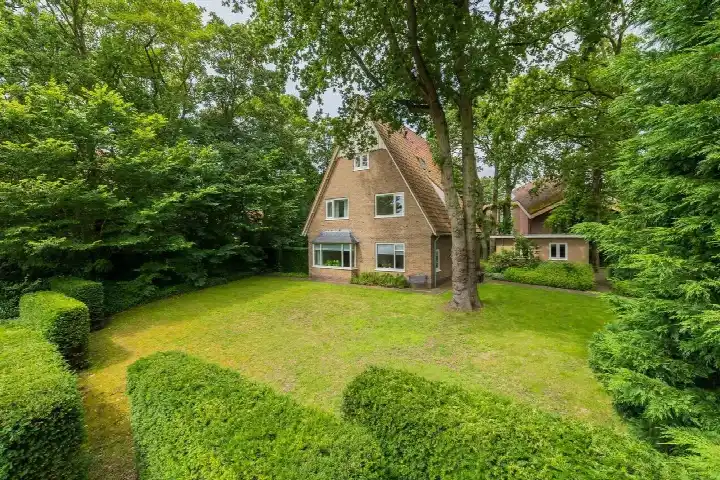
In Bloemendaal there are 10.389 homes with an average assessed value (WOZ) of €919.000. Of these, around 95% are occupied and 5% unoccupied. Most homes are owner-occupied. This amounts to 29% rental homes and 71% owner-occupied homes. Of the homes, 71% privately owned, 17% owned by housing associations and 12% owned by other landlords. The most common construction periods in Bloemendaal are 1925-1950 (23%) and 1950-1970 (20%).
There are currently no homes for sale in Bloemendaal. The most recently listed home is M H Tromplaan 29 by Michiel van Maanen Makelaardij op Pararius. No homes were sold in Bloemendaal over the past year.
There are currently no homes for rent in Bloemendaal. The most recent home is Boekenroodeweg 13Z12, offered by vb&t Verhuurmakelaars. No homes were let in Bloemendaal over the past year.
No recent rental data available for Bloemendaal.
In Bloemendaal there are 6.619 addresses with a registered energy label. The most common labels are C (23%), A (23%) and B (14%). On average, an address in Bloemendaal uses 3.170 kWh of electricity per year. This is 24% above the national average of 2.550 kWh. Natural gas consumption, at 1.280 m³ per year, is 60% above the national average of 800 m³.
Enjoying, just fantastic to be able to live here.
Auto-translated to English by AIOverveen is a good and pleasant neighbourhood to grow up in. The traffic situation is safe enough for children to walk to their primary school on their own without any problems. There are plenty of primary and secondary schools in the area and they are also easily accessible. Even if you don't study in Overveen, there are enough facilities to easily take you to major transport hubs. Very well located. Close to the beach and Haarlem. So a pleasant environment.
Auto-translated to English by AIGood neighbourhood. Nice community.
Auto-translated to English by AIVery friendly
Auto-translated to English by AIOur neighbourhood is not very good with each other. Sometimes fun things are organised but you have to be on good terms with certain people to actually have a good time there. Unless you go with your own friends.
Auto-translated to English by AINice neighbourhood. I've been living here for years with my wife Els and little dog Rambo. Nice forest to play in too! Expensive though.
Auto-translated to English by AII find the people living on my street all very friendly and welcoming, and we have a very nice pond in front of our house.
Auto-translated to English by AII think it's a nice neighbourhood to live in. It's beautiful, quiet and green.
Auto-translated to English by AIOver the past year a home for sale in Bloemendaal was listed for an average of €1,277,955 (€6,851 per m²). Last quarter prices rose by 9%.
A rental home in Bloemendaal cost an average of €3,628 per month (€26 per m²).
Residents give Bloemendaal a 8.1 out of 10 based on 8 reviews. The strongest score is for nature and greenery (9.1), the weakest for amenities (7.1).
Gemeente Bloemendaal has 23,592 residents. The largest age group is 45 to 65 years (30%). Many families: 36% of the households have children.
A considerable share of the supply in Bloemendaal is less efficient: 25% has an E, F or G label. The average natural gas consumption per household is 1,280 m³ per year.
From Bloemendaal you can on average reach a supermarket at 0.8 km, a GP at 0.9 km, a railway station at 1.8 km, a primary school at 0.6 km (as the crow flies, source: CBS).
Right now you will find 137 homes for sale and 10 homes for rent in Bloemendaal.