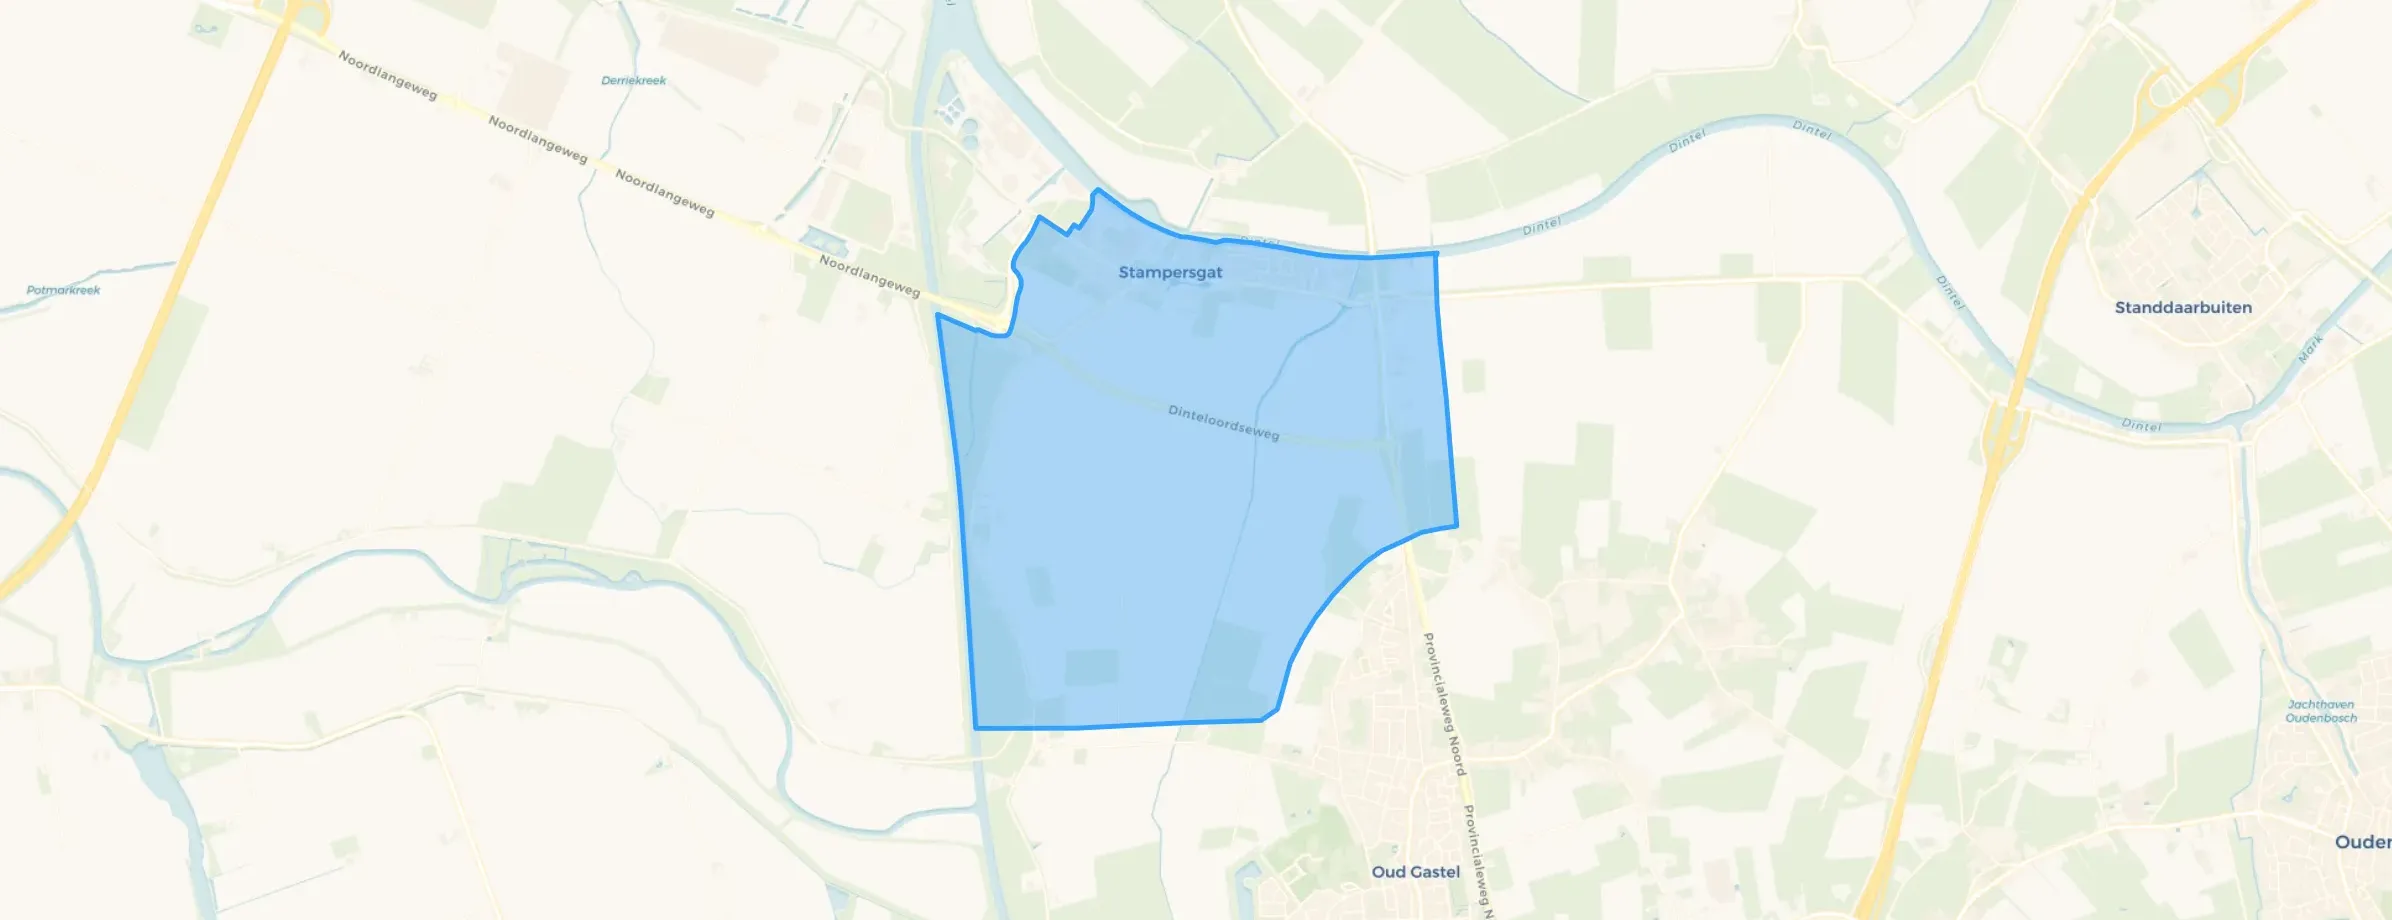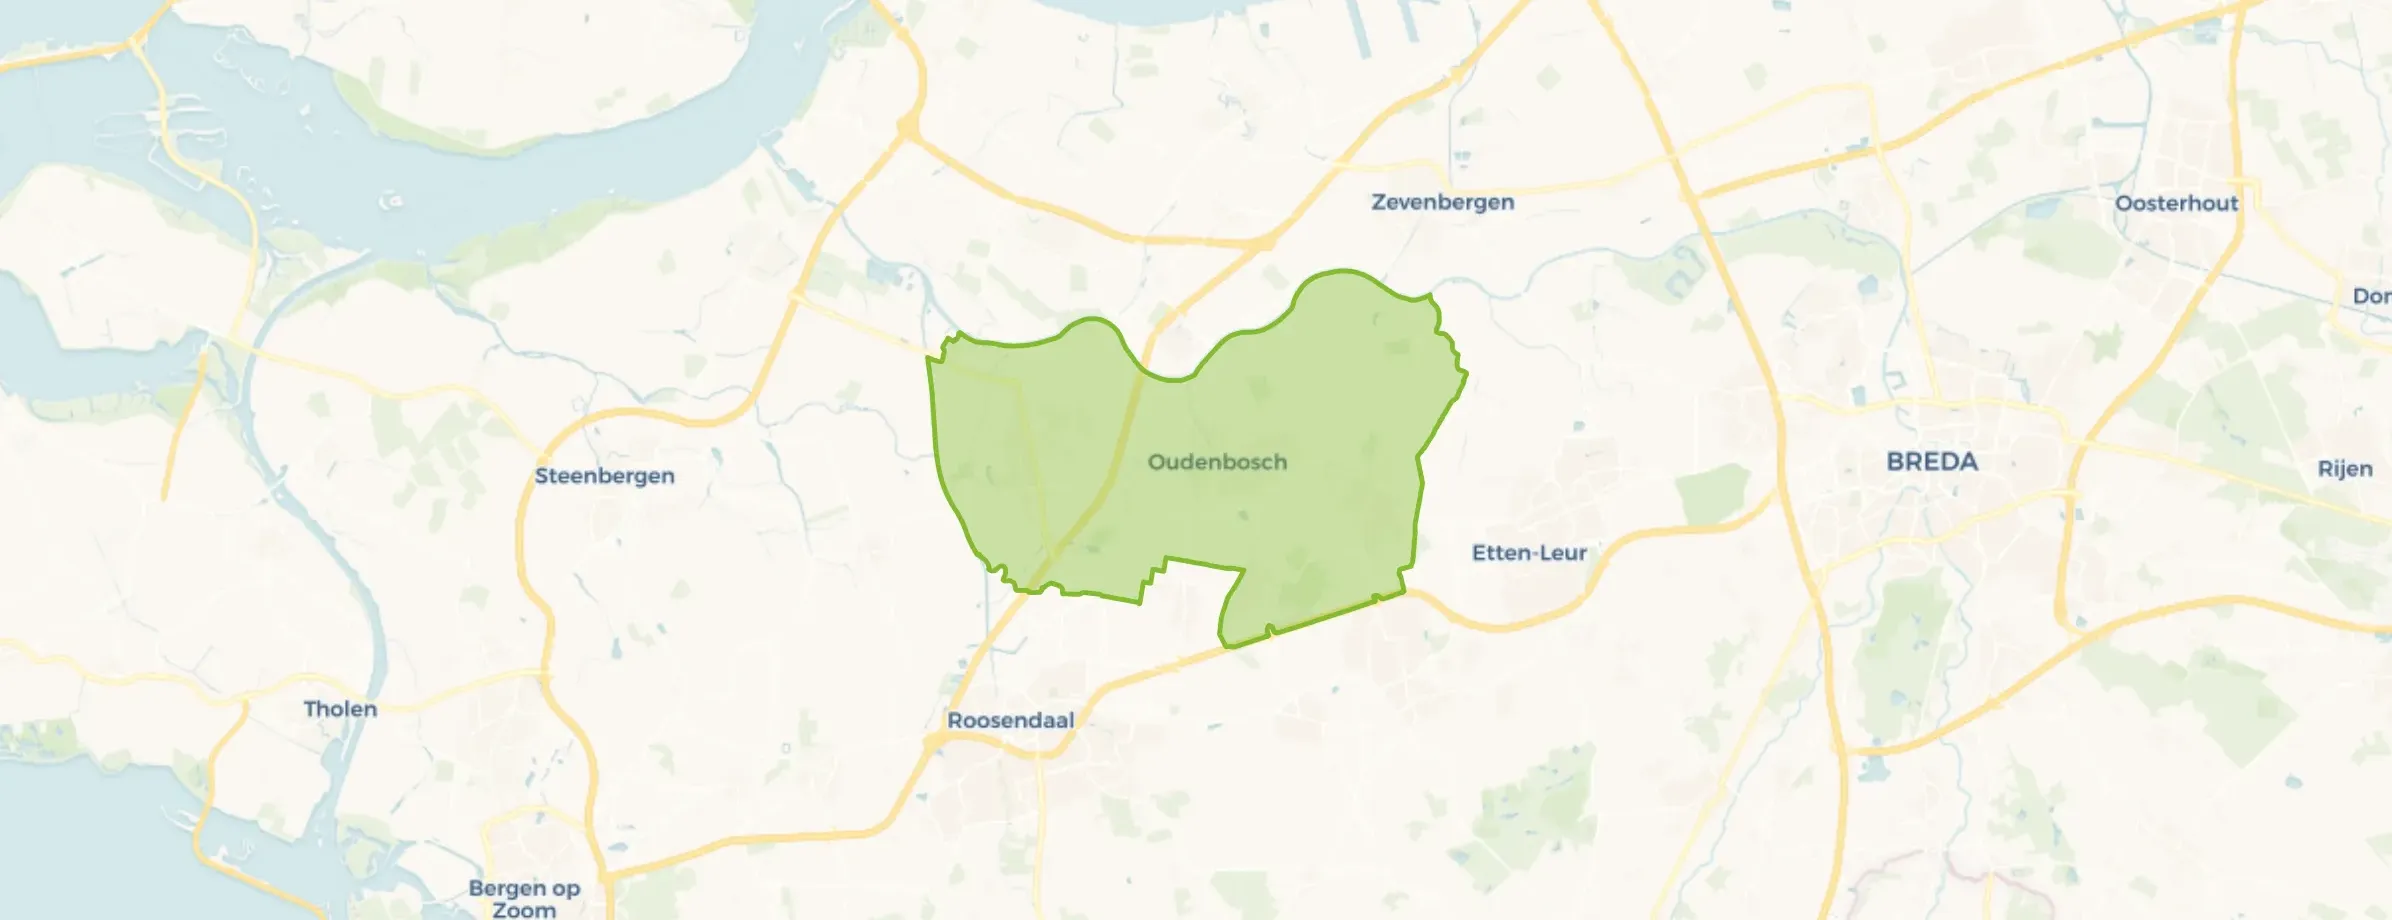
Municipality in Noord-Brabant
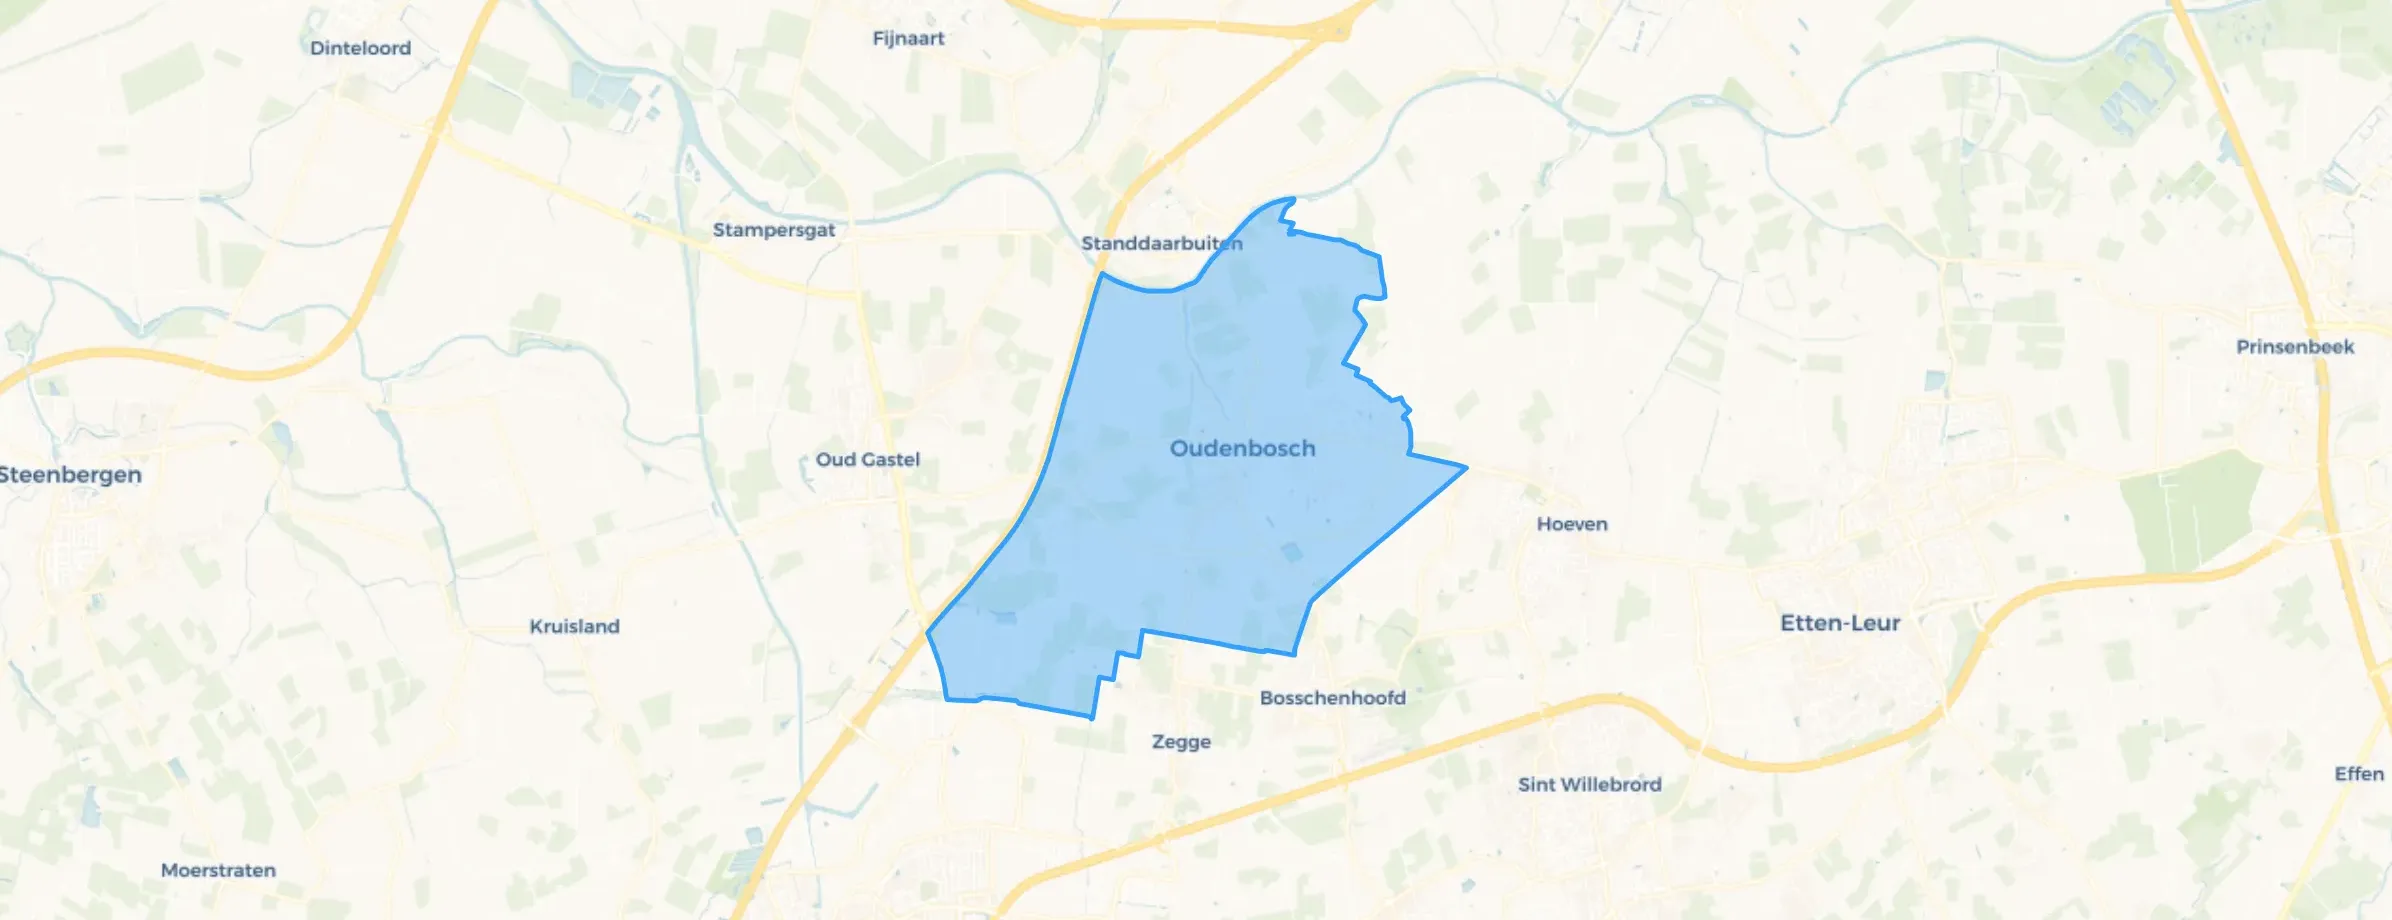
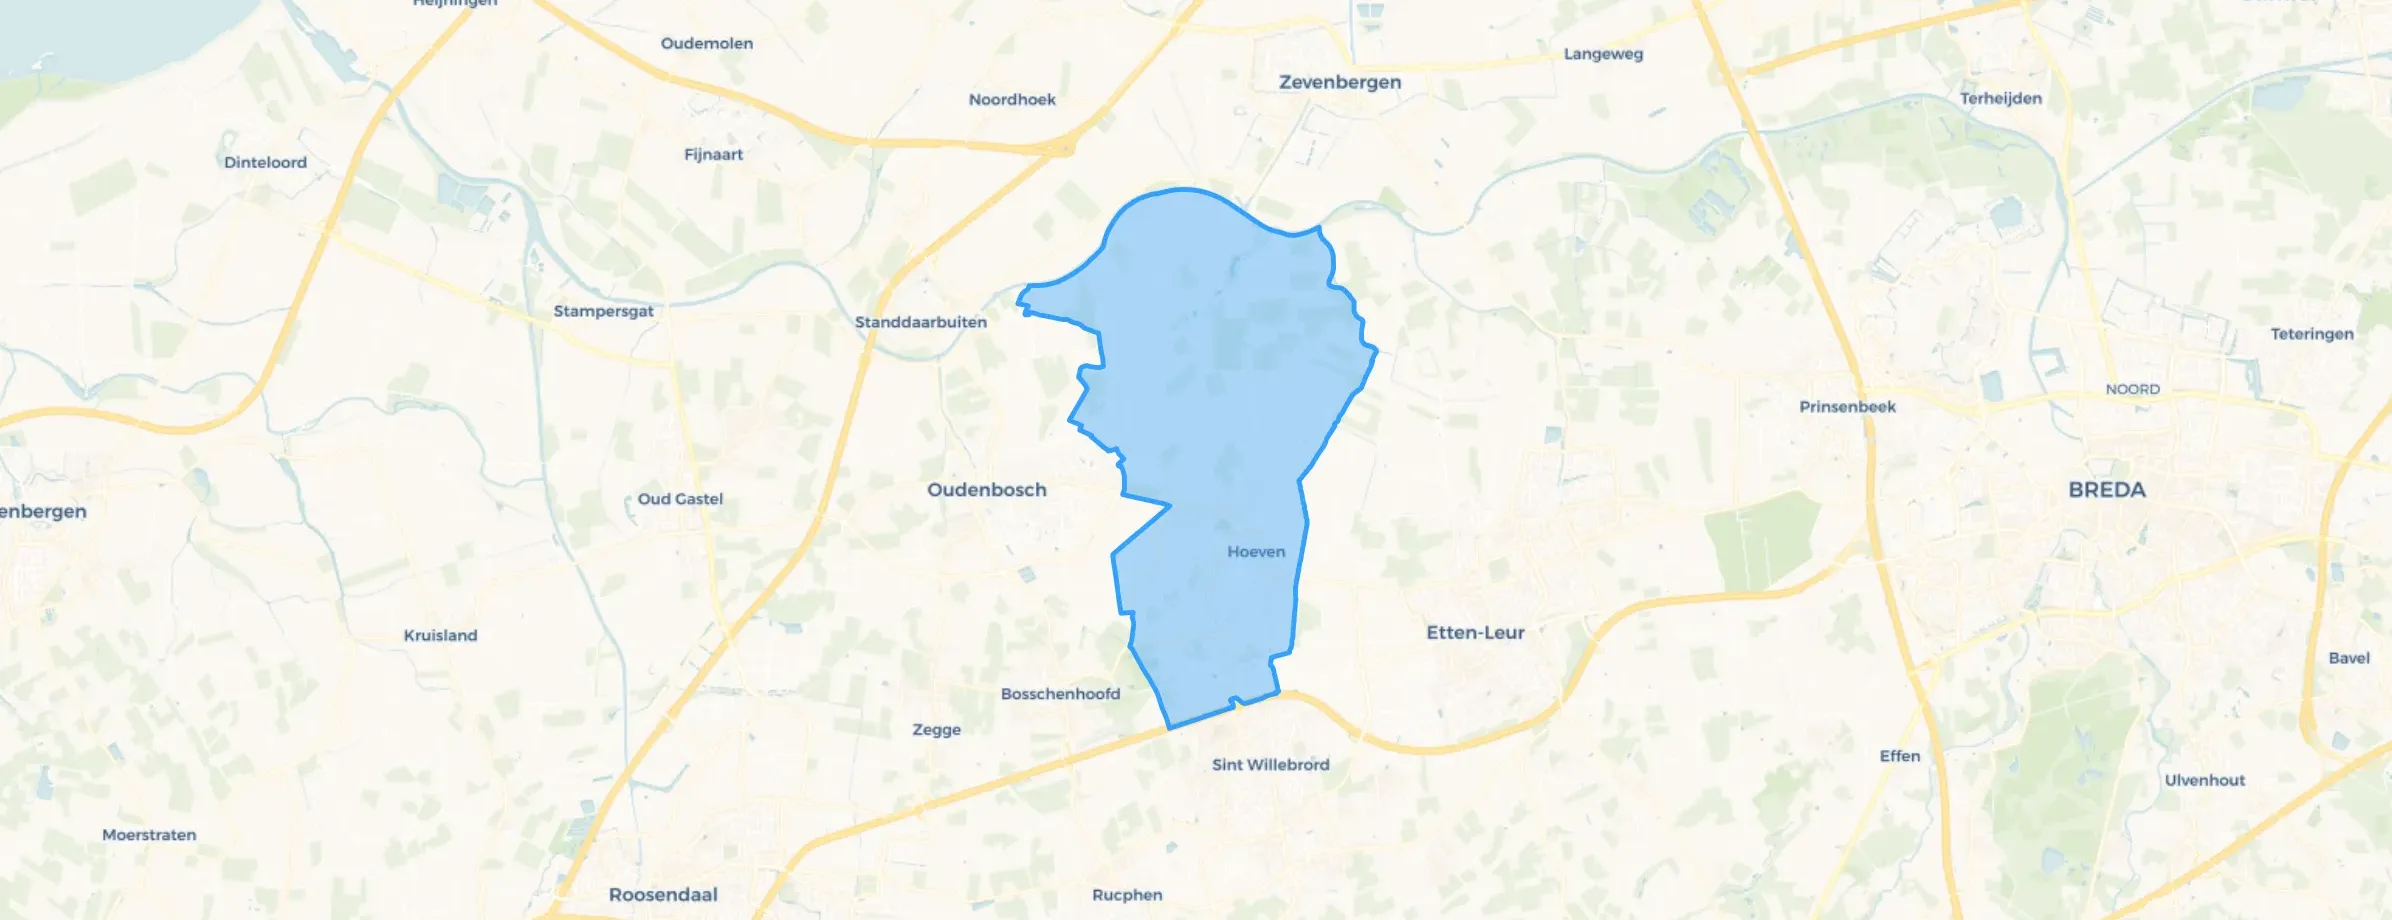
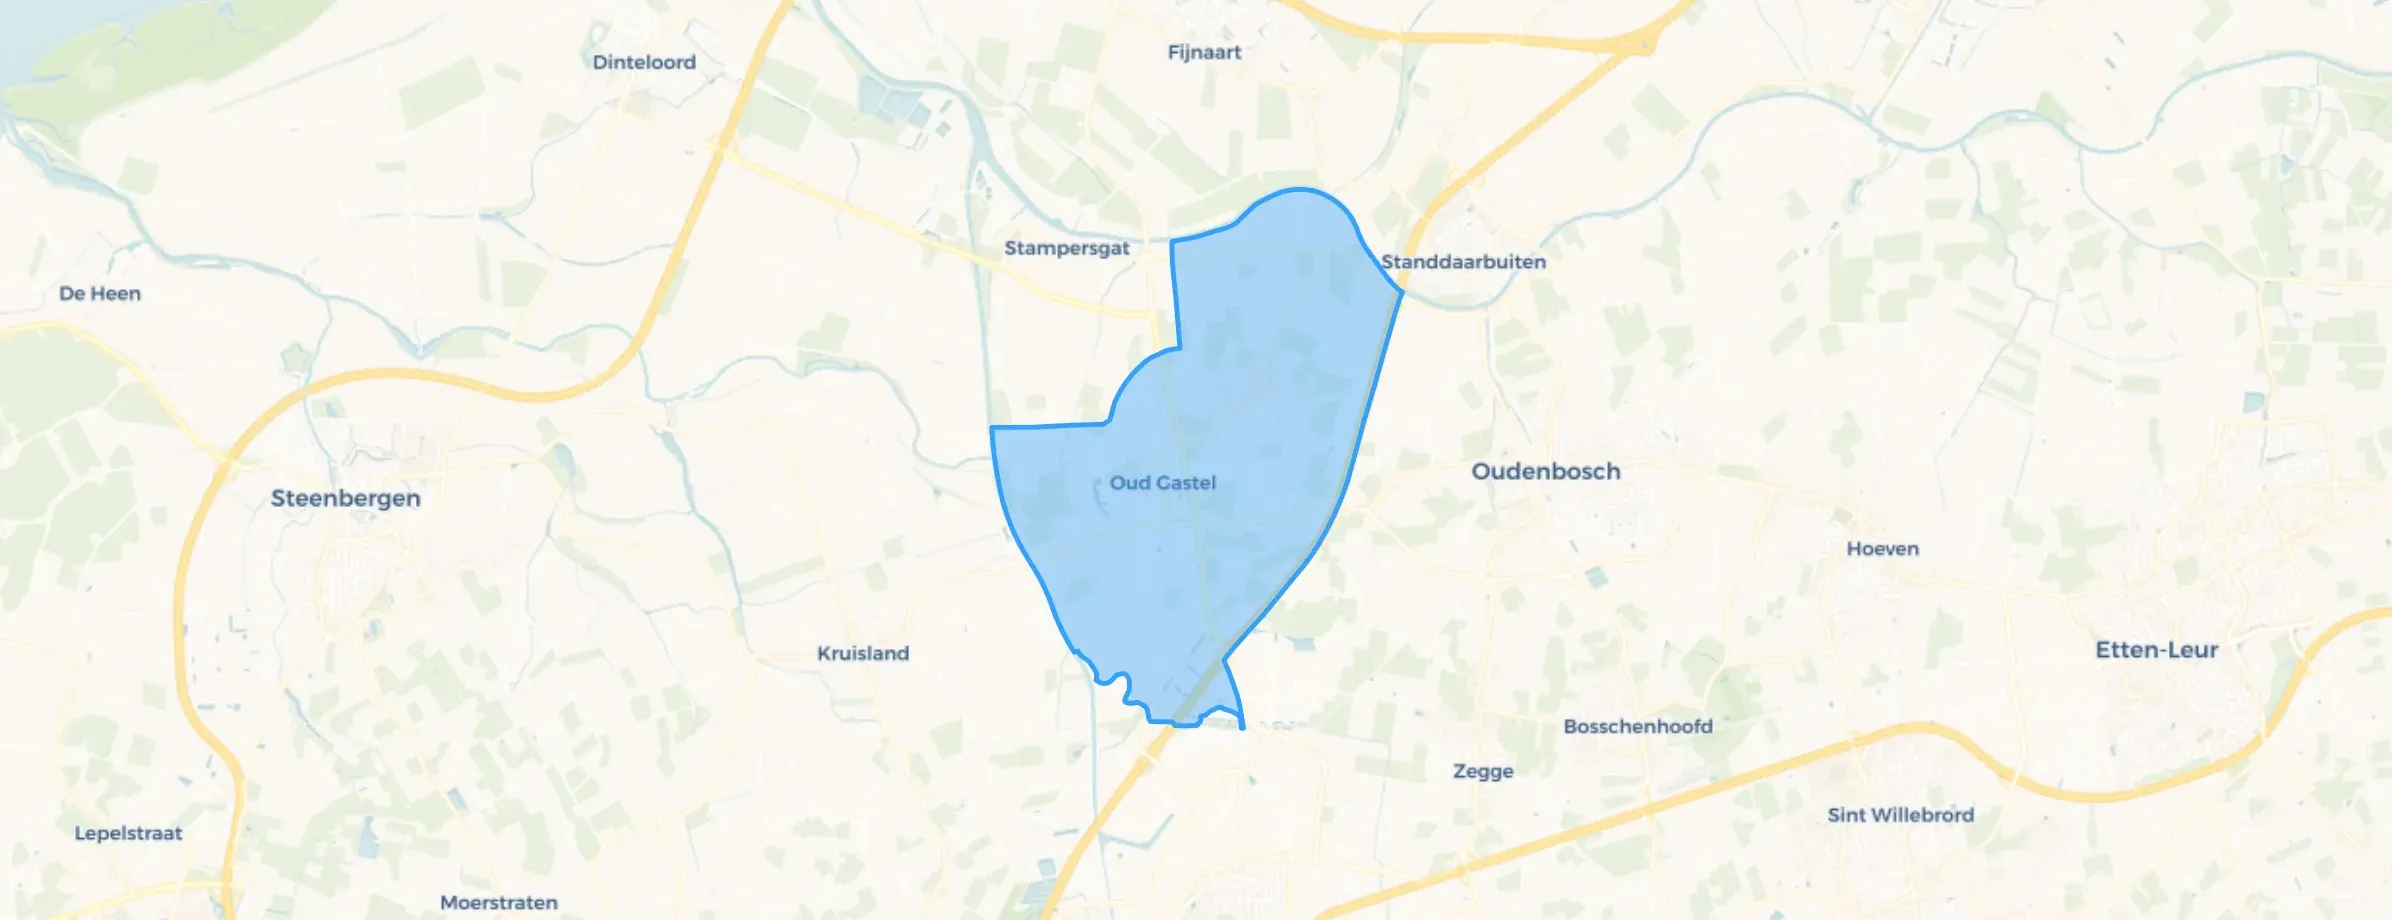
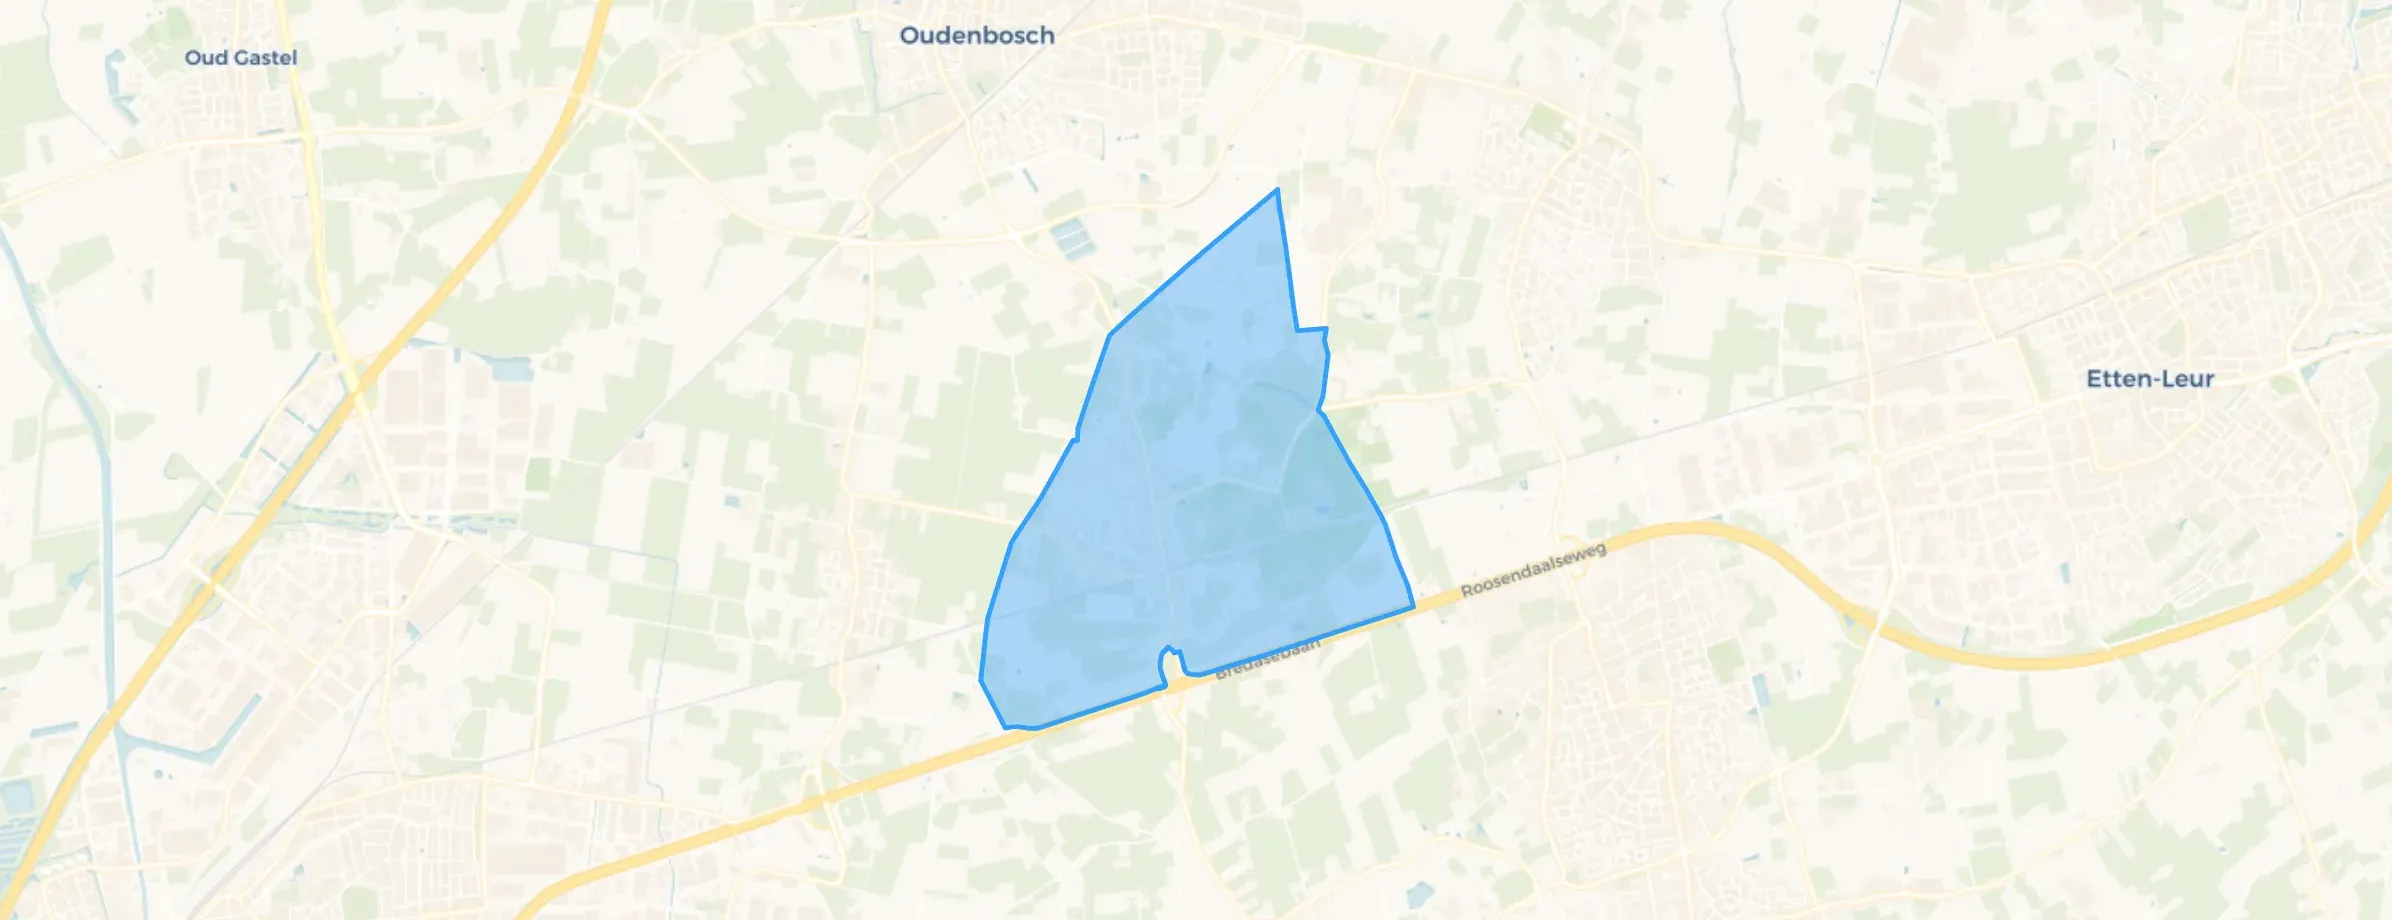
Halderberge is located in the province of Noord-Brabant The municipality has a total area of 7.521 hectares, of which 7.444 hectares are land and 77 hectares are water. The municipality is coded as GM1655. The postcode area is 4731AA-4754RJ.
Halderberge has 31.183 residents. Of these, 49,8% are men and 50,2% are women. Most residents are 45 to 65 years (28,7%). The other age groups are 24,6% for '65 years or older', 21,8% for '25 to 45 years', 14,3% for '0 to 15 years' and 10,6% for '15 to 25 years'. Of the residents, 41,7% is unmarried, 44,8% is married, 7,4% is divorced and 6,1% is widowed. 25.192 residents originate from the Netherlands, 2.638 come from Europe and 3.353 come from countries outside Europe.
There are 13.585 households in Halderberge. 30,0% of these are single-person households, 35,5% households without children and 34,5% households with children. The average household size is 2,3 persons.
In Halderberge there are 25.100 income recipients. The average income per income recipient is €35.900, which is €100 (0%) higher than the national average of €35.800. Per resident, the average income is €30.000, which is €800 (3%) higher than the national average of €29.200. Most residents of Halderberge are educated to an intermediate level. 47,3% have an intermediate education (HAVO, VWO or MBO 2-4), 29,8% have a lower education (VMBO or MBO 1) and 22,9% have a university or higher professional education (HBO/WO).
Of the 31.183 residents, around 65% are in paid employment, which amounts to 20.269 people. This is 0% lower than the national average of 65%. The majority of workers are in salaried employment (84%), while 16% are self-employed. In Halderberge, 28% of residents receive a benefit. The largest group is those receiving a state pension (AOW). 6.800 people receive this benefit.
In Halderberge there are 13.702 homes with an average assessed value (WOZ) of €339.000. Of these, around 97% are occupied and 3% unoccupied. Most homes are owner-occupied. This amounts to 35% rental homes and 65% owner-occupied homes. Of the homes, 65% privately owned, 29% owned by housing associations and 6% owned by other landlords. The most common construction periods in Halderberge are 1950-1970 (22%) and 1970-1980 (21%).
There are currently no homes for sale in Halderberge. The most recently listed home is Stoofstraat 26 by Sweere v.o.f.. No homes were sold in Halderberge over the past year.
There are currently no homes for rent in Halderberge. The most recent home is Strijmondlaan 67, offered by www.klikvoorwonen.nl. No homes were let in Halderberge over the past year.
No recent rental data available for Halderberge.
In Halderberge there are 13.923 addresses with a registered energy label. The most common labels are A (25%), C (24%) and B (19%). On average, an address in Halderberge uses 2.990 kWh of electricity per year. This is 6% above the national average of 2.810 kWh. With an annual consumption of 1.150 m³ per address, natural gas consumption is 10% below the national average of 1.280 m³.
Quiet, nice street, completely green, friendly neighbours
Auto-translated to English by AISmall village but has everything from secondary school to shops
Auto-translated to English by AIOnly the new-build homes and the homes that are coming are taken into account. Meanwhile, we've been putting up with noise and excessive traffic for 1.5 years, and it's only getting busier because more homes are being built that access the dyke only via us, instead of 300 metres further where they keep their own road for 4 homes, and I get the whole neighbourhood and now also cemetery visitors passing by. The remaining patch of green is used by a quarter of the neighbourhood as a dog toilet without being cleaned up (I regularly clean it up because it's just lying there next to the driveway).
Auto-translated to English by AIOnly lived here for 1 year, can't give a verdict yet
Auto-translated to English by AII would like it if there were a nice bit of nature to walk in
Auto-translated to English by AIHelping each other when needed but still keeping to themselves
Auto-translated to English by AII've lived here my whole life and I have no complaints, everything you could need is in the neighbourhood.
Auto-translated to English by AIA nice village where people are there for each other.
Auto-translated to English by AIThe housing stock is mainly post-war — 50% was built between 1945 and 1990.
Over the past year a home for sale in Halderberge was listed for an average of €702,430 (€4,019 per m²). Last quarter prices rose by 8%.
A rental home in Halderberge cost an average of €1,542 per month (€11 per m²).
Residents give Halderberge a 7.9 out of 10 based on 9 reviews. Safety stands out with a 8.7; cleanliness lags behind with a 7.6.
The housing supply in Halderberge is remarkably efficient: 63% has an A, A+ or B label. The average natural gas consumption per household is 1,150 m³ per year.
From Halderberge you can on average reach a supermarket at 1.1 km, a GP at 1.1 km, a railway station at 3.7 km, a primary school at 0.8 km (as the crow flies, source: CBS).
Right now you will find 124 homes for sale and 12 homes for rent in Halderberge.