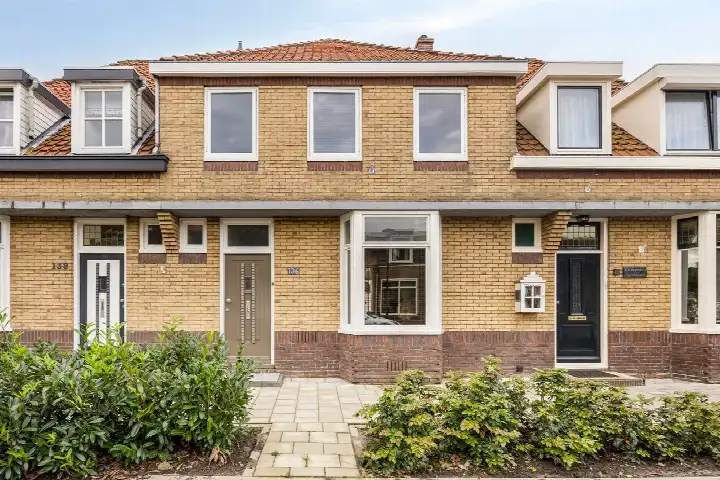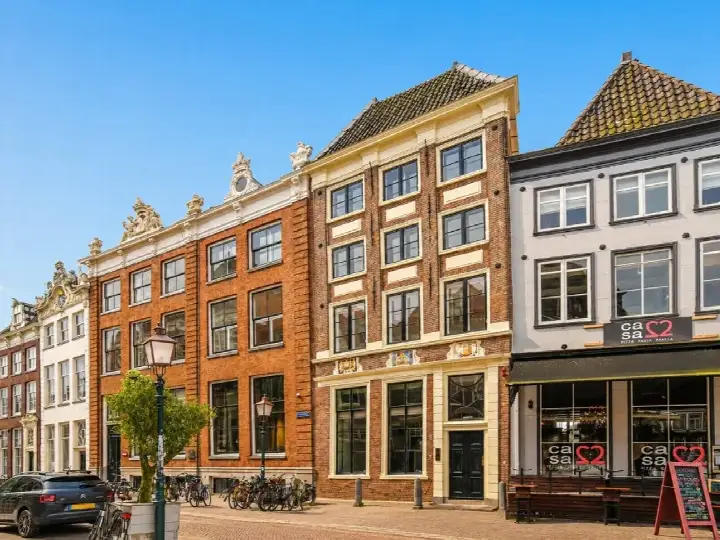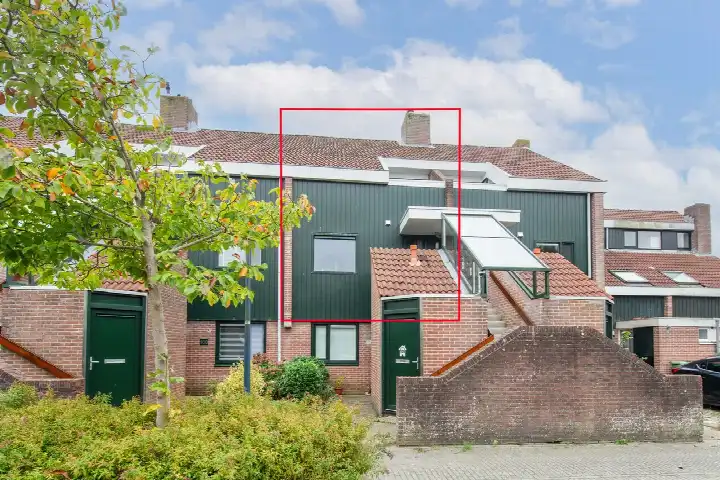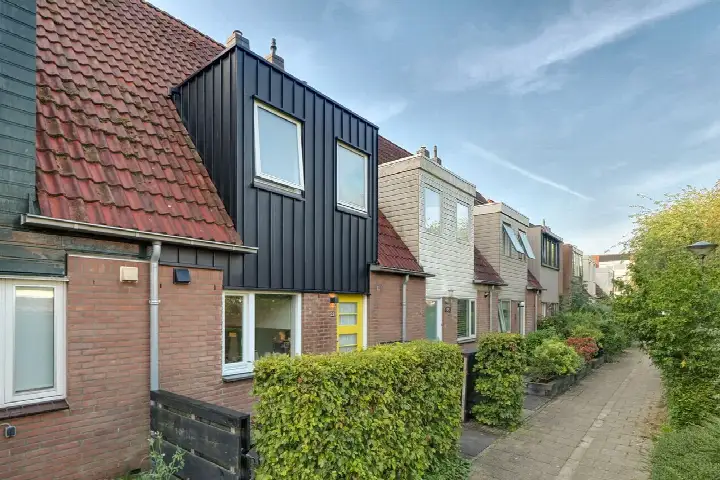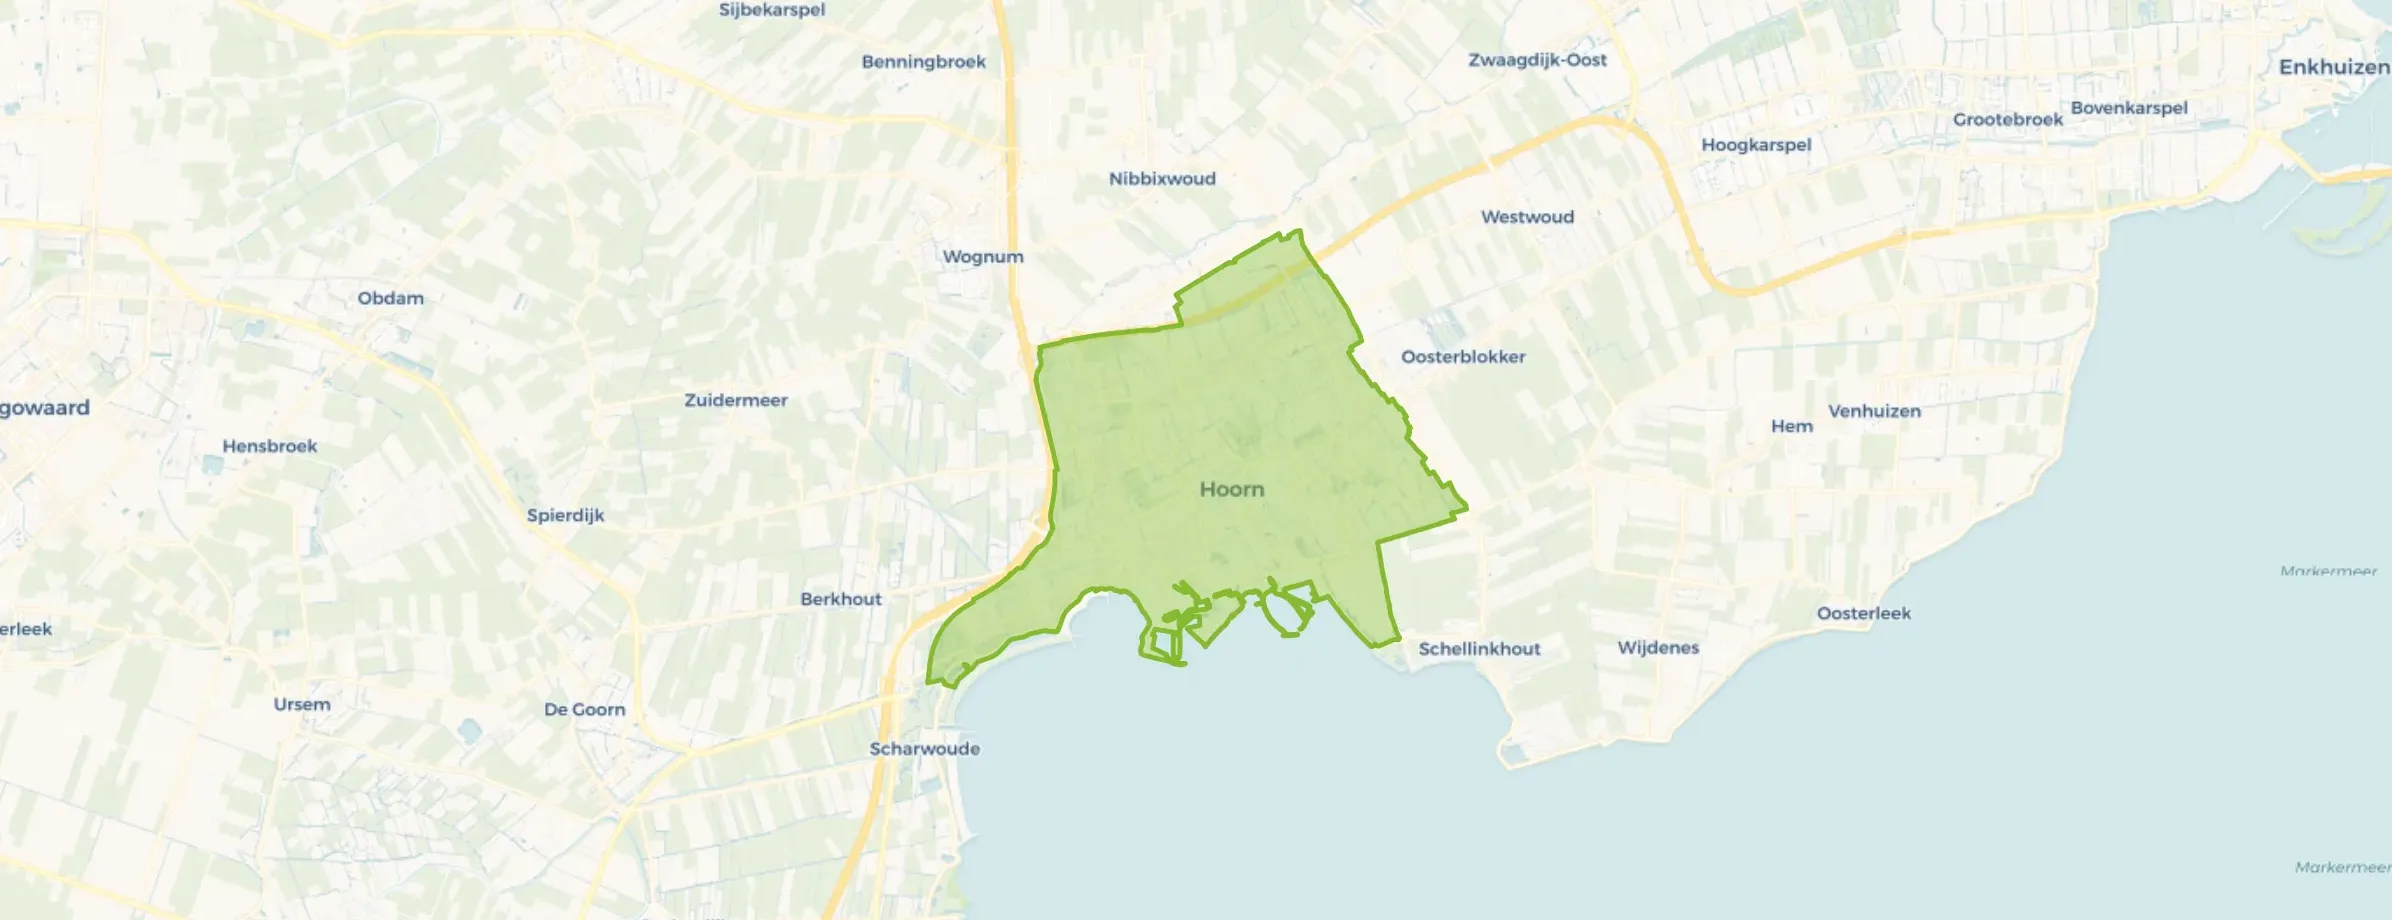
Municipality in Noord-Holland
Hoorn is located in the province of Noord-Holland The municipality has a total area of 5.346 hectares, of which 2.037 hectares are land and 3.308 hectares are water. The municipality is coded as GM0405. The postcode area is 1621AA-1695LE.
Hoorn has 76.036 residents. Of these, 49,4% are men and 50,6% are women. Most residents are 45 to 65 years (26,1%). The other age groups are 25,8% for '25 to 45 years', 20,9% for '65 years or older', 15,8% for '0 to 15 years' and 11,5% for '15 to 25 years'. Of the residents, 50,2% is unmarried, 36,0% is married, 9,2% is divorced and 4,6% is widowed. 54.555 residents originate from the Netherlands, 6.577 come from Europe and 14.904 come from countries outside Europe.
There are 35.013 households in Hoorn. 38,3% of these are single-person households, 26,8% households without children and 34,9% households with children. The average household size is 2,1 persons. The national average is 2,1 persons.
In Hoorn there are 61.400 income recipients. The average income per income recipient is €40.400, which is €1.800 (4%) lower than the national average of €42.200. Per resident, the average income is €33.300, which is €1.600 (5%) lower than the national average of €34.900. Most residents of Hoorn are educated to an intermediate level. 43,9% have an intermediate education (HAVO, VWO or MBO 2-4), 29,0% have a university or higher professional education (HBO/WO) and 27,1% have a lower education (VMBO or MBO 1).
Of the 76.036 residents, around 71% are in paid employment, which amounts to 53.986 people. This is 1% lower than the national average of 72%. The majority of workers are in salaried employment (84%), while 16% are self-employed. In Hoorn, 28% of residents receive a benefit. The largest group is those receiving a state pension (AOW). 14.290 people receive this benefit.
In Hoorn there are 34.994 homes with an average assessed value (WOZ) of €365.000. Of these, around 97% are occupied and 3% unoccupied. Most homes are owner-occupied. This amounts to 39% rental homes and 61% owner-occupied homes. Of the homes, 61% privately owned, 29% owned by housing associations and 10% owned by other landlords. The most common construction periods in Hoorn are 1980-1990 (25%) and 1970-1980 (20%).
There are currently no homes for sale in Hoorn. The most recently listed home is Julianaplein 23 by Vidra Vastgoed Makelaars & Taxateurs op Funda. No homes were sold in Hoorn over the past year.
There are currently no homes for rent in Hoorn. The most recent home is Sleutelbloem 4, offered by Haring Expat Housing Services op Vastgoed Nederland. No homes were let in Hoorn over the past year.
No recent rental data available for Hoorn.
In Hoorn there are 23.214 addresses with a registered energy label. The most common labels are A (36%), B (23%) and C (23%). On average, an address in Hoorn uses 2.430 kWh of electricity per year. This is 5% below the national average of 2.550 kWh. With an annual consumption of 790 m³ per address, natural gas consumption is 1% below the national average of 800 m³.
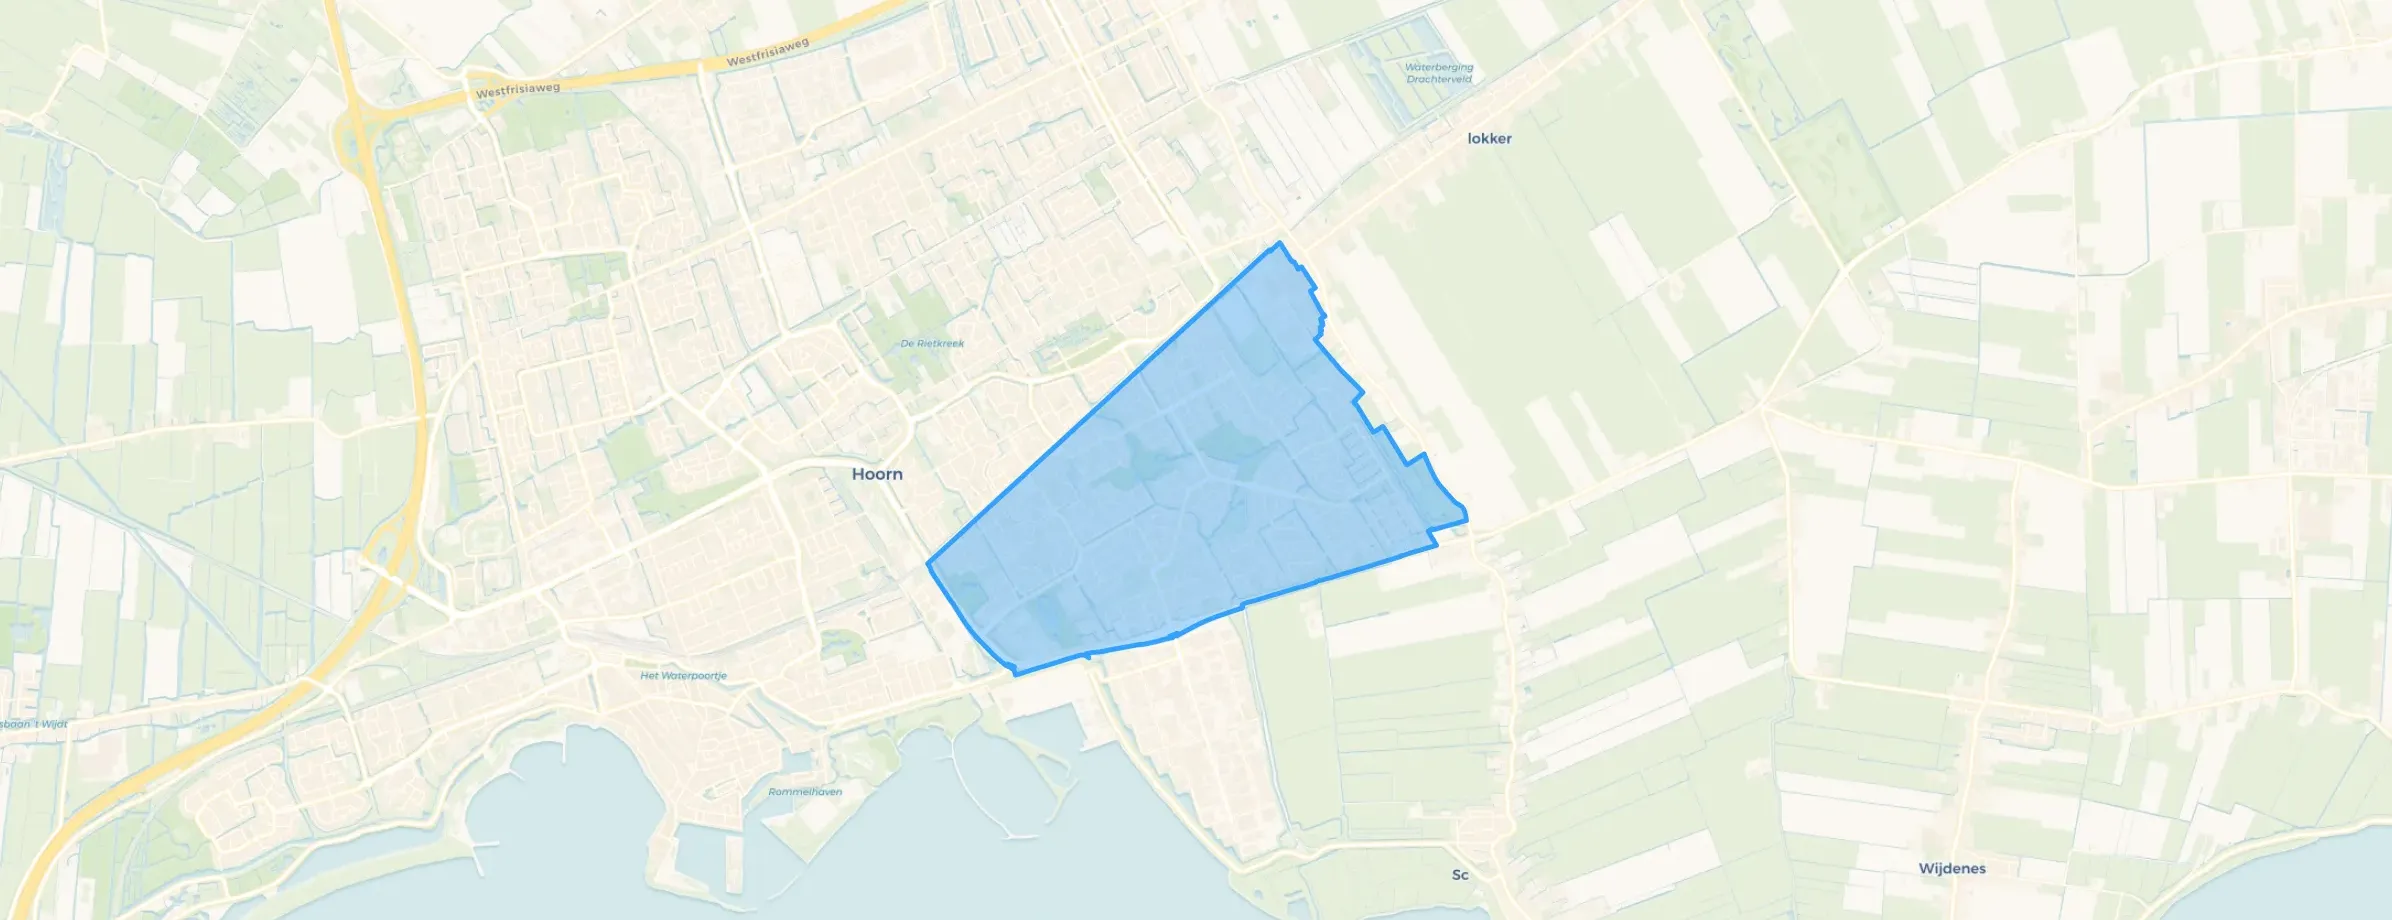
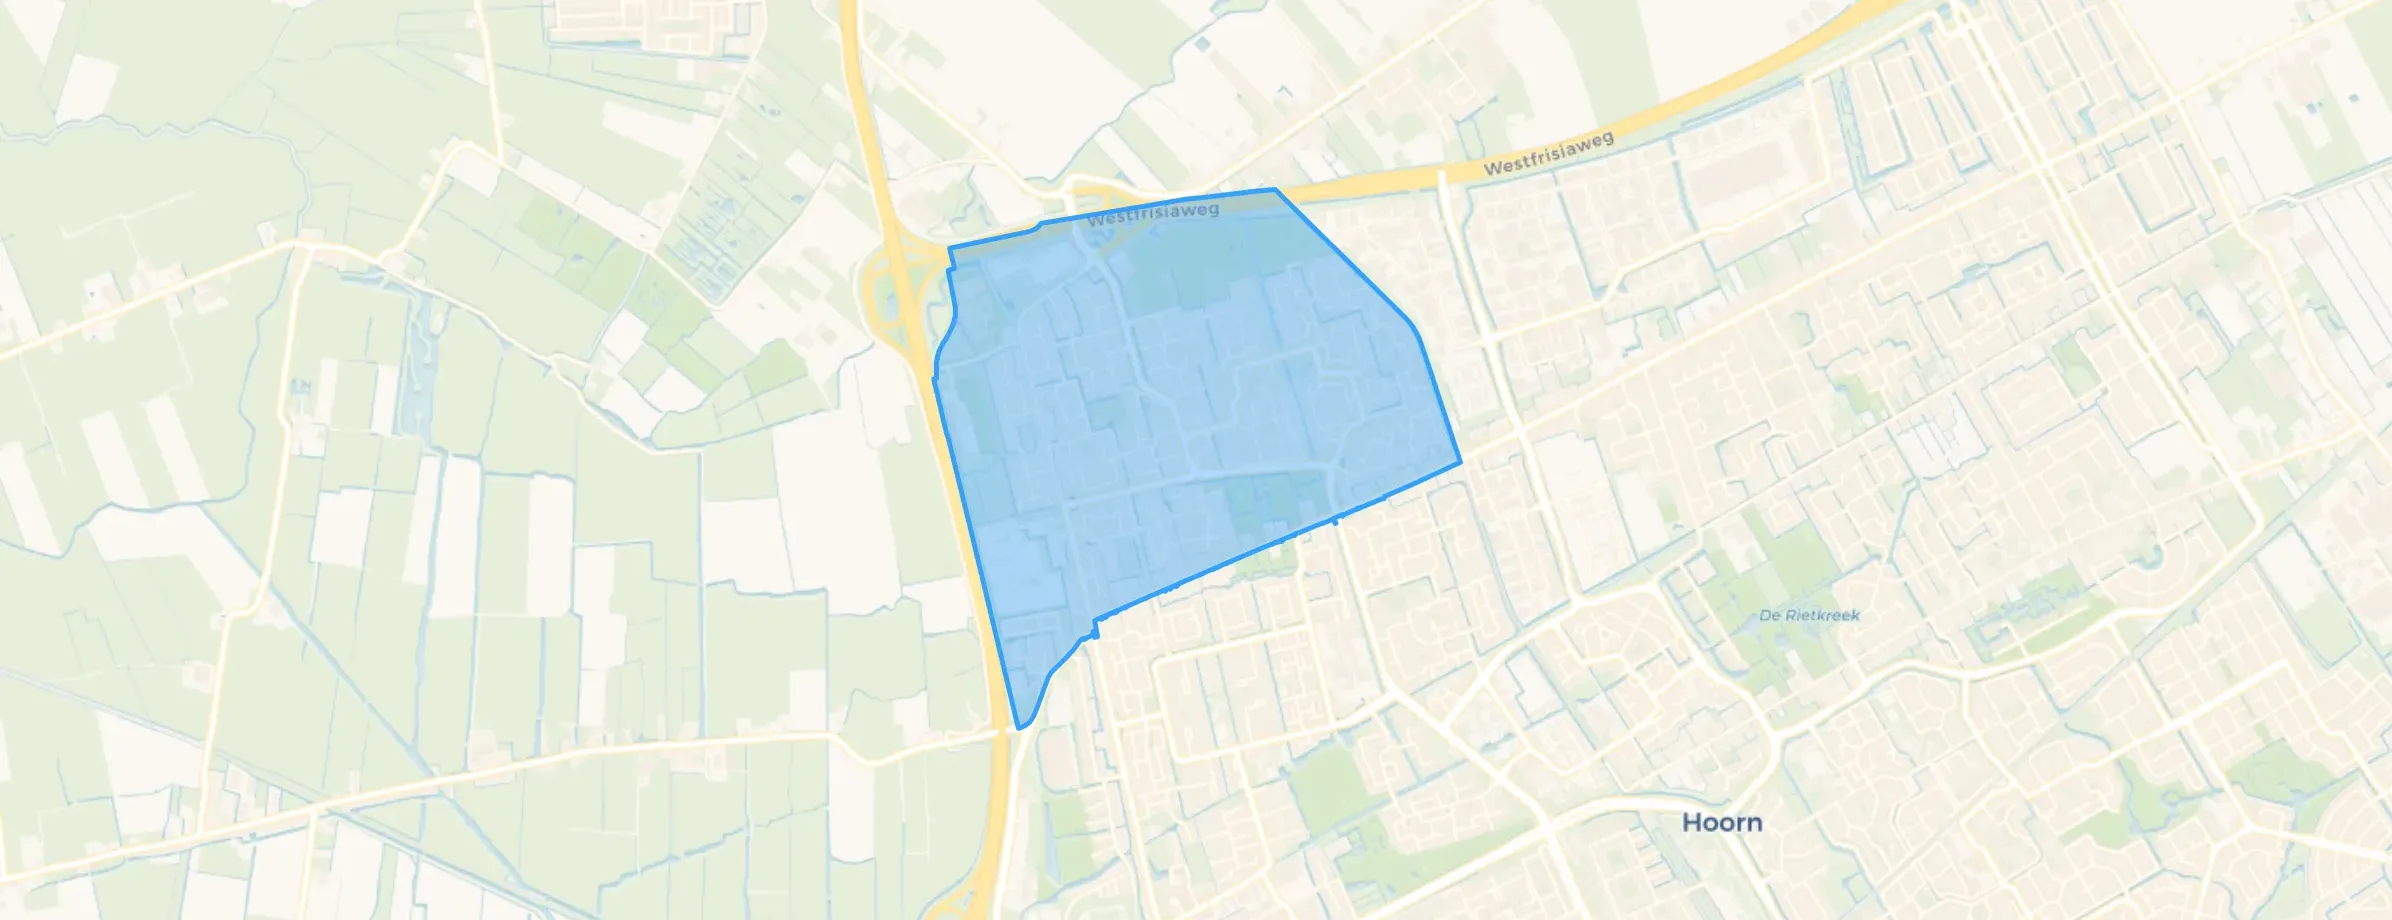


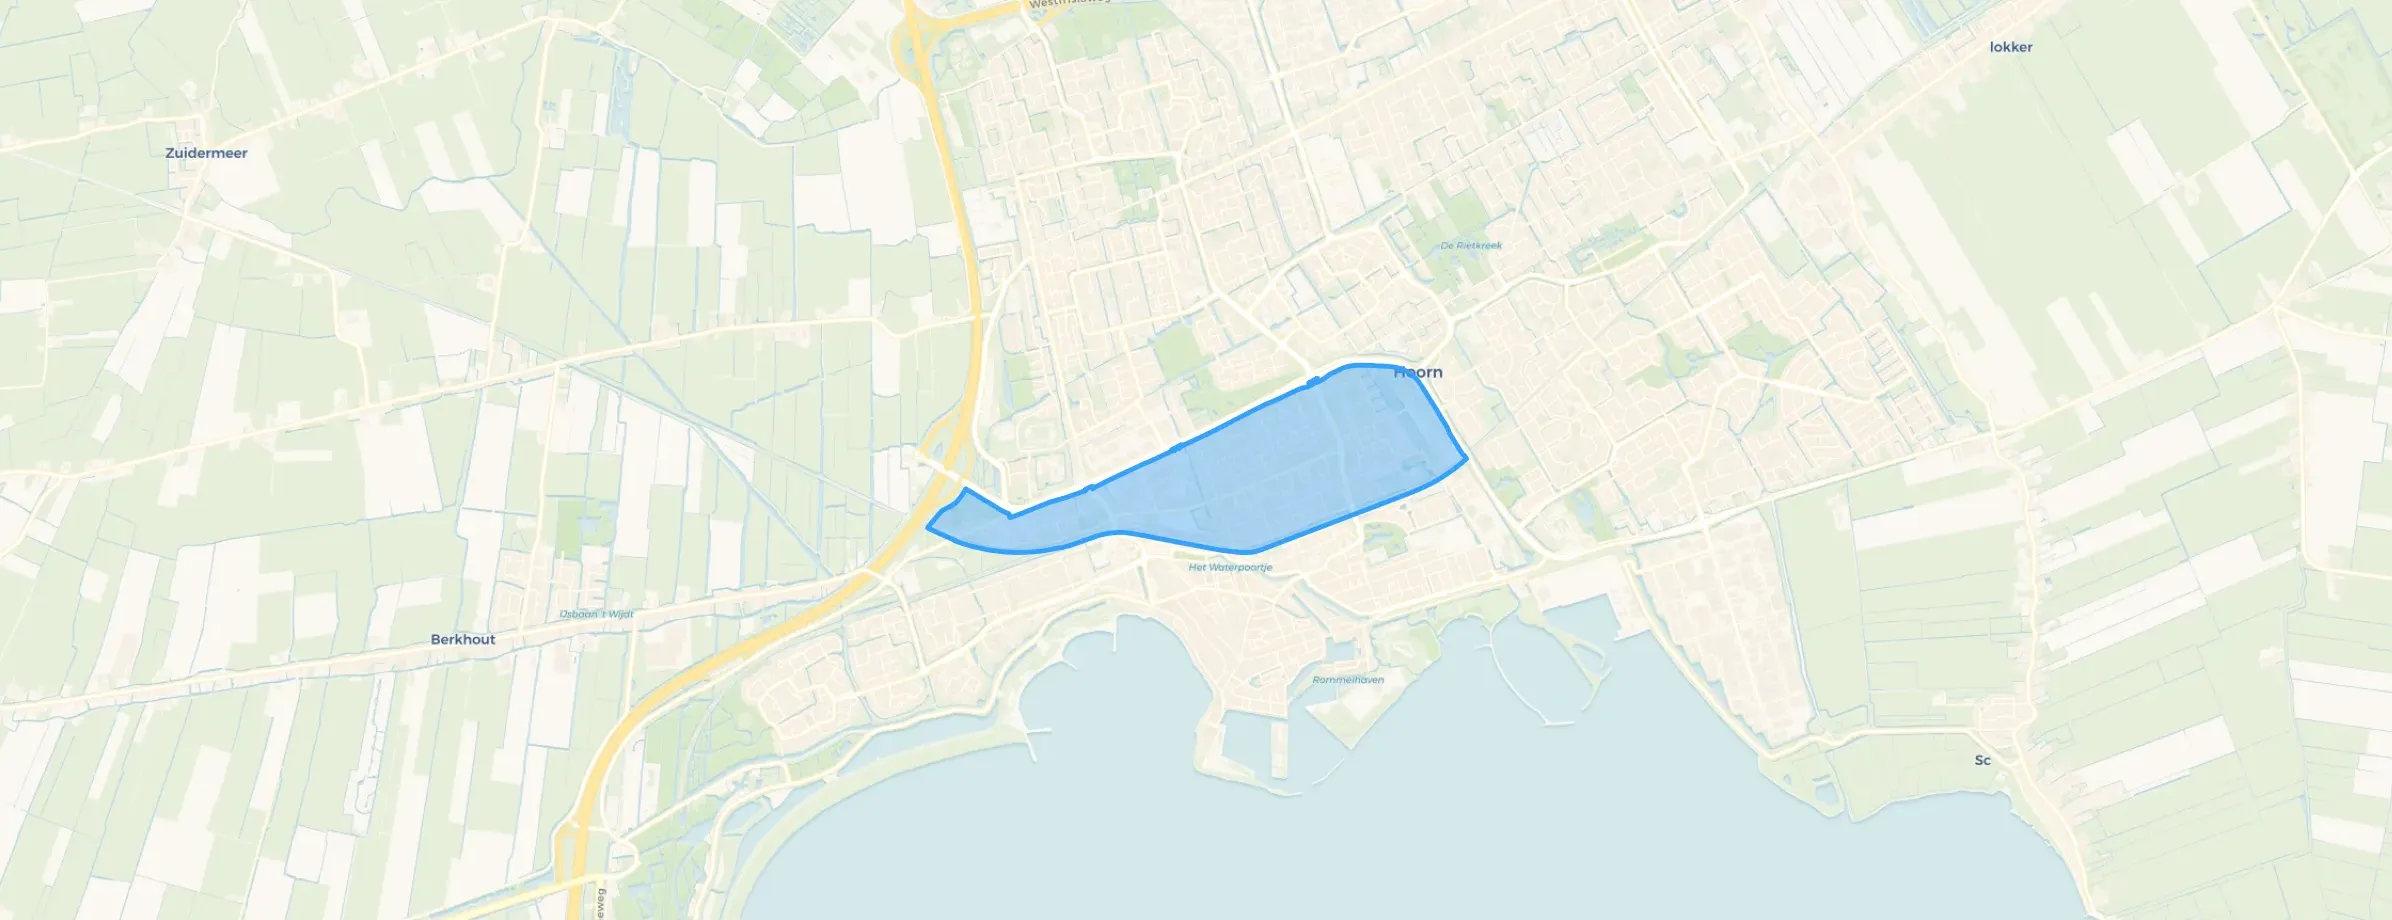


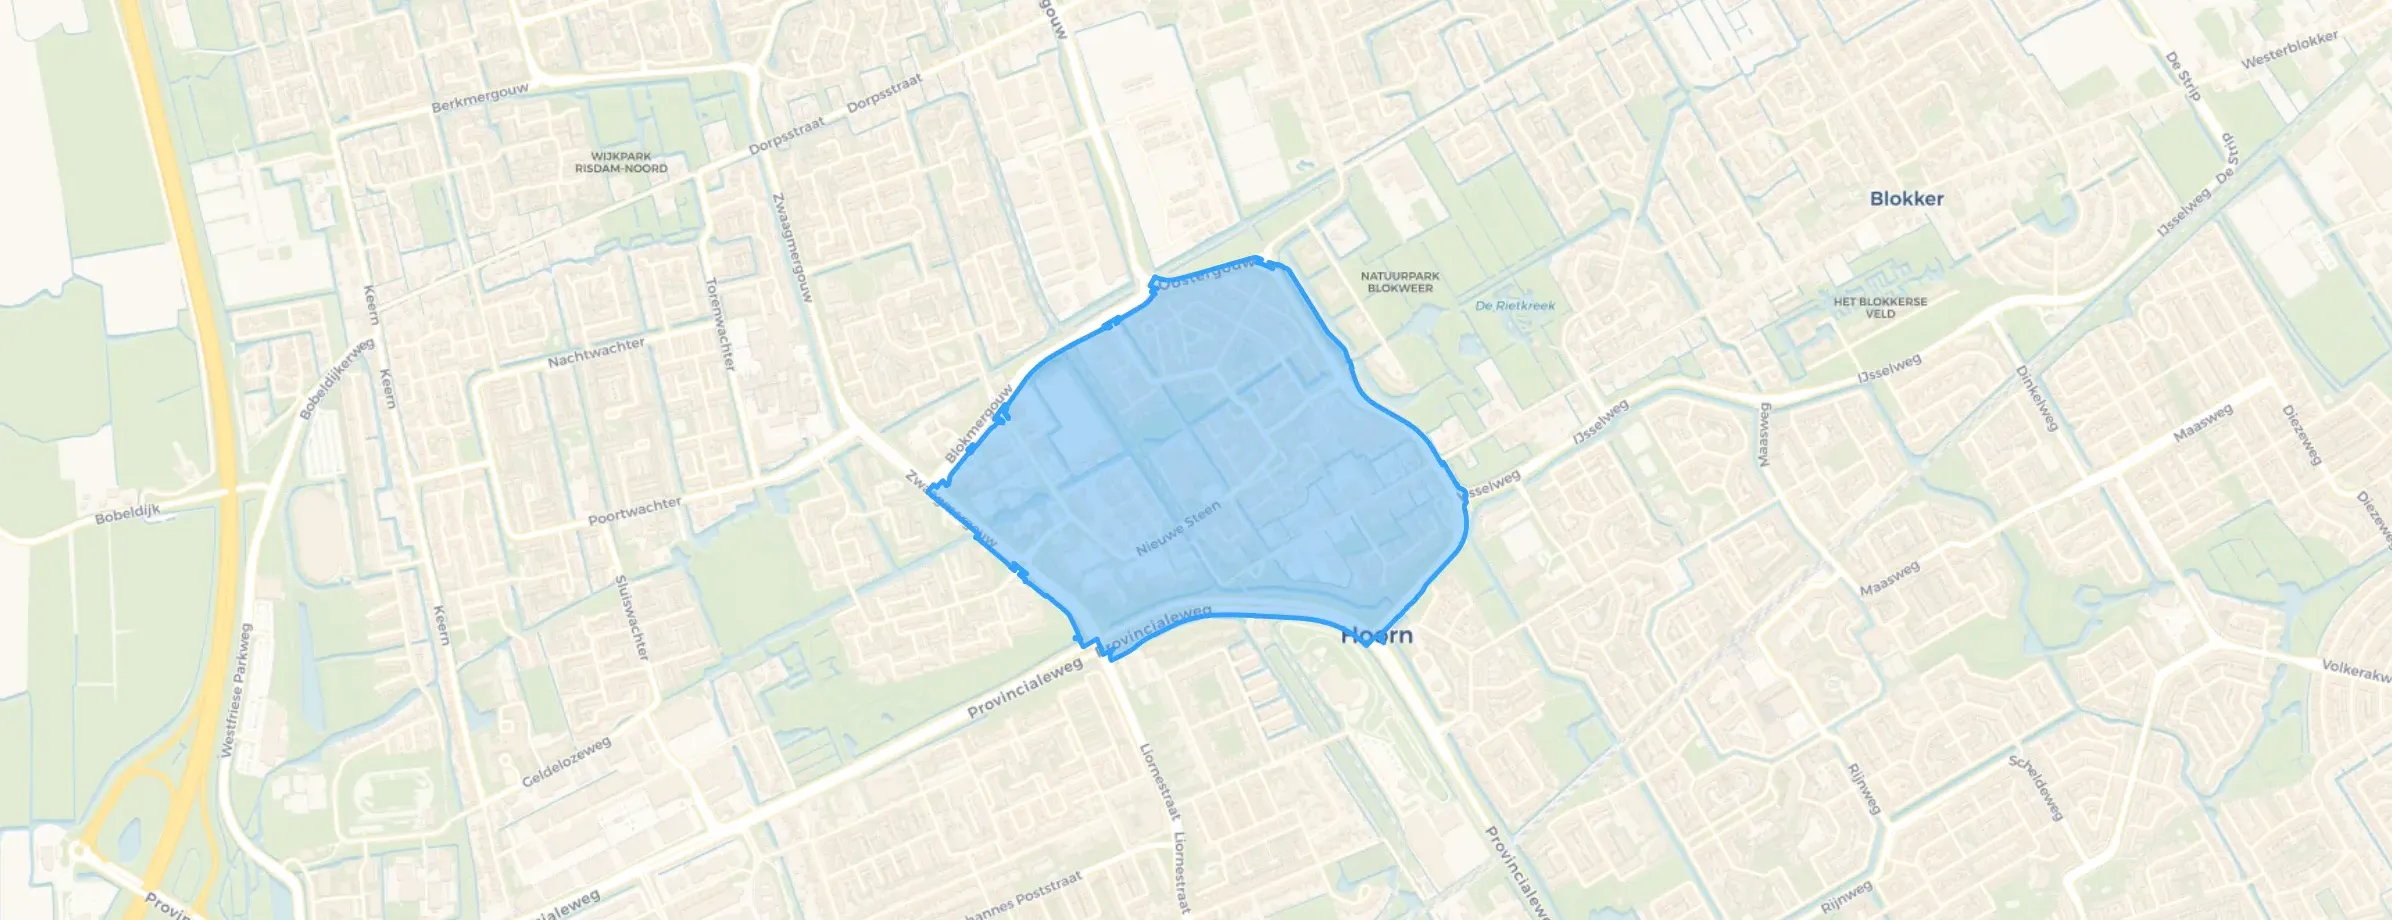


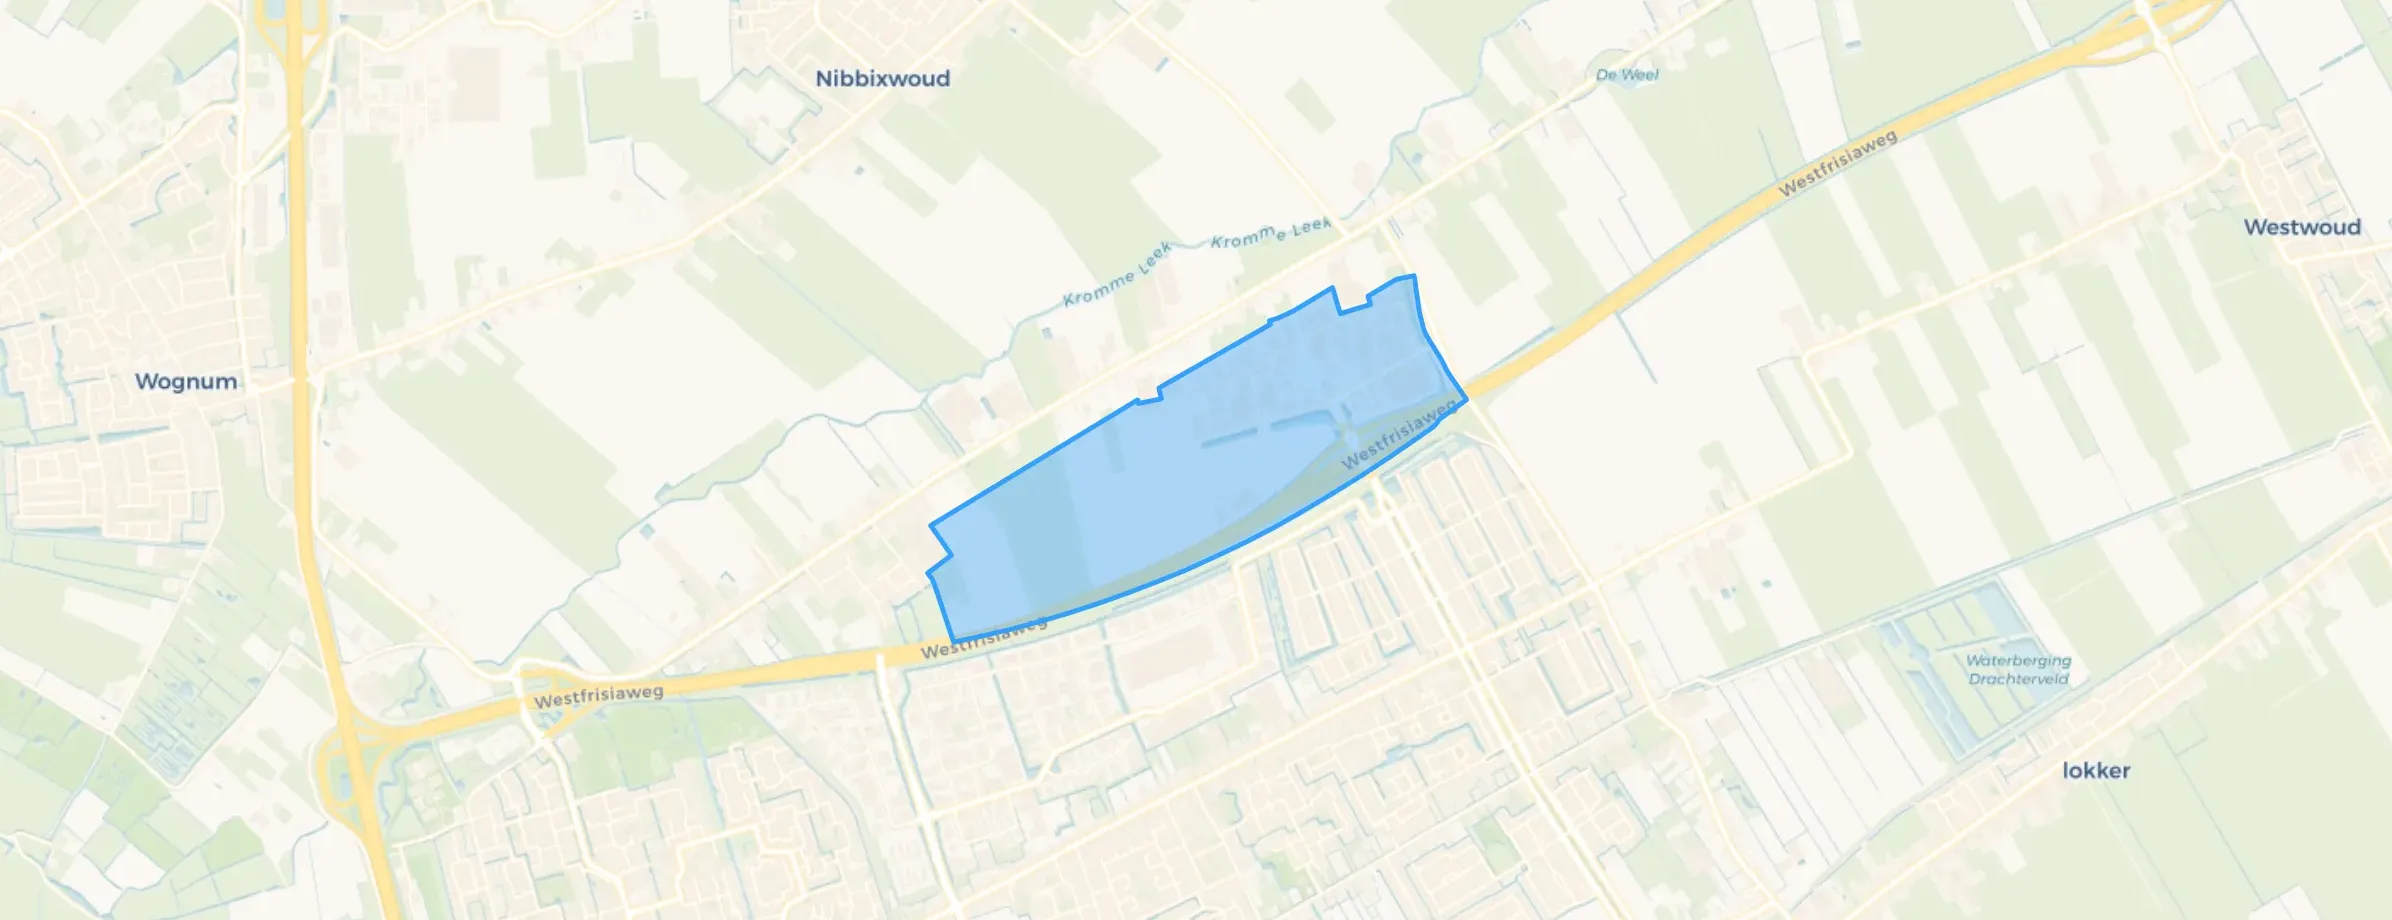
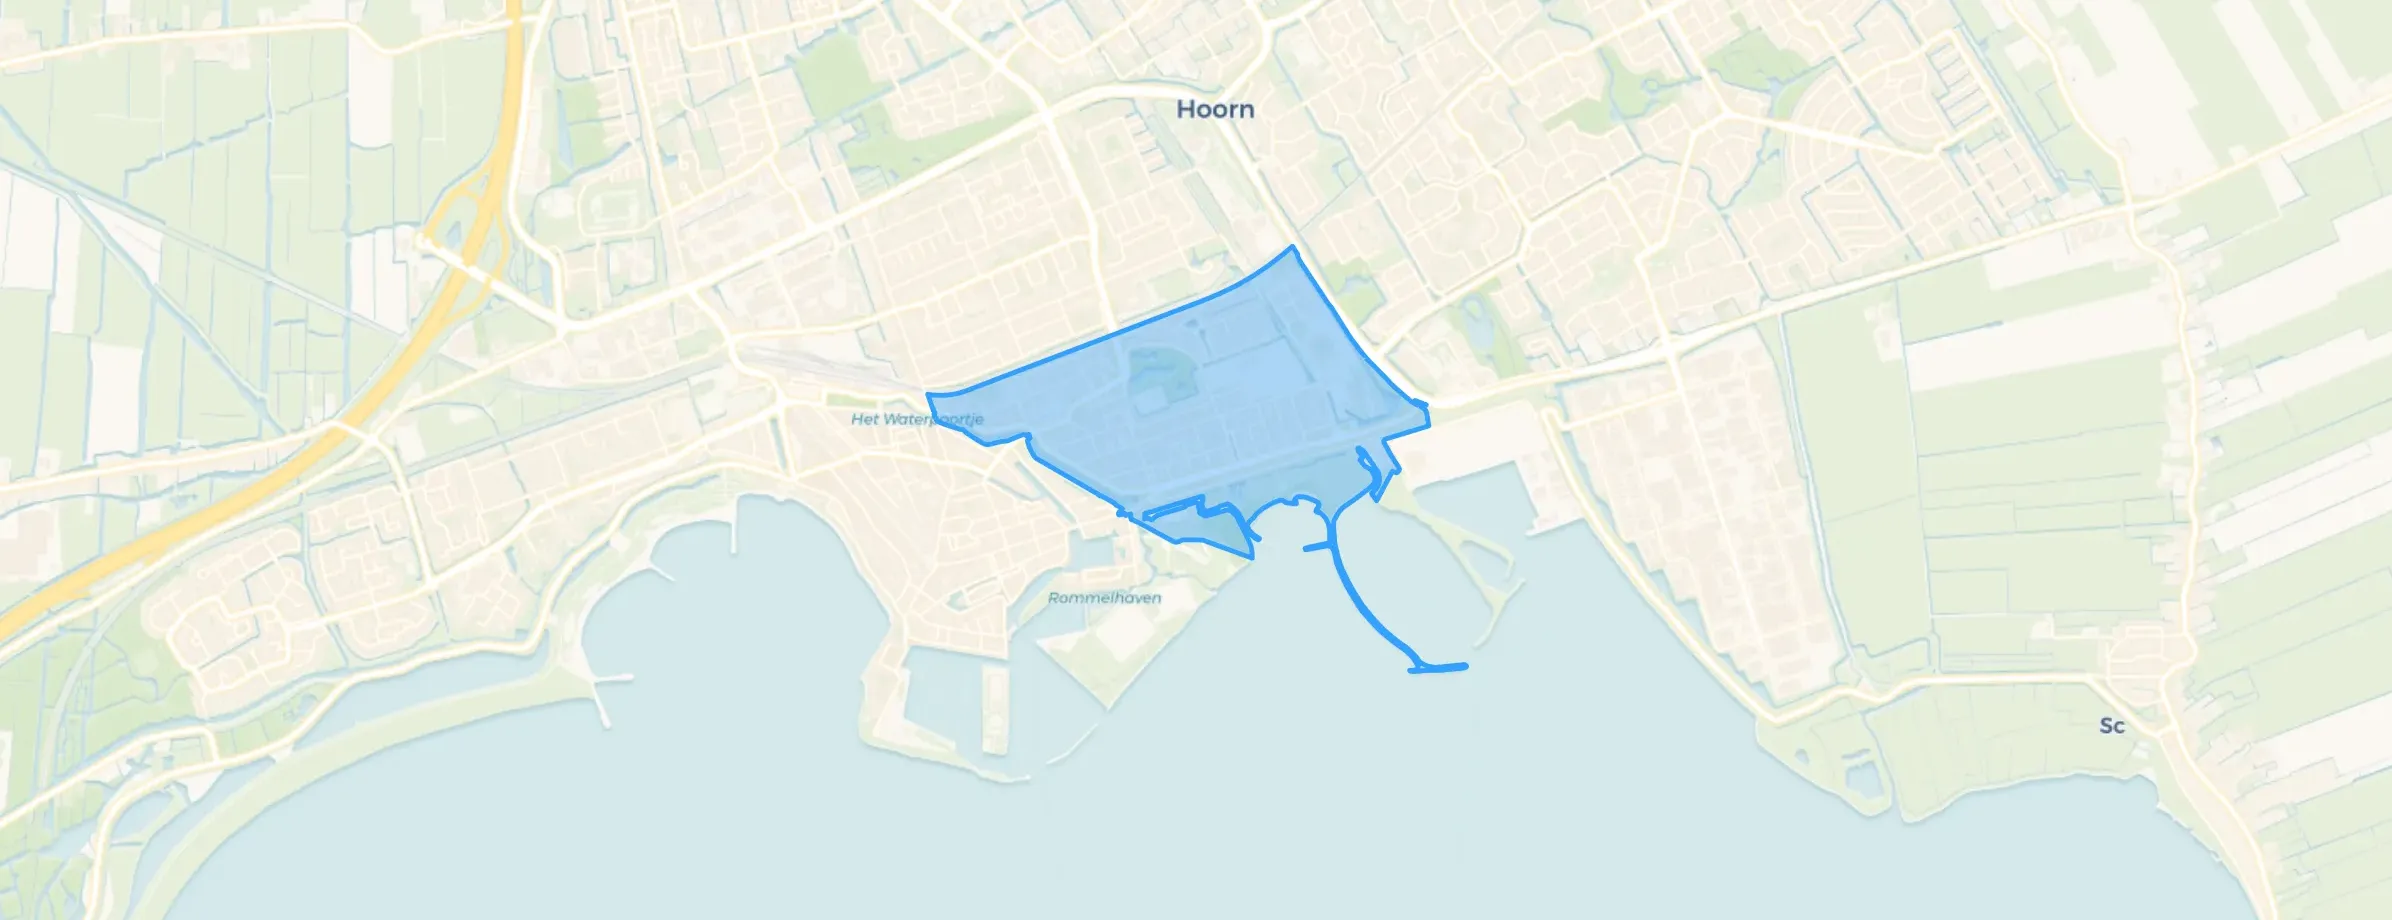

After living here for 12 years, the neighbourhood is going downhill, especially the street next door where there are many rental homes, many people live who don't treat fellow residents very well. Lots of litter lying around, messy gardens and loud talking, shouting and antisocial fatbike drivers who honk unnecessarily. Also leaving rubbish behind and hoping it will eventually be collected by waste collection services. There are schools but not enough types of education.
Auto-translated to English by AIIt's a very nice neighbourhood, everything you need in terms of supermarkets, pharmacies, etc. is within a maximum of 10 minutes by bike and therefore easily accessible. I don't have a lot of contact with my neighbours myself, and there aren't really any neighbourhood barbecues or cosy events/gatherings with the neighbourhood. My parents are a bit better friends with the neighbours. It is a very hygienic neighbourhood. There is a forest in the area, so there is certainly nature, but I do think there is too much manicured nature, which I think is a shame.
Auto-translated to English by AIVery cosy and close to all shops
Auto-translated to English by AIOkay
Auto-translated to English by AIIt's a beautiful neighbourhood! Cosy streets and nice architecture. Friendly and sociable people live here. Nice and quiet with no through traffic.
Auto-translated to English by AIOften arguments. And in the evening here in the garden, talking increasingly louder until shouting. And if you say something about it, you get a big mouth.
Auto-translated to English by AIA lot of nuisance, especially at night. Loudly talking youths and dealers/cars in the parking lot.. a lot of rubbish on pavements and in bushes.
Auto-translated to English by AII've been living here for almost 10 years and I'm happy here, sometimes things do happen but in which neighbourhood in Kersenboogerd doesn't that happen. Because why is someone arrested in front of my house by undercover police and people in my neighbourhood are always loud and that could be a bit less for me. Other than that, I think it's fine to live here for a few more years.
Auto-translated to English by AIOver the past year a home for sale in Hoorn was listed for an average of €475,895 (€4,136 per m²). That is 10% below the Dutch national average.
A rental home in Hoorn cost an average of €1,932 per month (€23 per m²). That is 11% below the national average.
Residents give Hoorn a 7.4 out of 10 based on 27 reviews. The strongest score is for education (7.8), the weakest for nature and greenery (6.8).
Gemeente Hoorn has 76,036 residents. Many families: 35% of the households have children.
The housing supply in Hoorn is remarkably efficient: 68% has an A, A+ or B label. The average natural gas consumption per household is 790 m³ per year.
From Hoorn you can on average reach a supermarket at 0.8 km, a GP at 0.8 km, a railway station at 2.0 km, a primary school at 0.7 km (as the crow flies, source: CBS).
Right now you will find 303 homes for sale and 41 homes for rent in Hoorn.