Municipality in Gelderland
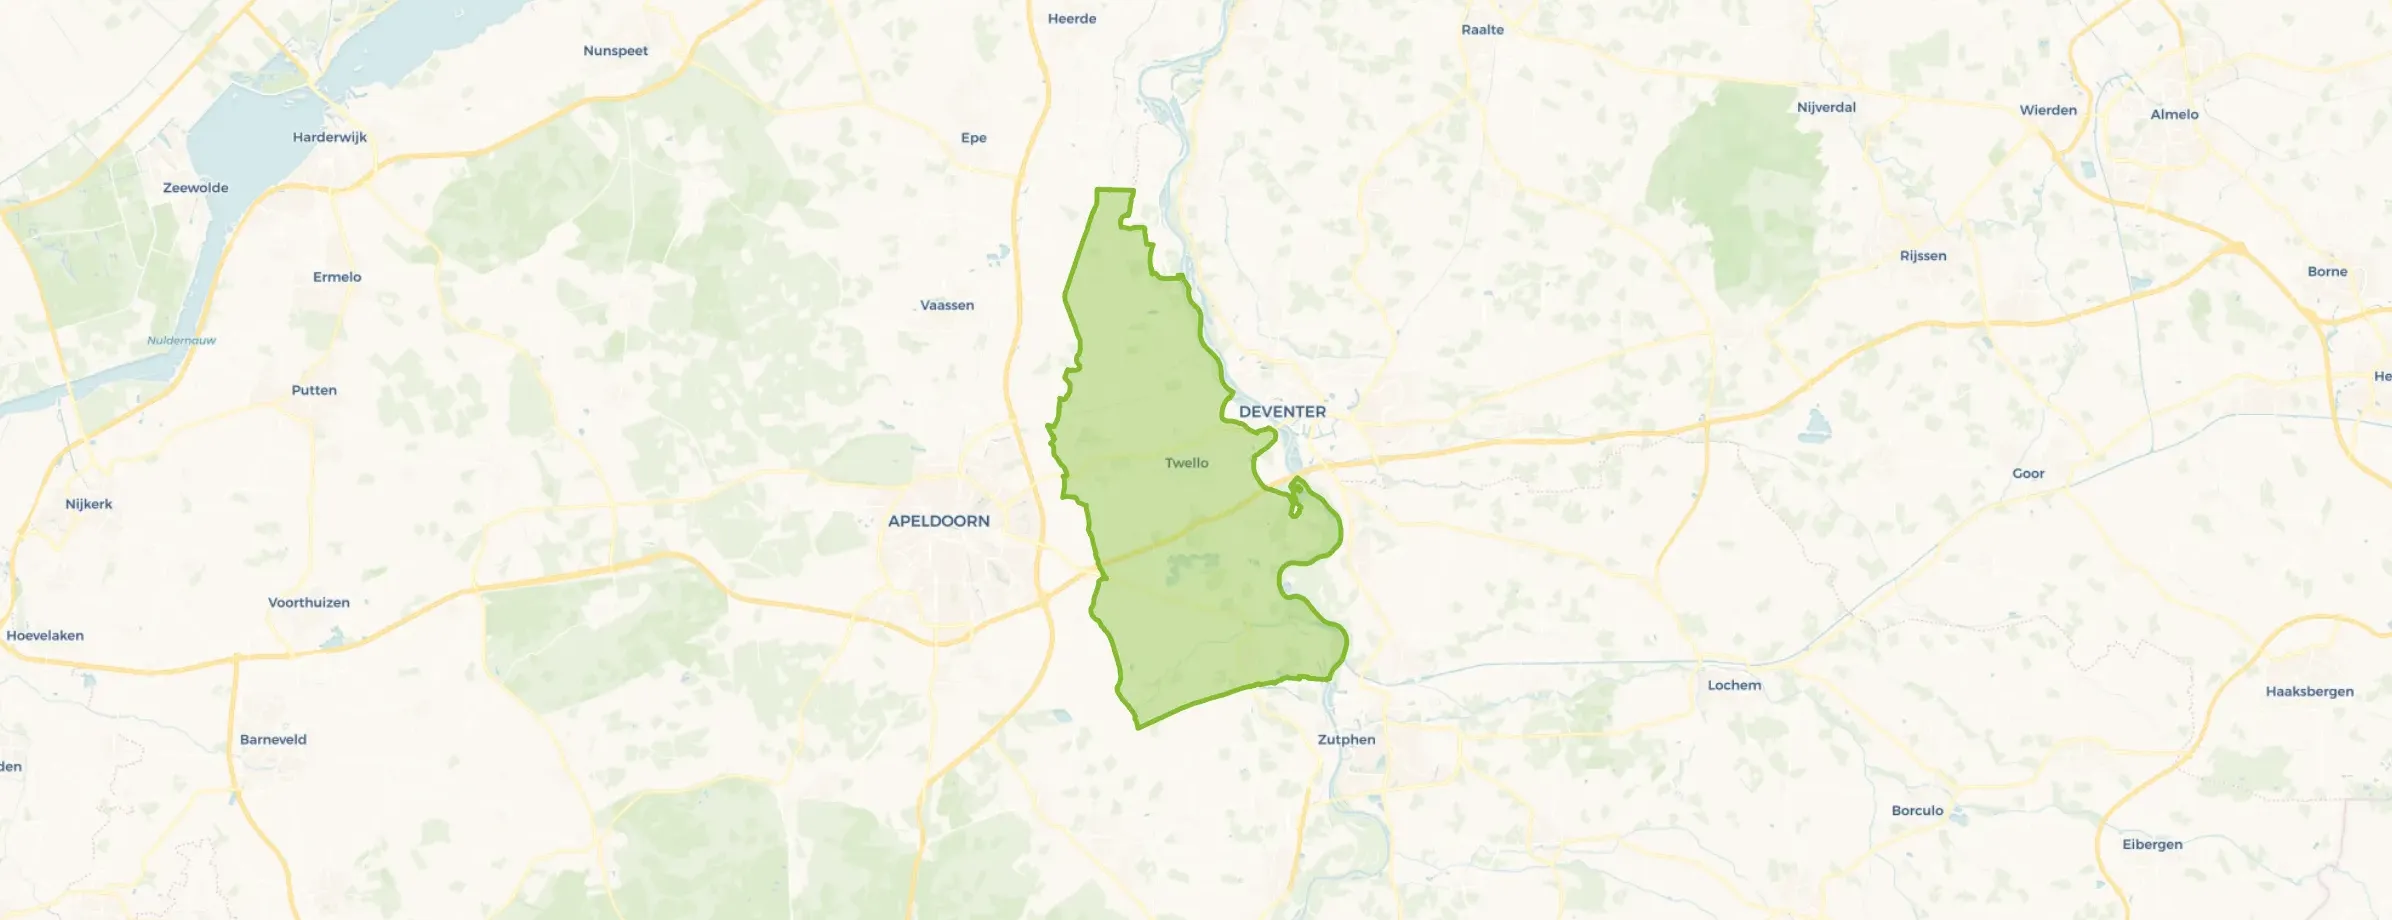
Voorst is located in the province of Gelderland The municipality has a total area of 12.647 hectares, of which 12.293 hectares are land and 354 hectares are water. The municipality is coded as GM0285. The postcode area is 7382AA-7439AT.
Voorst has 25.567 residents. Of these, 50,2% are men and 49,8% are women. Most residents are 45 to 65 years (27,7%). The other age groups are 26,1% for '65 years or older', 19,6% for '25 to 45 years', 15,6% for '0 to 15 years' and 11,0% for '15 to 25 years'. Of the residents, 44,4% is unmarried, 44,0% is married, 5,9% is divorced and 5,7% is widowed. 22.889 residents originate from the Netherlands, 914 come from Europe and 1.764 come from countries outside Europe.
There are 10.689 households in Voorst. 29,2% of these are single-person households, 36,3% households without children and 34,5% households with children. The average household size is 2,3 persons. The national average is 2,1 persons.
In Voorst there are 20.500 income recipients. The average income per income recipient is €41.600, which is €600 (1%) lower than the national average of €42.200. Per resident, the average income is €34.600, which is €300 (1%) lower than the national average of €34.900. Most residents of Voorst are educated to an intermediate level. 44,6% have an intermediate education (HAVO, VWO or MBO 2-4), 30,1% have a university or higher professional education (HBO/WO) and 25,4% have a lower education (VMBO or MBO 1).
Of the 25.567 residents, around 74% are in paid employment, which amounts to 18.920 people. This is 2% higher than the national average of 72%. The majority of workers are in salaried employment (80%), while 20% are self-employed. In Voorst, 30% of residents receive a benefit. The largest group is those receiving a state pension (AOW). 6.040 people receive this benefit.
In Voorst there are 10.929 homes with an average assessed value (WOZ) of €459.000. Of these, around 96% are occupied and 4% unoccupied. Most homes are owner-occupied. This amounts to 32% rental homes and 68% owner-occupied homes. Of the homes, 69% privately owned, 23% owned by housing associations and 8% owned by other landlords. The most common construction periods in Voorst are 1970-1980 (16%) and 1950-1970 (15%).
There are currently no homes for sale in Voorst. The most recently listed home is Nieuwe Veldjes 9 by Van den Belt Makelaars. No homes were sold in Voorst over the past year.
There are currently no homes for rent in Voorst. The most recent home is Grote Barteldweg 29, offered by www.woonkeus-stedendriehoek.nl. No homes were let in Voorst over the past year.
No recent rental data available for Voorst.
In Voorst there are 6.593 addresses with a registered energy label. The most common labels are A (29%), C (24%) and B (16%). On average, an address in Voorst uses 3.020 kWh of electricity per year. This is 18% above the national average of 2.550 kWh. Natural gas consumption, at 990 m³ per year, is 24% above the national average of 800 m³.


My boyfriend and I moved into this neighbourhood at the end of June, into our first home. The first few weeks were all very nice and cosy until August. The owner of Voskamp Textiel intimidated me by contacting my employer because I parked a work van in front of her shop, which is laid out as a public parking space. I then reported this to enforcement and spoke to her personally about her behaviour, telling her they would come. In September there was the neighbourhood BBQ. Again we had a nice time with the neighbours, but that too was short-lived. After asking in the neighbourhood app if people could keep an eye on their cats because our garden was being used as a toilet by neighbourhood cats, I was intimidated by a few households who thought I should move back to the west. This intimidation continued in writing until Christmas Eve. Since then it has fortunately been a bit quieter. Despite having very unpleasant neighbours, we enjoy the surroundings of Voorst and unfortunately also enjoy our home a bit less because it has many hidden defects and costs a lot of money.
Auto-translated to English by AINice neighbourhood, though many elderly people. More cohesion among neighbours would be welcome.
Auto-translated to English by AIIt's a cosy neighbourhood, there are often neighbourhood barbecues
Auto-translated to English by AIOver the past year a home for sale in Voorst was listed for an average of €707,418 (€4,541 per m²). That is 34% above the Dutch national average.
A rental home in Voorst cost an average of €1,437 per month (€14 per m²). That is 33% below the national average.
Residents give Voorst a 8.3 out of 10 based on 3 reviews. The strongest score is for nature and greenery (9.3), the weakest for community (6.0).
The housing supply in Voorst is remarkably efficient: 59% has an A, A+ or B label. The average natural gas consumption per household is 990 m³ per year.
From Voorst you can on average reach a supermarket at 1.6 km, a GP at 1.5 km, a railway station at 2.9 km, a primary school at 0.9 km (as the crow flies, source: CBS).
Right now you will find 90 homes for sale and 6 homes for rent in Voorst.