Municipality in Gelderland
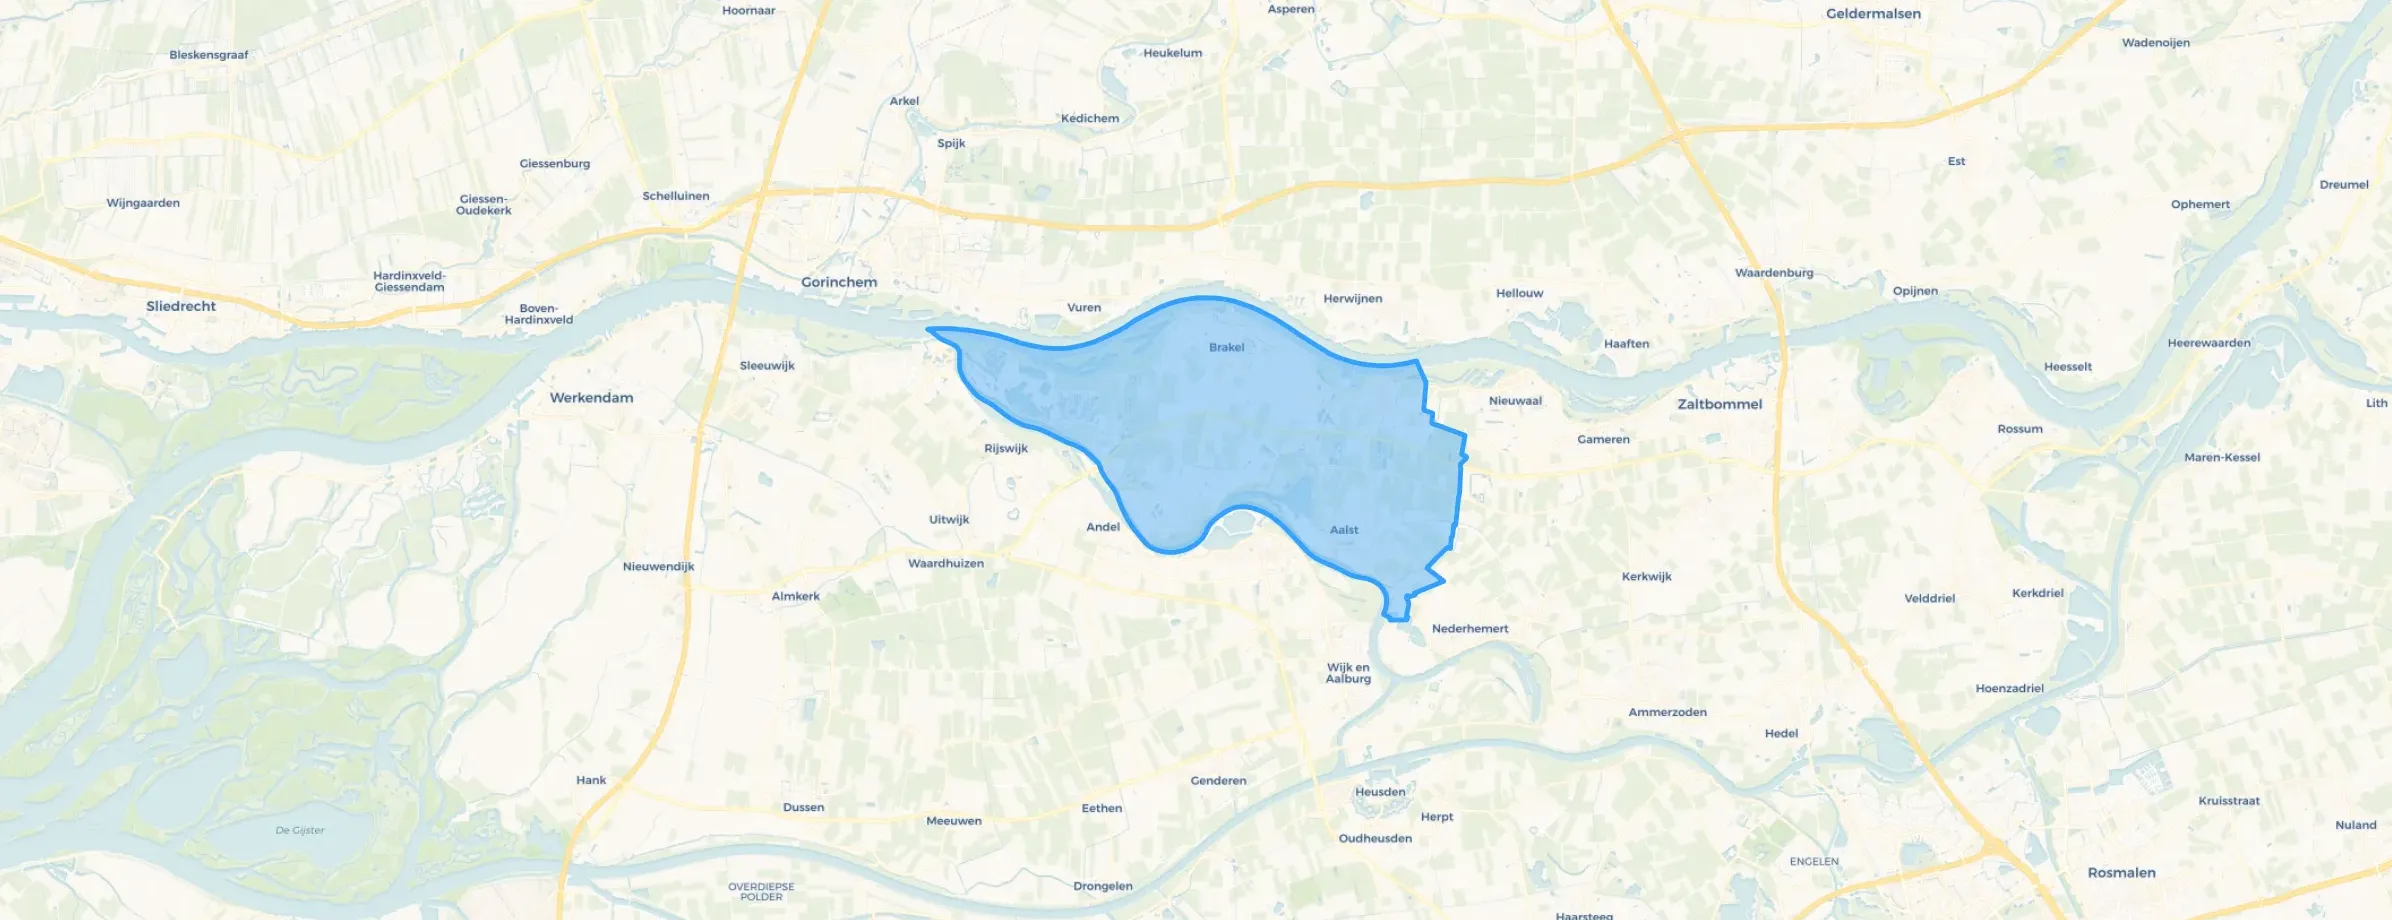
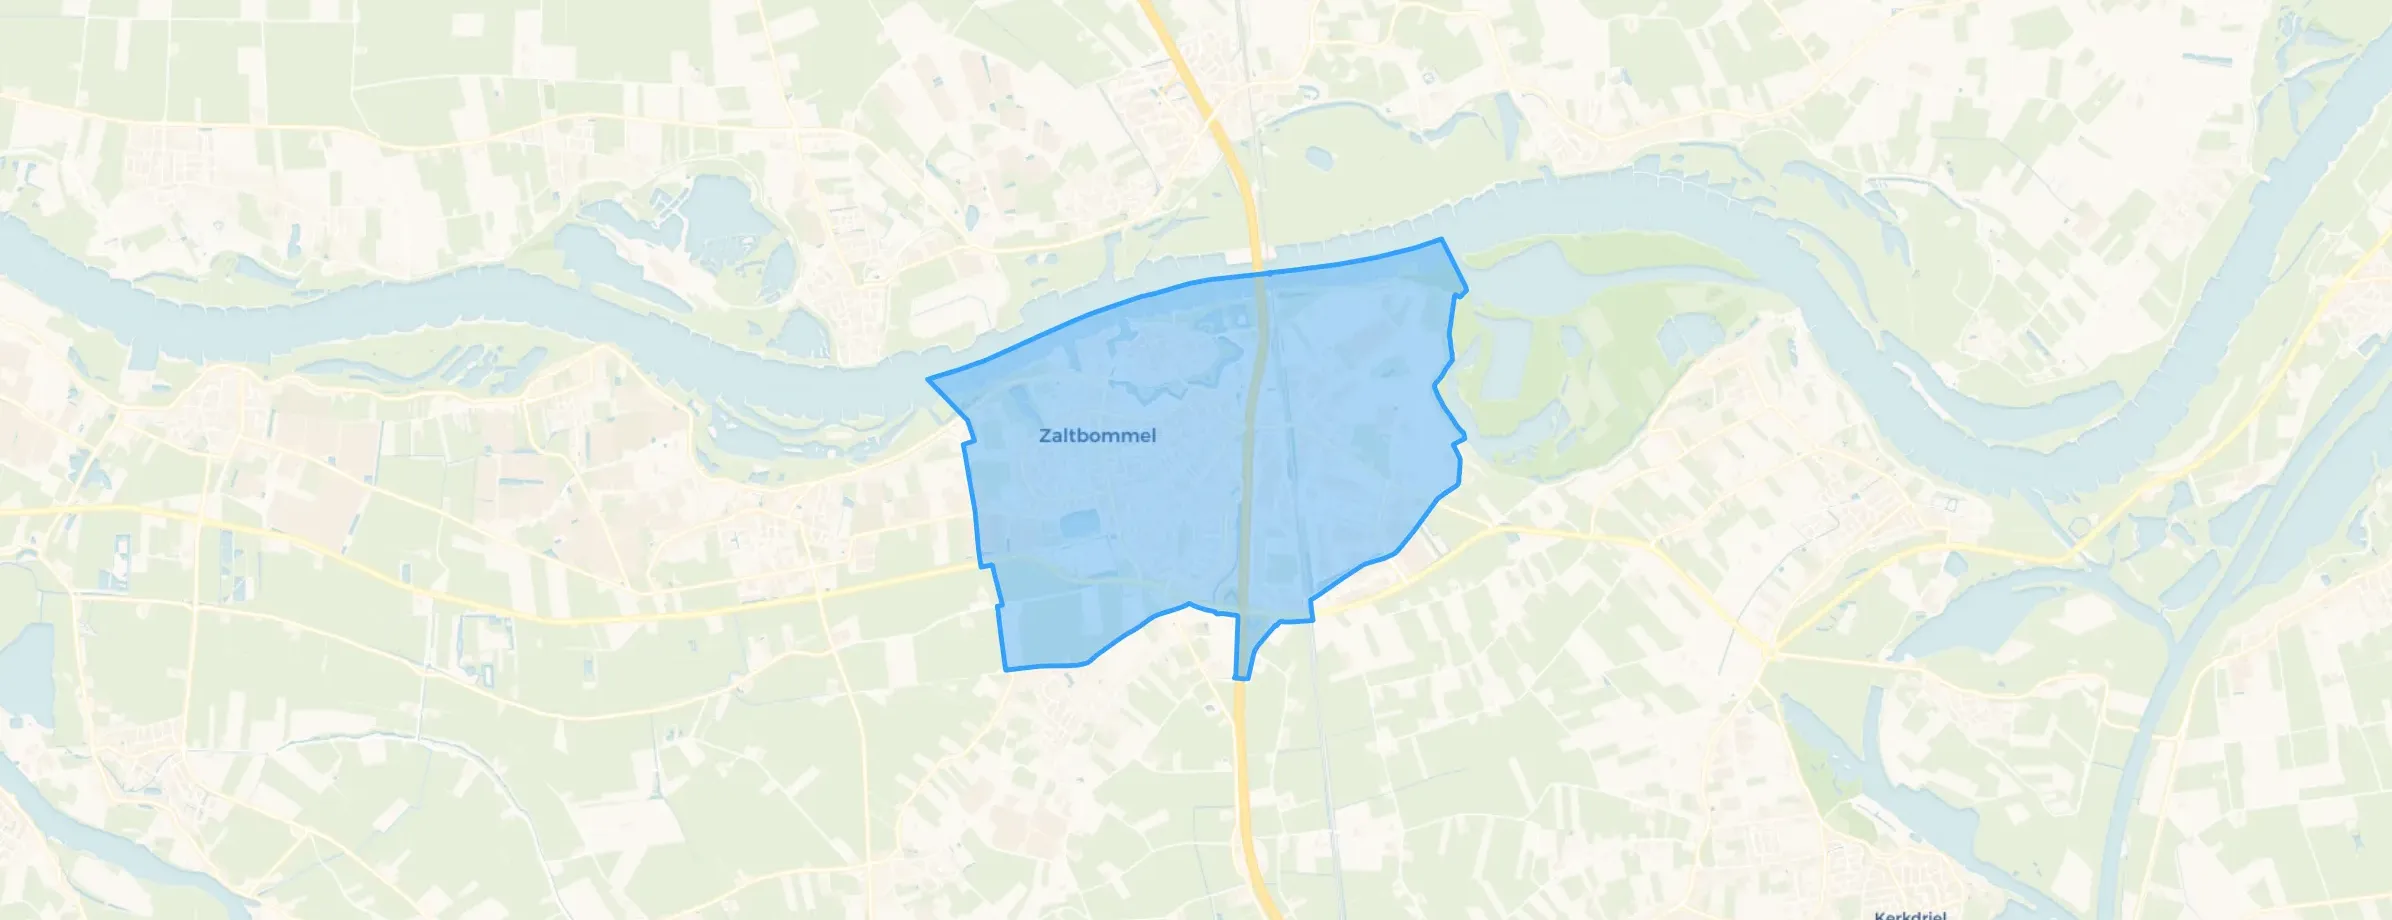
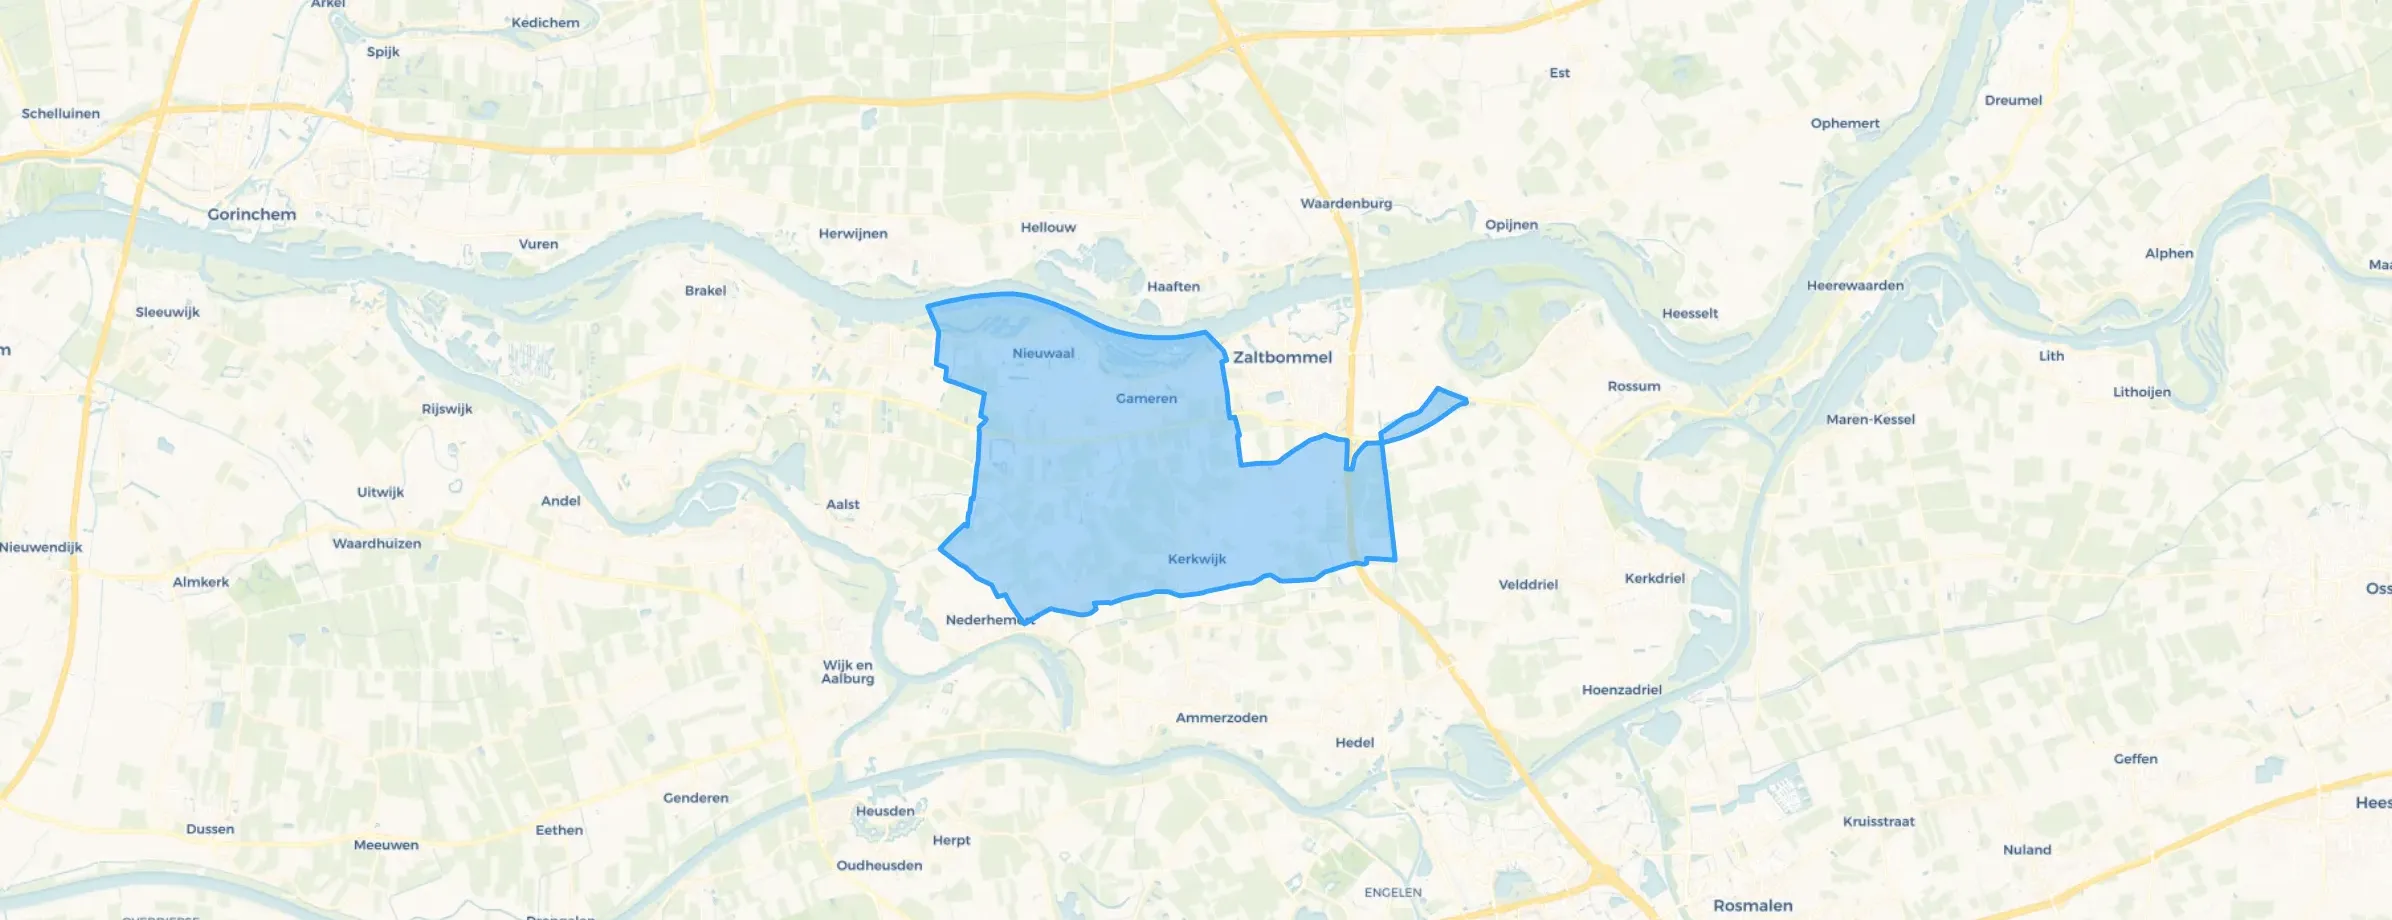
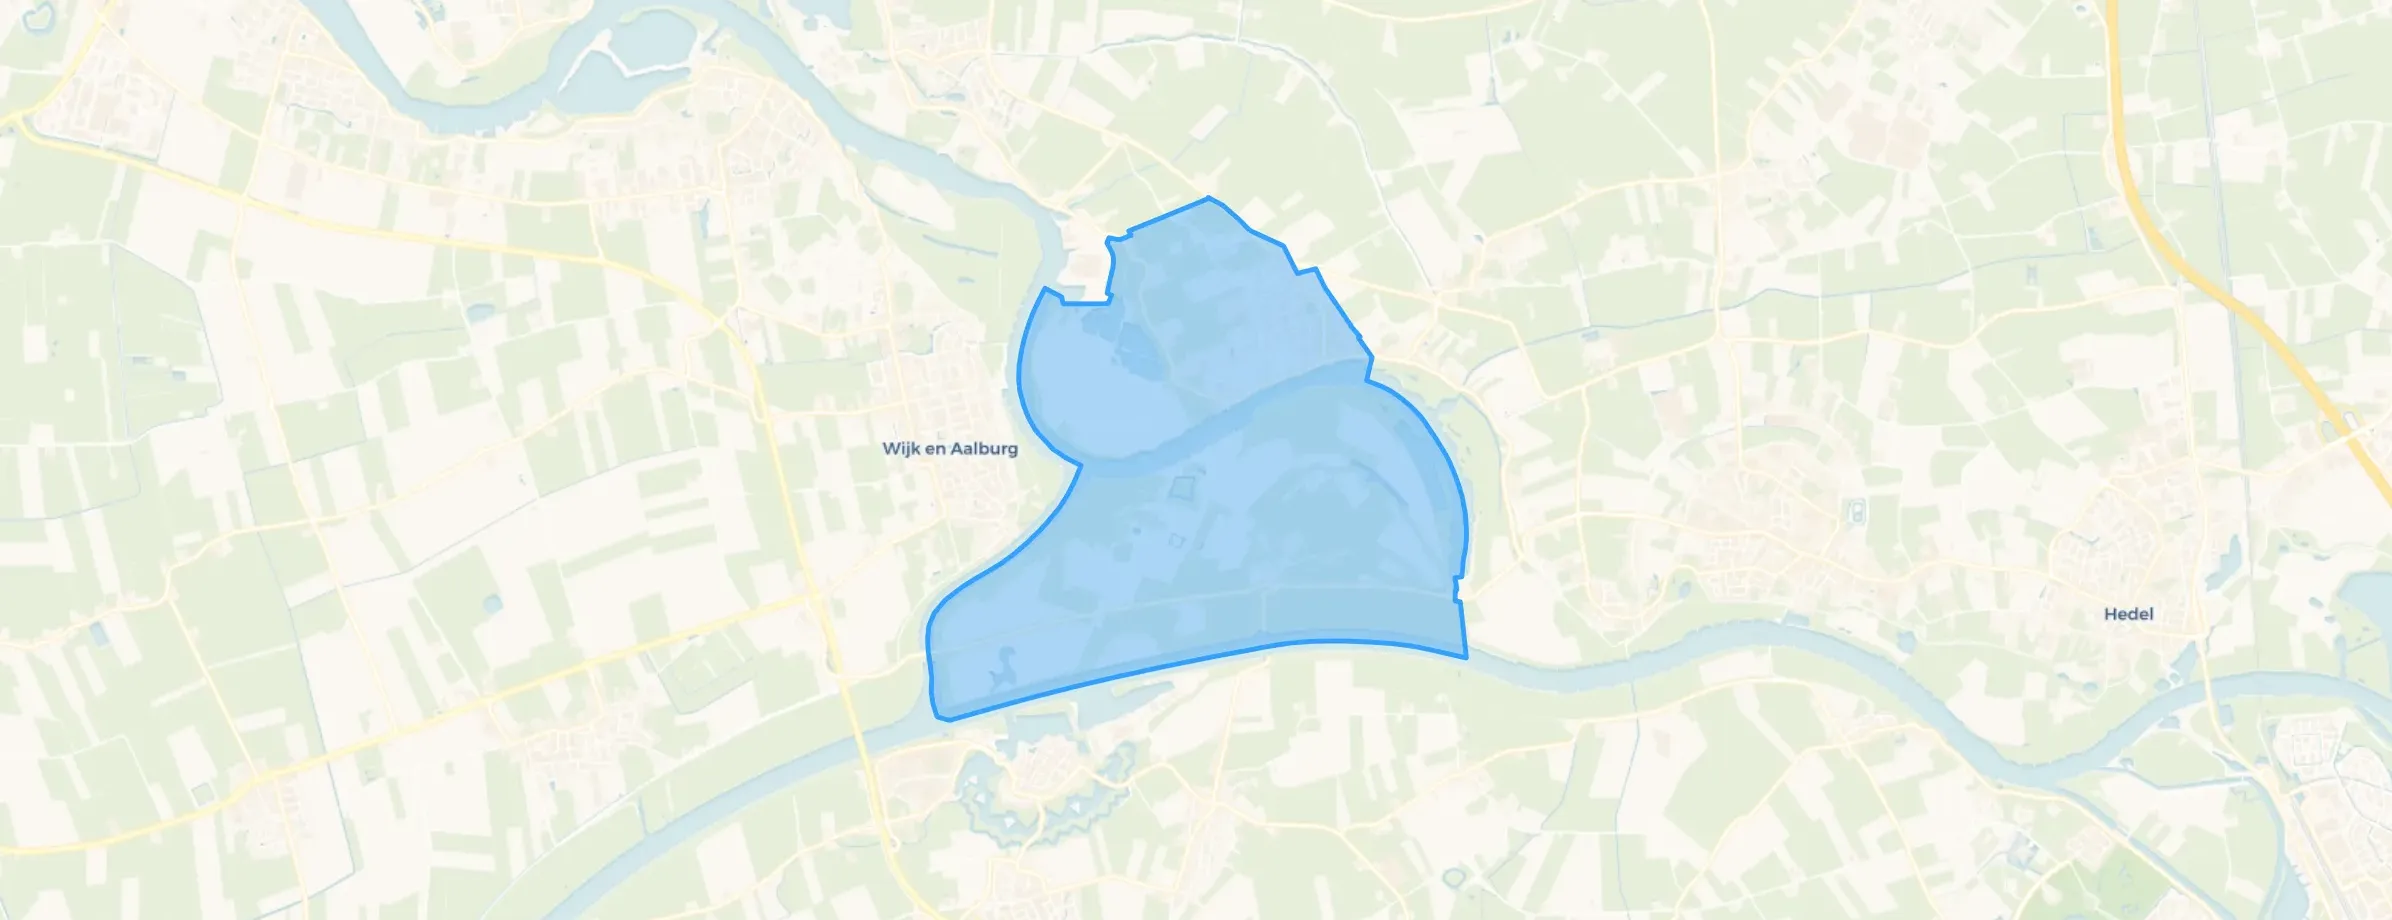
Zaltbommel is located in the province of Gelderland The municipality has a total area of 8.904 hectares, of which 7.865 hectares are land and 1.039 hectares are water. The municipality is coded as GM0297. The postcode area is 5301AA-5318LE.
Zaltbommel has 30.412 residents. Of these, 50,1% are men and 49,9% are women. Most residents are 45 to 65 years (26,0%). The other age groups are 24,2% for '25 to 45 years', 19,4% for '65 years or older', 17,2% for '0 to 15 years' and 13,2% for '15 to 25 years'. Of the residents, 46,3% is unmarried, 42,7% is married, 6,3% is divorced and 4,7% is widowed. 25.058 residents originate from the Netherlands, 2.649 come from Europe and 2.705 come from countries outside Europe.
There are 12.759 households in Zaltbommel. 32,9% of these are single-person households, 30,0% households without children and 37,1% households with children. The average household size is 2,4 persons. The national average is 2,1 persons.
In Zaltbommel there are 24.300 income recipients. The average income per income recipient is €41.100, which is €1.100 (3%) lower than the national average of €42.200. Per resident, the average income is €33.400, which is €1.500 (4%) lower than the national average of €34.900. Most residents of Zaltbommel are educated to an intermediate level. 43,3% have an intermediate education (HAVO, VWO or MBO 2-4), 29,0% have a lower education (VMBO or MBO 1) and 27,7% have a university or higher professional education (HBO/WO).
Of the 30.412 residents, around 76% are in paid employment, which amounts to 23.113 people. This is 4% higher than the national average of 72%. The majority of workers are in salaried employment (80%), while 20% are self-employed. In Zaltbommel, 23% of residents receive a benefit. The largest group is those receiving a state pension (AOW). 5.280 people receive this benefit.
In Zaltbommel there are 12.323 homes with an average assessed value (WOZ) of €404.000. Of these, around 96% are occupied and 4% unoccupied. Most homes are owner-occupied. This amounts to 33% rental homes and 67% owner-occupied homes. Of the homes, 67% privately owned, 24% owned by housing associations and 9% owned by other landlords. The most common construction periods in Zaltbommel are 1950-1970 (15%) and 1990-2000 (14%).
There are currently no homes for sale in Zaltbommel. The most recently listed home is Aakstraat 10 by Oomen Makelaardij & Taxaties Zaltbommel. No homes were sold in Zaltbommel over the past year.
There are currently no homes for rent in Zaltbommel. The most recent home is Karstraat 35, offered by Van der Wal Makelaars o.g. No homes were let in Zaltbommel over the past year.
No recent rental data available for Zaltbommel.
In Zaltbommel there are 7.965 addresses with a registered energy label. The most common labels are A (38%), C (19%) and B (14%). On average, an address in Zaltbommel uses 3.010 kWh of electricity per year. This is 18% above the national average of 2.550 kWh. Natural gas consumption, at 930 m³ per year, is 16% above the national average of 800 m³.

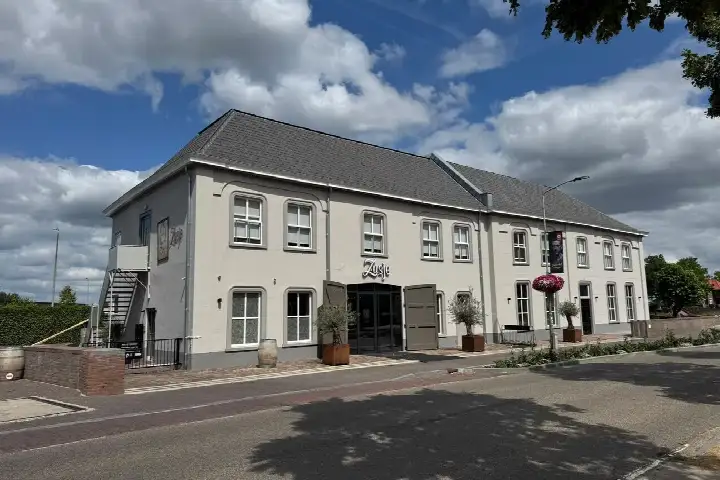
It is quiet and well-organised. People know each other
Auto-translated to English by AISurrounded by nature but still all amenities within walking distance, also a station nearby. Downside: due to roadworks, always having to take detours and the closure of several main roads at the same time.
Auto-translated to English by AIGood communication with fellow villagers and a safe atmosphere, a very pleasant neighbourhood!
Auto-translated to English by AII think it's a nice neighbourhood, although actually only the city centre is nice. I'm very pleased with Zaltbommel.
Auto-translated to English by AITidy neighbourhood
Auto-translated to English by AIIt's a village on a dike, with a canal and lots of nature around. In the village itself there are some bushes here and there, but also houses in between.
Auto-translated to English by AINeighbourhood is cosy and good. People are a bit more to themselves but everyone knows each other well. Few amenities, because it's outside the city.
Auto-translated to English by AIVery nice, good group chat of the village too
Auto-translated to English by AIOver the past year a home for sale in Zaltbommel was listed for an average of €554,684 (€3,988 per m²). Last quarter prices fell by 9%.
A rental home in Zaltbommel cost an average of €1,192 per month (€14 per m²).
Residents give Zaltbommel a 8.0 out of 10 based on 11 reviews. Nature and greenery stands out with a 8.6; amenities lags behind with a 6.9.
Gemeente Zaltbommel has 30,412 residents. Many families: 37% of the households have children.
The housing supply in Zaltbommel is remarkably efficient: 61% has an A, A+ or B label. The average natural gas consumption per household is 930 m³ per year.
From Zaltbommel you can on average reach a supermarket at 1.2 km, a GP at 1.2 km, a railway station at 5.6 km, a primary school at 0.7 km (as the crow flies, source: CBS).
Right now you will find 204 homes for sale and 11 homes for rent in Zaltbommel.