Neighbourhood in Groningen
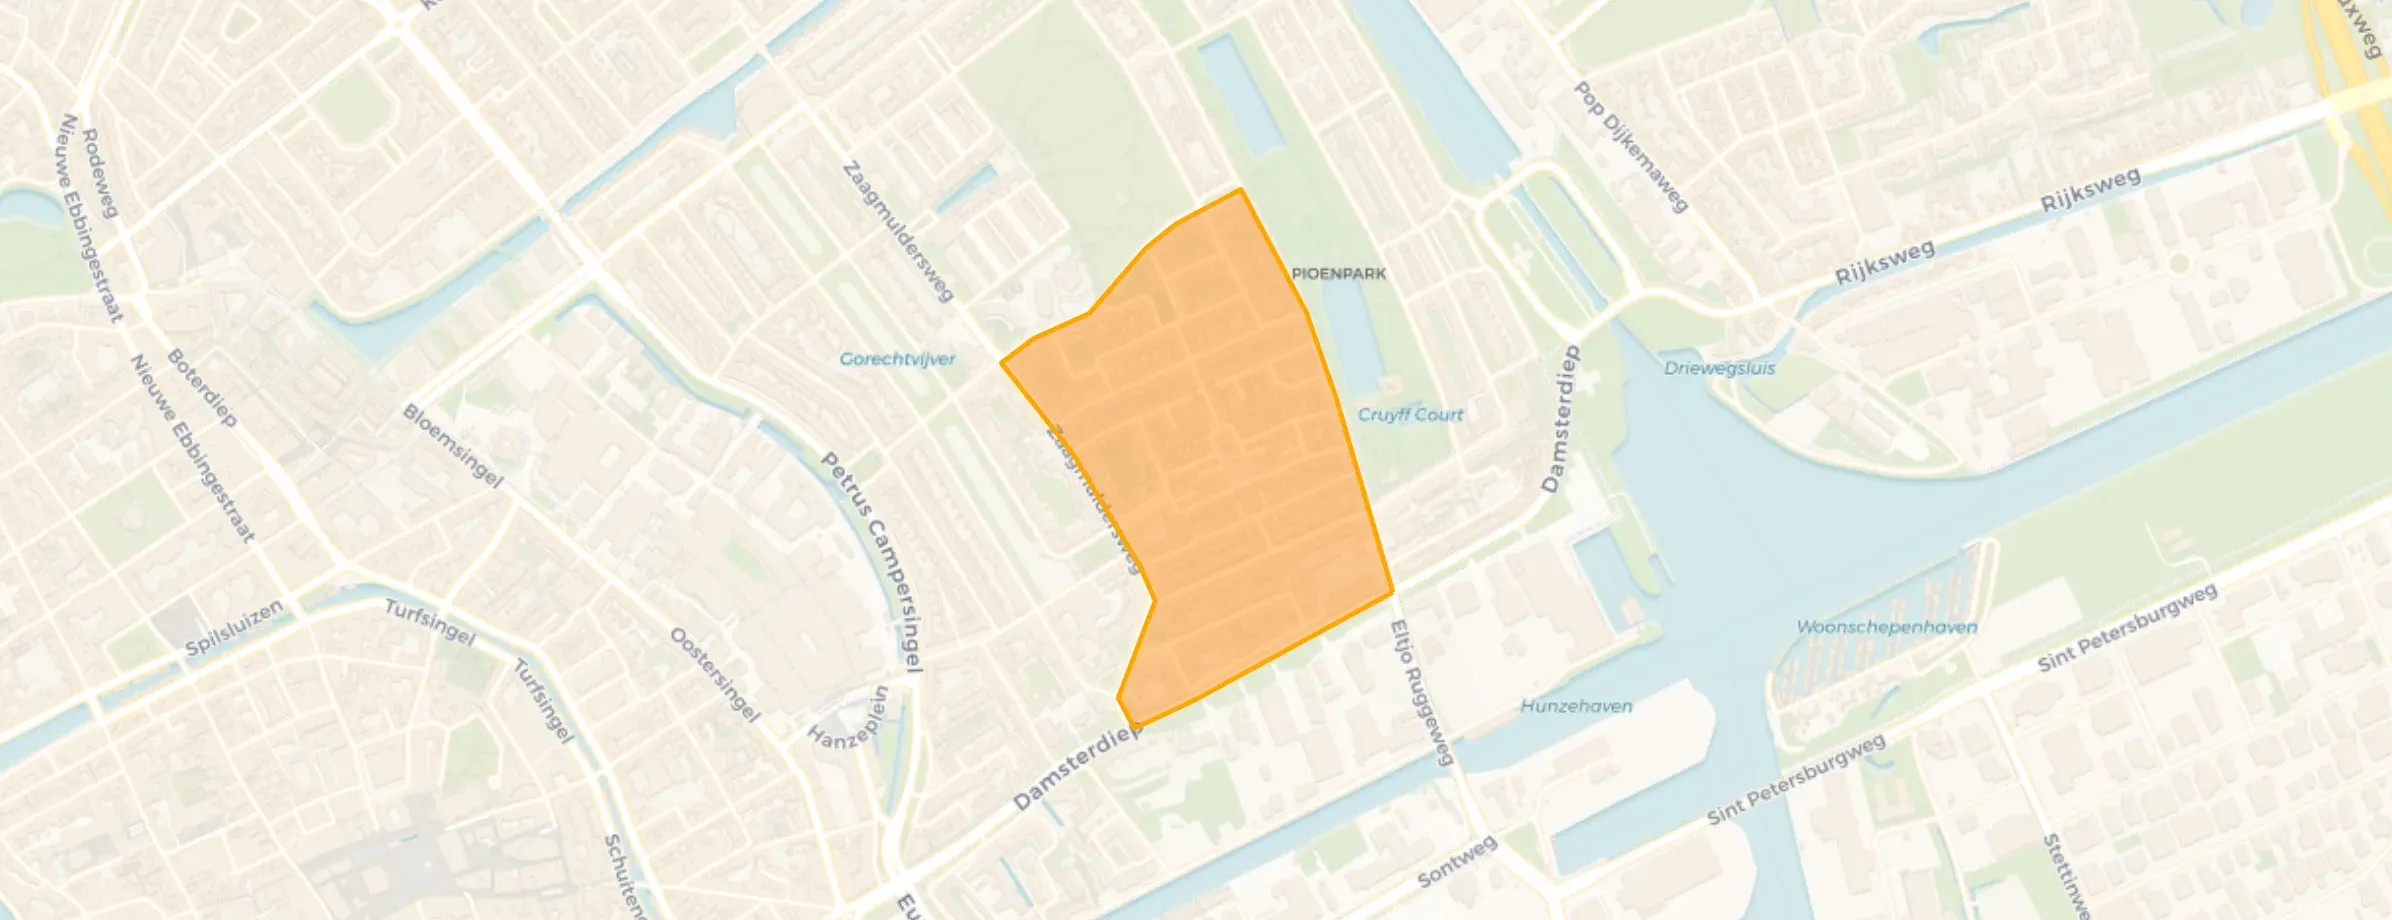
Bloemenbuurt is located in the province of Groningen, in the municipality of Groningen, in the district Oud-Oost The neighbourhood has a total area of 23 hectares, of which 23 hectares are land and 0 hectares are water. The neighbourhood is coded as BU00140402. The postcode area is 9713EN-9713VH.
Two residents rate the neighbourhood as good with a score of 7.9. They describe it as 'Nice but small' and 'Mixed company'. Based on a limited number of reviews, no clear trends are visible yet in this neighbourhood.
Bloemenbuurt has 2.765 residents. Of these, 49,9% are men and 49,9% are women. Most residents are 25 to 45 years (40,7%). The other age groups are 24,8% for '45 to 65 years', 13,0% for '15 to 25 years', 12,5% for '0 to 15 years' and 9,0% for '65 years or older'. Of the residents, 76,3% is unmarried, 12,3% is married, 9,8% is divorced and 1,6% is widowed. 1.910 residents originate from the Netherlands, 220 come from Europe and 635 come from countries outside Europe.
There are 1.810 households in Bloemenbuurt. 64,1% of these are single-person households, 17,7% households without children and 18,2% households with children. The average household size is 1,5 persons. The national average is 2,1 persons.
In Bloemenbuurt there are 2.300 income recipients. The average income per income recipient is €29.300, which is €12.900 (31%) lower than the national average of €42.200. Per resident, the average income is €27.000, which is €7.900 (23%) lower than the national average of €34.900. Most residents of Bloemenbuurt are educated to an intermediate level. 38,0% have an intermediate education (HAVO, VWO or MBO 2-4), 37,6% have a university or higher professional education (HBO/WO) and 24,5% have a lower education (VMBO or MBO 1).
Of the 2.765 residents, around 63% are in paid employment, which amounts to 1.742 people. This is 9% lower than the national average of 72%. The majority of workers are in salaried employment (88%), while 12% are self-employed. In Bloemenbuurt, 28% of residents receive a benefit. The largest group is those receiving a social assistance benefit. 290 people receive this benefit.
In Bloemenbuurt there are 1.755 homes with an average assessed value (WOZ) of €248.000. Of these, around 97% are occupied and 3% unoccupied. Most homes are rental properties. This amounts to 77% rental homes and 23% owner-occupied homes. Of the homes, 23% privately owned, 66% owned by housing associations and 11% owned by other landlords. The most common construction periods in Bloemenbuurt are 1925-1950 (69%) and 1980-1990 (15%).
There are currently 24 homes for sale in Bloemenbuurt. The most recently listed home is Slachthuisstraat 54 by ALFRED+ | Groningen-Amsterdam | Quality Realtors op Funda. Over the past year, 130 homes were sold in Bloemenbuurt. On average, a home was sold within 26 days.
The average asking price for a home for sale in Bloemenbuurt over the past year was €275.665. This is 11% higher than the average assessed value (WOZ) of €248.000. The average asking price per m² of plot is €4.114.
There are 2 homes for rent in Bloemenbuurt. The most recent home is Slachthuisstraat 222, offered by 123Wonen Groningen op Pararius. Over the past year, 11 homes were let in Bloemenbuurt. On average, a listing was let within 46 days.
The average rent for a rental home in Bloemenbuurt over the past year was €2.100 per month. Per m² of plot area that is €21 per month.
In Bloemenbuurt there are 1.562 addresses with a registered energy label. The most common labels are A (40%), C (28%) and B (16%). On average, an address in Bloemenbuurt uses 1.500 kWh of electricity per year. This is 41% below the national average of 2.550 kWh. With an annual consumption of 690 m³ per address, natural gas consumption is 14% below the national average of 800 m³.
Everyone is helpful to each other. We are there for each other and if someone needs something, there are more than enough people willing to help. On the other hand, for families it is so difficult to get a family home with a small garden and own front door. There are far too few terraced houses that consist of just an average single-family home with 2 floors. That makes expanding the family terribly difficult. In terms of education, unfortunately I don't hear many good things within my circle of acquaintances. More attention should be paid to the interaction between teacher and student. And communication with parents could definitely be better. My daughter attends a playgroup and so far I only have good things to say about that, fortunately. Furthermore, one-on-one attention could help students. Moreover, I think that students in secondary schools should learn about the Second World War. It is an important part of our history.
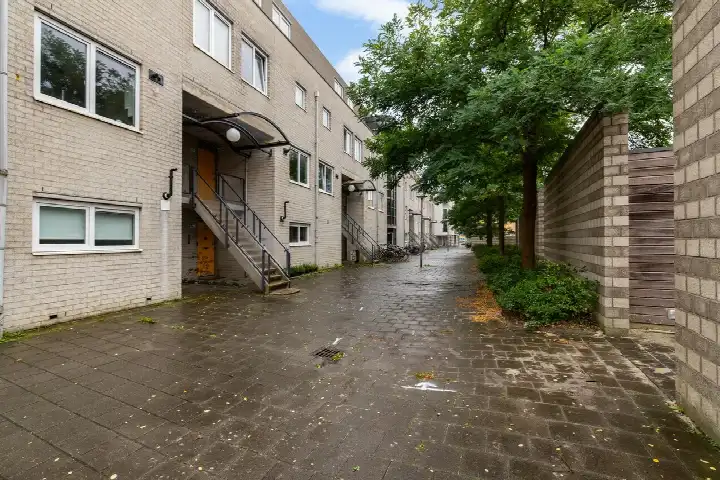
Auto-translated to English by AIThere are beautiful houses and it's cosy here. Social housing and owner-occupied homes are mixed together, which creates a diverse, pleasant neighbourhood.
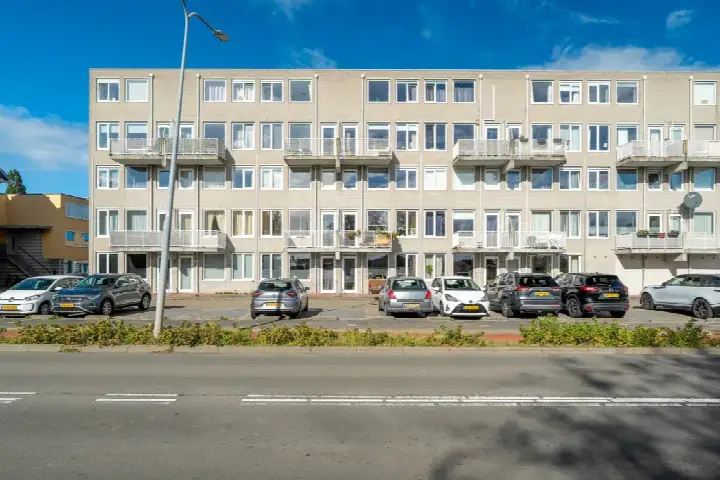
Auto-translated to English by AIThe housing stock is predominantly pre-war — 64% of the homes date from before 1945. In addition, the most common type is flats (58%).
Over the past year a home for sale in Bloemenbuurt was listed for an average of €273,463 (€3,995 per m²). That is 48% below the Dutch national average.
Buurt Bloemenbuurt has 2,765 residents. The largest age group is 25 to 45 years (41%). Notably, 64% of the households are single-person households.
From Bloemenbuurt you can on average reach a supermarket at 0.5 km, a GP at 0.6 km, a railway station at 2.6 km, a primary school at 0.4 km (as the crow flies, source: CBS).
Right now you will find 35 homes for sale and 2 homes for rent in Bloemenbuurt.