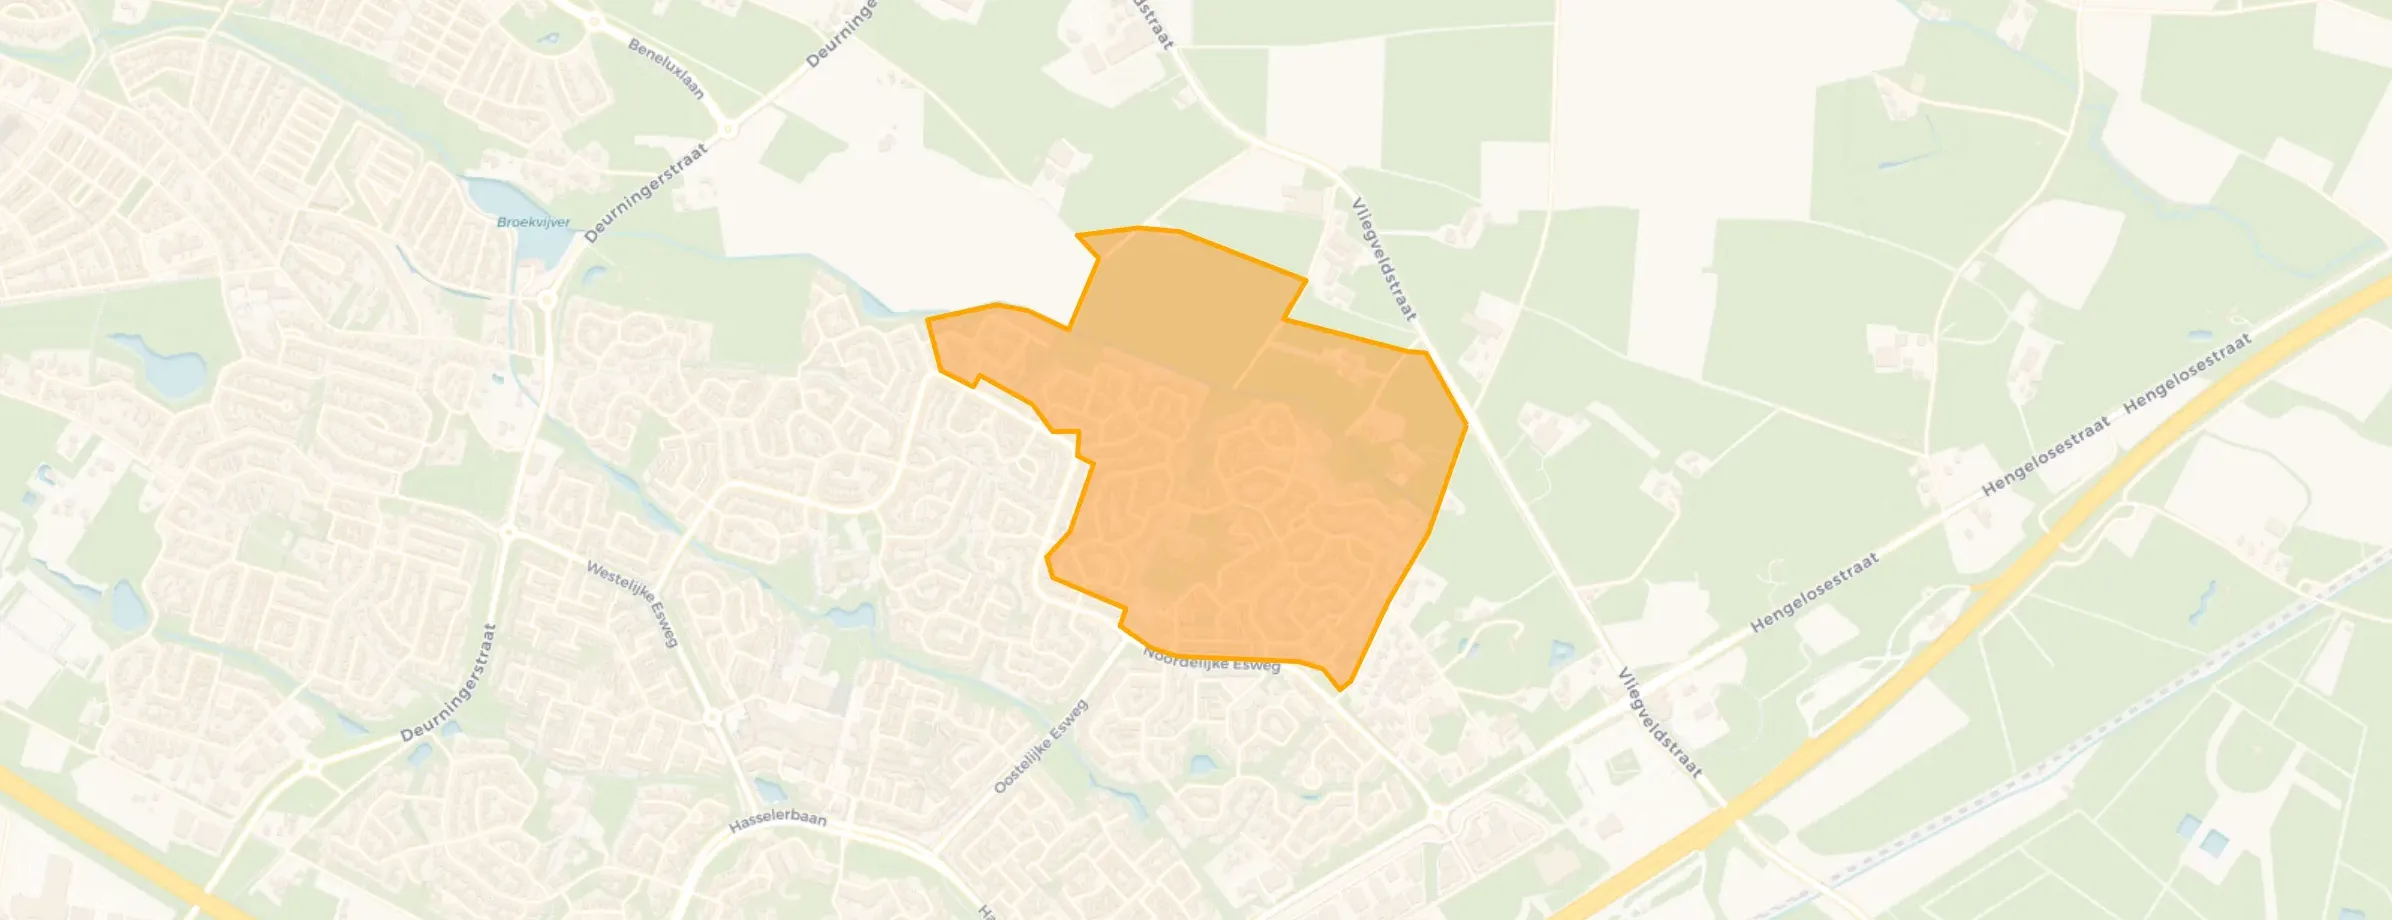
Neighbourhood in Hengelo
Bovenhoek is located in the province of Overijssel, in the municipality of Hengelo, in the district Hasseler Es The neighbourhood has a total area of 54 hectares, of which 54 hectares are land and 0 hectares are water. The neighbourhood is coded as BU01640300. The postcode area is 7558MV-7558ZV.
Two residents rate the neighbourhood as very good with a score of 8.2. They describe it as 'Decent neighbourhood' and 'wonderfully nice place'. Based on a limited number of reviews, no clear trends are visible yet in this neighbourhood.
Bovenhoek has 2.105 residents. Of these, 51,3% are men and 48,7% are women. Most residents are 65 years or older (25,4%). The other age groups are 24,2% for '45 to 65 years', 23,5% for '25 to 45 years', 15,9% for '0 to 15 years' and 10,7% for '15 to 25 years'. Of the residents, 43,2% is unmarried, 47,0% is married, 6,4% is divorced and 3,1% is widowed. 1.755 residents originate from the Netherlands, 105 come from Europe and 235 come from countries outside Europe.
There are 920 households in Bovenhoek. 27,7% of these are single-person households, 37,5% households without children and 34,8% households with children. The average household size is 2,3 persons. The national average is 2,1 persons.
In Bovenhoek there are 1.700 income recipients. The average income per income recipient is €36.500, which is €5.700 (14%) lower than the national average of €42.200. Per resident, the average income is €30.300, which is €4.600 (13%) lower than the national average of €34.900. Most residents of Bovenhoek are educated to an intermediate level. 46,6% have an intermediate education (HAVO, VWO or MBO 2-4), 35,6% have a university or higher professional education (HBO/WO) and 17,8% have a lower education (VMBO or MBO 1).
Of the 2.105 residents, around 68% are in paid employment, which amounts to 1.431 people. This is 4% lower than the national average of 72%. The majority of workers are in salaried employment (91%), while 9% are self-employed. In Bovenhoek, 30% of residents receive a benefit. The largest group is those receiving a state pension (AOW). 480 people receive this benefit.
In Bovenhoek there are 926 homes with an average assessed value (WOZ) of €331.000. Of these, around 98% are occupied and 2% unoccupied. Most homes are owner-occupied. This amounts to 30% rental homes and 70% owner-occupied homes. Of the homes, 69% privately owned, 21% owned by housing associations and 10% owned by other landlords. The most common construction periods in Bovenhoek are 1980-1990 (93%) and 2000-2010 (6%).
There is currently 1 homes for sale in Bovenhoek. The most recently listed home is Fie Carelsenstraat 84 by Prisma Era Makelaars Borne. Over the past year, 34 homes were sold in Bovenhoek. On average, a home was sold within 30 days.
The average asking price for a home for sale in Bovenhoek over the past year was €394.500. This is 19% higher than the average assessed value (WOZ) of €331.000. The average asking price per m² of plot is €2.880.
There is 1 homes for rent in Bovenhoek. The most recent home is Coba Kellingstraat 47, offered by MVGM Wonen op Funda. Over the past year, 4 homes were let in Bovenhoek. On average, a listing was let within 9 days.
The average rent for a rental home in Bovenhoek over the past year was €1.315 per month. Per m² of plot area that is €11 per month.
In Bovenhoek there are 569 addresses with a registered energy label. The most common labels are C (48%), B (25%) and A (19%). On average, an address in Bovenhoek uses 2.630 kWh of electricity per year. This is 3% above the national average of 2.550 kWh. Natural gas consumption, at 870 m³ per year, is 9% above the national average of 800 m³.
It's a relatively quiet neighbourhood in a beautiful environment, nicely on the border of Hengelo and right in the countryside. So far I've only had positive experiences with this neighbourhood. I honestly can't say anything bad about it. The only thing is that the area is a bit far from the city centre. But other than that, I don't mind it too much.
Auto-translated to English by AII came to live here a year and a half ago, due to my husband's home situation, now ground floor and I think we have a lovely little house with a garden and a nice sitting spot. Only the house has double glazing but it's especially cold in winter and very hot in summer. The bedroom has front and back doors and small windows, all single glazed, really not of this time. Opposite our rental house are nice owner-occupied homes, it all looks cosy, and of course we are happy with this place, it's neat and clean. Although the housing association also places antisocial people among them, which is certainly not pleasant for the people with their own homes, because there are those who, for example, don't maintain the garden. Like a neat Turkish couple who came to live here and then left their daughter in the house for 3 months, went to Turkey, and the garden became a big pile of weeds because that's not for the daughter. Likewise, in the same row, someone I think from social services, who also lets everything go and does nothing to the garden, that doesn't look nice, a shame for such a neighbourhood. I'll leave it at that.
Auto-translated to English by AIThe housing stock is mainly post-war — 95% was built between 1945 and 1990. In addition, the most common type is terraced houses (47%).
Over the past year a home for sale in Bovenhoek was listed for an average of €394,500 (€3,134 per m²).
Buurt Bovenhoek has 2,105 residents. Many families: 35% of the households have children.
From Bovenhoek you can on average reach a supermarket at 0.6 km, a GP at 1.3 km, a railway station at 3.8 km, a primary school at 0.9 km (as the crow flies, source: CBS).







