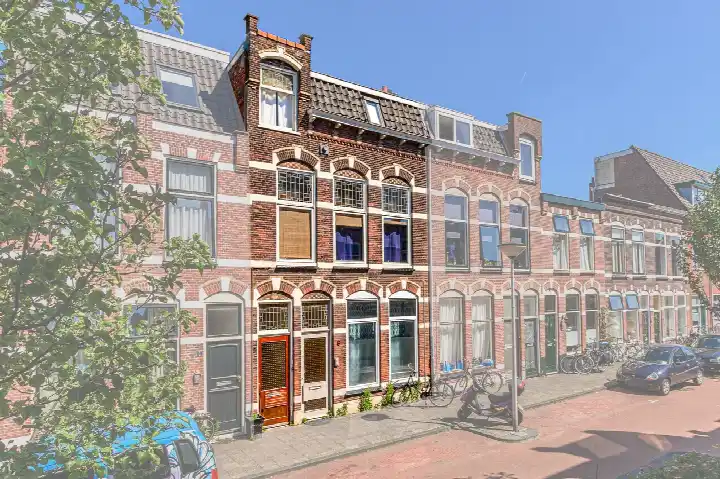
Neighbourhood in Leiden
De Kooi is located in the province of Zuid-Holland, in the municipality of Leiden, in the district Leiden-Noord The neighbourhood has a total area of 71 hectares, of which 65 hectares are land and 5 hectares are water. The neighbourhood is coded as BU05460302. The postcode area is 2315AA-2315ZC.
Two residents rate the neighbourhood as more than satisfactory with a score of 6.6. They describe it as 'Unfortunately I live here!' and 'Normal'. Based on a limited number of reviews, no clear trends are visible yet in this neighbourhood.
De Kooi has 6.185 residents. Of these, 49,6% are men and 50,5% are women. Most residents are 25 to 45 years (36,8%). The other age groups are 22,2% for '45 to 65 years', 14,6% for '65 years or older', 13,8% for '0 to 15 years' and 12,9% for '15 to 25 years'. Of the residents, 60,6% is unmarried, 27,5% is married, 8,2% is divorced and 3,8% is widowed. 3.460 residents originate from the Netherlands, 625 come from Europe and 2.105 come from countries outside Europe.
There are 3.310 households in De Kooi. 49,8% of these are single-person households, 24,9% households without children and 25,2% households with children. The average household size is 1,9 persons. The national average is 2,1 persons.
In De Kooi there are 5.200 income recipients. The average income per income recipient is €35.200, which is €7.000 (17%) lower than the national average of €42.200. Per resident, the average income is €29.500, which is €5.400 (15%) lower than the national average of €34.900. Most residents of De Kooi are educated to an intermediate level. 35,7% have an intermediate education (HAVO, VWO or MBO 2-4), 33,3% have a lower education (VMBO or MBO 1) and 31,1% have a university or higher professional education (HBO/WO).
Of the 6.185 residents, around 69% are in paid employment, which amounts to 4.268 people. This is 3% lower than the national average of 72%. The majority of workers are in salaried employment (85%), while 15% are self-employed. In De Kooi, 25% of residents receive a benefit. The largest group is those receiving a state pension (AOW). 780 people receive this benefit.
In De Kooi there are 3.117 homes with an average assessed value (WOZ) of €336.000. Of these, around 96% are occupied and 4% unoccupied. Most homes are rental properties. This amounts to 77% rental homes and 23% owner-occupied homes. Of the homes, 23% privately owned, 63% owned by housing associations and 14% owned by other landlords. The most common construction periods in De Kooi are 1925-1950 (26%) and 1950-1970 (18%).
There are currently 21 homes for sale in De Kooi. The most recently listed home is Bloemstraat 1 by REMAX Makelaarsgilde op Funda. Over the past year, 276 homes were sold in De Kooi. On average, a home was sold within 47 days.
The average asking price for a home for sale in De Kooi over the past year was €391.978. This is 17% higher than the average assessed value (WOZ) of €336.000. The average asking price per m² of plot is €4.505.
There are 4 homes for rent in De Kooi. The most recent home is Paramaribohof 12, offered by www.hureninhollandrijnland.nl. Over the past year, 57 homes were let in De Kooi. On average, a listing was let within 17 days.
The average rent for a rental home in De Kooi over the past year was €1.836 per month. Per m² of plot area that is €18 per month.
In De Kooi there are 2.764 addresses with a registered energy label. The most common labels are A (31%), C (23%) and B (14%). On average, an address in De Kooi uses 1.920 kWh of electricity per year. This is 25% below the national average of 2.550 kWh. With an annual consumption of 630 m³ per address, natural gas consumption is 21% below the national average of 800 m³.
Too little police control is causing the neighbourhood to deteriorate rapidly, drug dealers under the bridge, drug users around and even in bad weather in the flat, the housing association doesn't want to understand! Also many foreign residents in the flat and in the neighbourhood. The mayor and aldermen do nothing about it either. Leiden Noord is in decline! Bins disappear and it's normal for people to throw everything on the ground. Cleaning up dog poop, forget it, you can hardly pick it up anymore because the grass is much too high, so-called care for insects, in my opinion just a cheap cutback. The flat is also getting dirtier. They keep raising the costs but the escape routes haven't been cleaned for almost 5 years. Positive is that there are shops at Kooiplein and in the building there is the library and schools, secondary education at Sumatrastraat. Too bad that not only the government sees the car as a cash cow but the municipality now too.
Auto-translated to English by AIWell, it's actually a normal neighbourhood like you usually know. However, you do have a lot of drunk people sometimes in the park at the weekend, and also children who get up to a lot of mischief. For the rest, it is a pleasant neighbourhood, but unfortunately we don't have as nice contact with our neighbours as before. My neighbourhood has changed a lot compared to my childhood since we had an old neighbour lady who was very close to us. Felt like family..
Auto-translated to English by AIThe housing stock is predominantly pre-war — 64% of the homes date from before 1945. In addition, the most common type is flats (68%).
Over the past year a home for sale in De Kooi was listed for an average of €387,721 (€5,848 per m²). That is 27% below the Dutch national average.
A rental home in De Kooi cost an average of €2,111 per month (€24 per m²).
Buurt De Kooi has 6,185 residents. The largest age group is 25 to 45 years (37%). Notably, 50% of the households are single-person households.
A considerable share of the supply in De Kooi is less efficient: 29% has an E, F or G label. The average natural gas consumption per household is 630 m³ per year.
From De Kooi you can on average reach a supermarket at 0.7 km, a GP at 0.8 km, a railway station at 2.8 km, a primary school at 0.6 km (as the crow flies, source: CBS).
Right now you will find 24 homes for sale and 5 homes for rent in De Kooi.