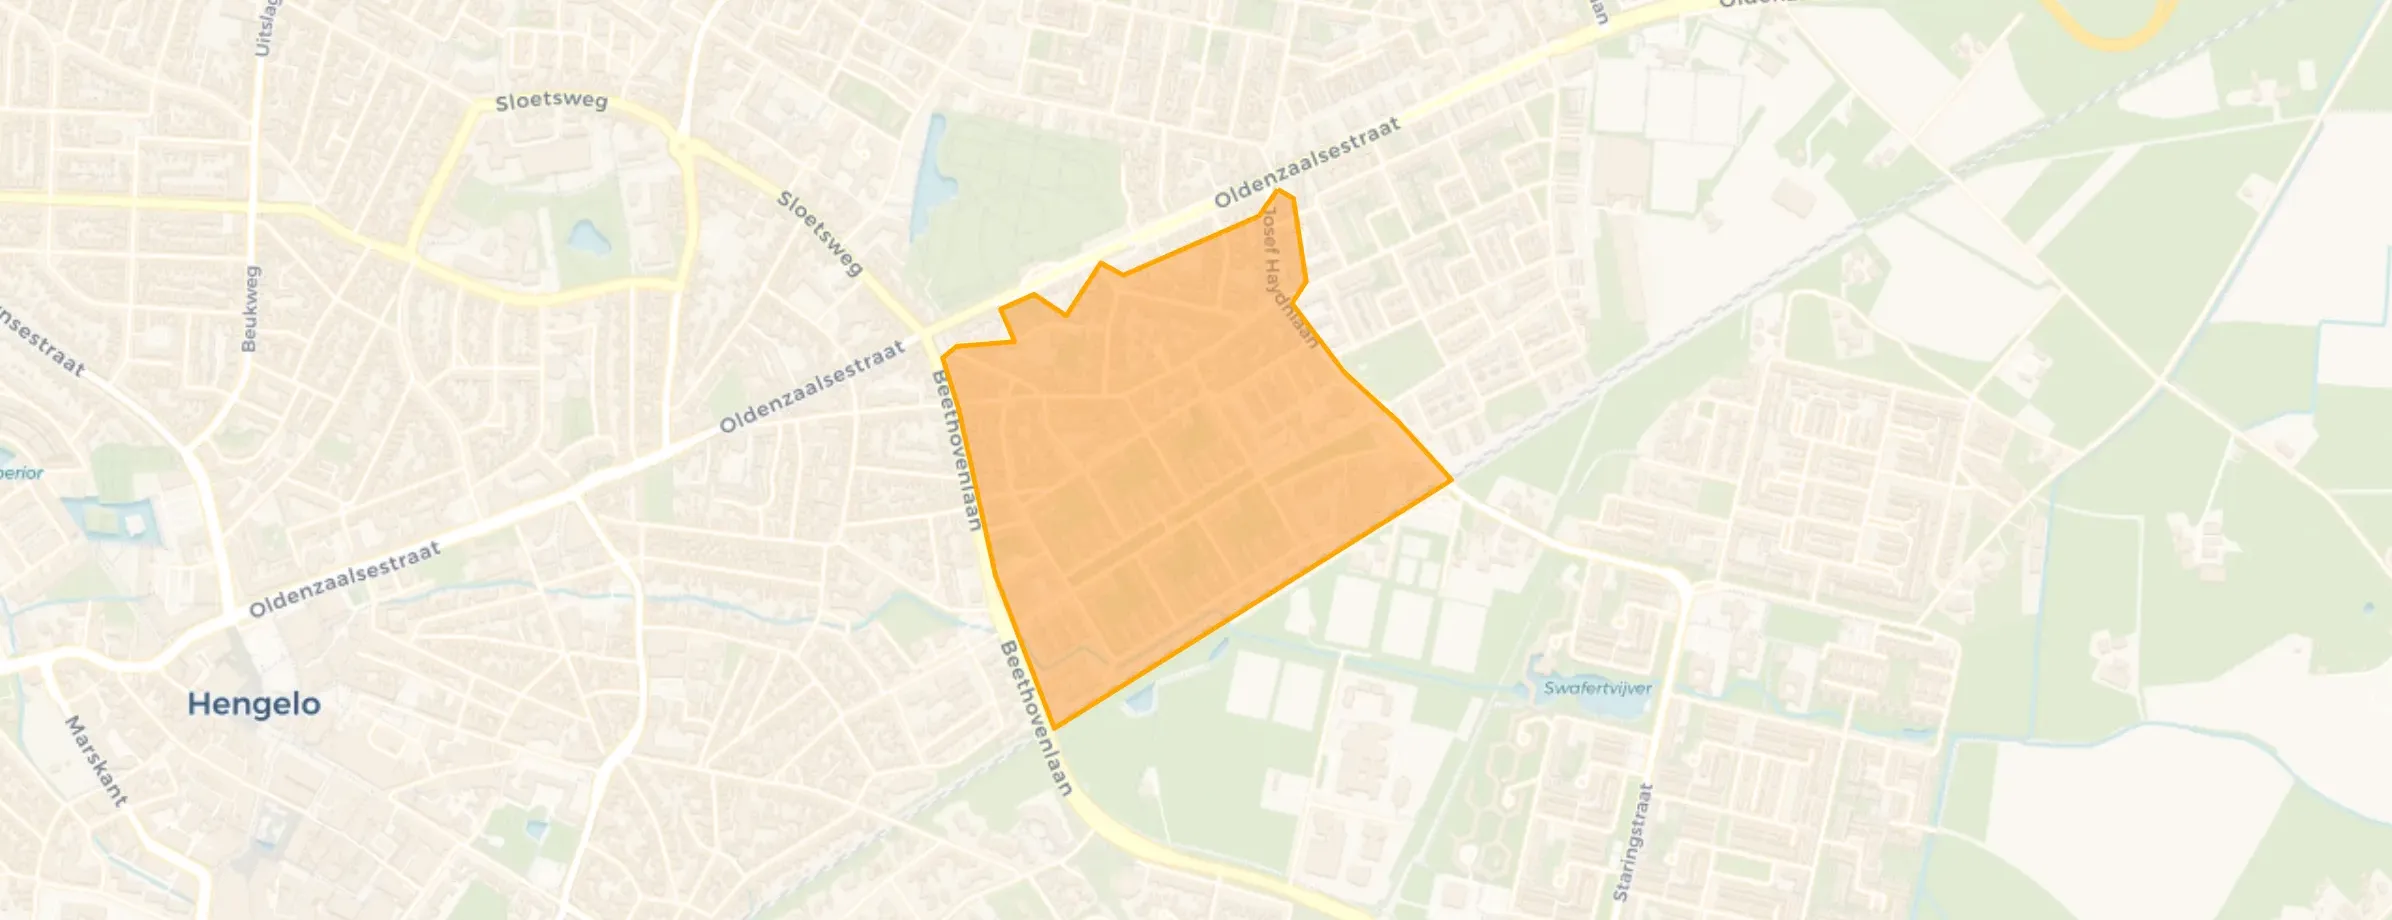
Neighbourhood in Hengelo
De Noork is located in the province of Overijssel, in the municipality of Hengelo, in the district Noord The neighbourhood has a total area of 35 hectares, of which 35 hectares are land and 0 hectares are water. The neighbourhood is coded as BU01640202. The postcode area is 7557BC-7557SX.
Three residents rate the neighbourhood as more than satisfactory with a score of 6.5. They describe it as 'decent neighbourhood', 'Safe but boring' and 'Plenty within reach and calming'. Aspects such as education, safety, accessibility are rated well in this neighbourhood, while housing and greenery score less well.
De Noork has 2.135 residents. Of these, 52,2% are men and 47,8% are women. Most residents are 25 to 45 years (34,4%). The other age groups are 24,8% for '45 to 65 years', 15,0% for '15 to 25 years', 12,9% for '0 to 15 years' and 12,6% for '65 years or older'. Of the residents, 59,0% is unmarried, 29,3% is married, 7,7% is divorced and 4,0% is widowed. 1.360 residents originate from the Netherlands, 150 come from Europe and 625 come from countries outside Europe.
There are 1.145 households in De Noork. 51,5% of these are single-person households, 21,4% households without children and 27,1% households with children. The average household size is 1,8 persons. The national average is 2,1 persons.
In De Noork there are 1.800 income recipients. The average income per income recipient is €30.300, which is €11.900 (28%) lower than the national average of €42.200. Per resident, the average income is €25.700, which is €9.200 (26%) lower than the national average of €34.900. Most residents of De Noork are educated to an intermediate level. 50,0% have an intermediate education (HAVO, VWO or MBO 2-4), 30,5% have a lower education (VMBO or MBO 1) and 19,5% have a university or higher professional education (HBO/WO).
Of the 2.135 residents, around 68% are in paid employment, which amounts to 1.452 people. This is 4% lower than the national average of 72%. The majority of workers are in salaried employment (90%), while 10% are self-employed. In De Noork, 28% of residents receive a benefit. The largest group is those receiving a state pension (AOW). 250 people receive this benefit.
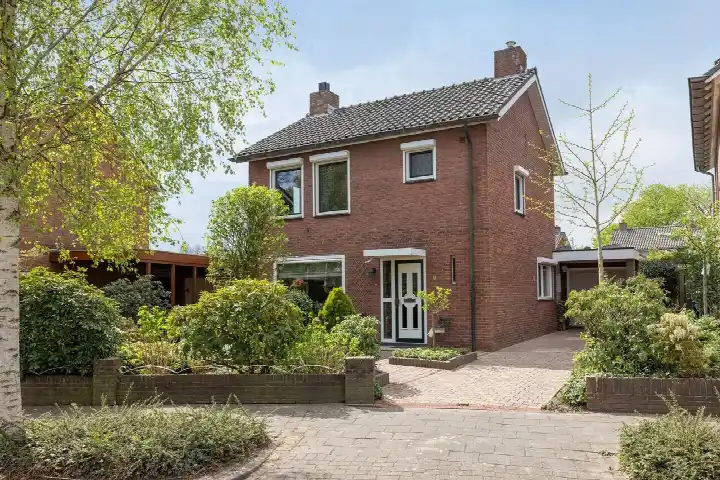
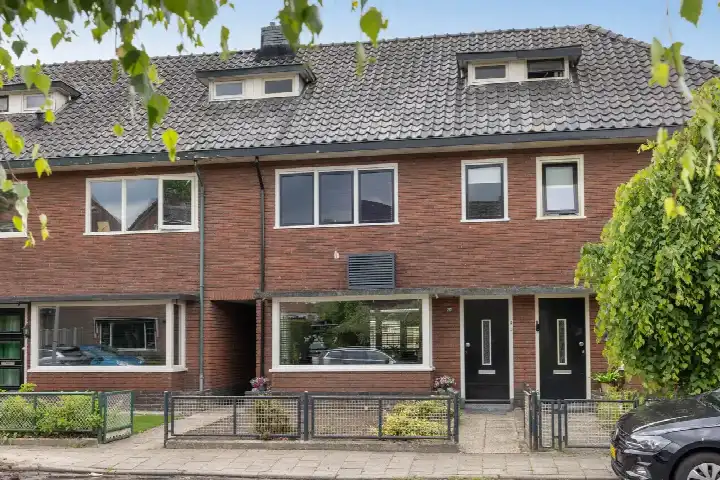
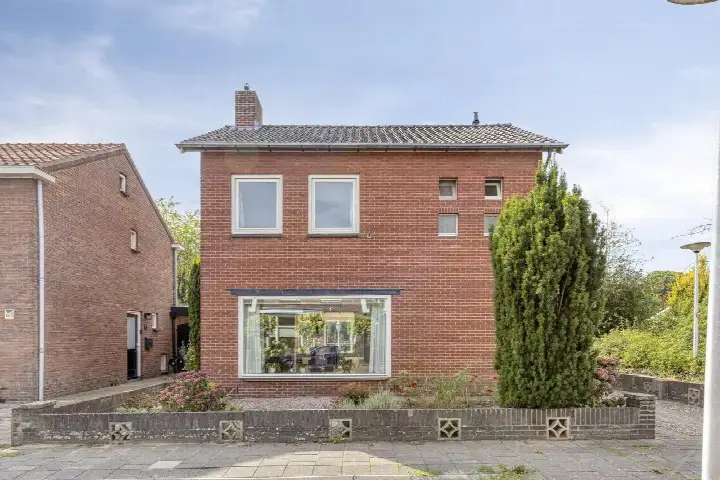
In De Noork there are 1.157 homes with an average assessed value (WOZ) of €227.000. Of these, around 97% are occupied and 3% unoccupied. Most homes are rental properties. This amounts to 64% rental homes and 36% owner-occupied homes. Of the homes, 36% privately owned, 55% owned by housing associations and 9% owned by other landlords. The most common construction periods in De Noork are 1950-1970 (71%) and 1925-1950 (15%).
There are currently 8 homes for sale in De Noork. The most recently listed home is Rossinistraat 6 by Eerste Keus Makelaars op Funda. Over the past year, 80 homes were sold in De Noork. On average, a home was sold within 41 days.
The average asking price for a home for sale in De Noork over the past year was €274.050. This is 21% higher than the average assessed value (WOZ) of €227.000. The average asking price per m² of plot is €2.825.
There are 2 homes for rent in De Noork. The most recent home is Brahmsstraat 59, offered by www.woninghuren.nl. Over the past year, 9 homes were let in De Noork. On average, a listing was let within 11 days.
The average rent for a rental home in De Noork over the past year was €750 per month. Per m² of plot area that is €10 per month.
In De Noork there are 654 addresses with a registered energy label. The most common labels are C (23%), A (21%) and D (16%). On average, an address in De Noork uses 2.160 kWh of electricity per year. This is 15% below the national average of 2.550 kWh. With an annual consumption of 790 m³ per address, natural gas consumption is 1% below the national average of 800 m³.
normal neighbourhood but very dependent on exactly where you are. the closer to the railway, the worse it gets. waste nuisance around the Aldi is excessive and really needs attention. speeding on the Mozartlaan, Paganinistraat, Oude Postweg, Jozef Haydnlaan is also significant. speeding is too easy and it's unclear what the maximum speed is. small gardens and green strips also need attention. where the streets are swept regularly (plus point), the gardens are maintained once a year. I feel safe enough, although it's not always great, loud foreign voices, groups of men and overdue maintenance on sometimes entire blocks.
Auto-translated to English by AIPeople keep to themselves, but aren't distant. They can still have a chat here and there. There are many dog owners in the neighbourhood whose dogs play together a lot, which sometimes creates a cosy atmosphere. A downside is that there's a lot of fireworks set off in the evenings/nights. Also, a lot of rubbish is dumped by the plastic/paper containers, or entire households' furniture is thrown away.
Auto-translated to English by AICalming Accessible Close to the city Shops nearby Pleasant people
Auto-translated to English by AIThe housing stock is mainly post-war — 82% was built between 1945 and 1990. In addition, the most common type is flats (48%).
Over the past year a home for sale in De Noork was listed for an average of €270,821 (€2,996 per m²). That is 49% below the Dutch national average.
Residents give De Noork a 6.5 out of 10 based on 3 reviews. Education stands out with a 8.0; nature and greenery lags behind with a 5.0.
Buurt De Noork has 2,135 residents. The largest age group is 25 to 45 years (34%). Notably, 52% of the households are single-person households.
A considerable share of the supply in De Noork is less efficient: 43% has an E, F or G label. The average natural gas consumption per household is 790 m³ per year.
From De Noork you can on average reach a supermarket at 0.4 km, a GP at 0.5 km, a railway station at 0.5 km, a primary school at 0.5 km (as the crow flies, source: CBS).
Right now you will find 8 homes for sale and 3 homes for rent in De Noork.