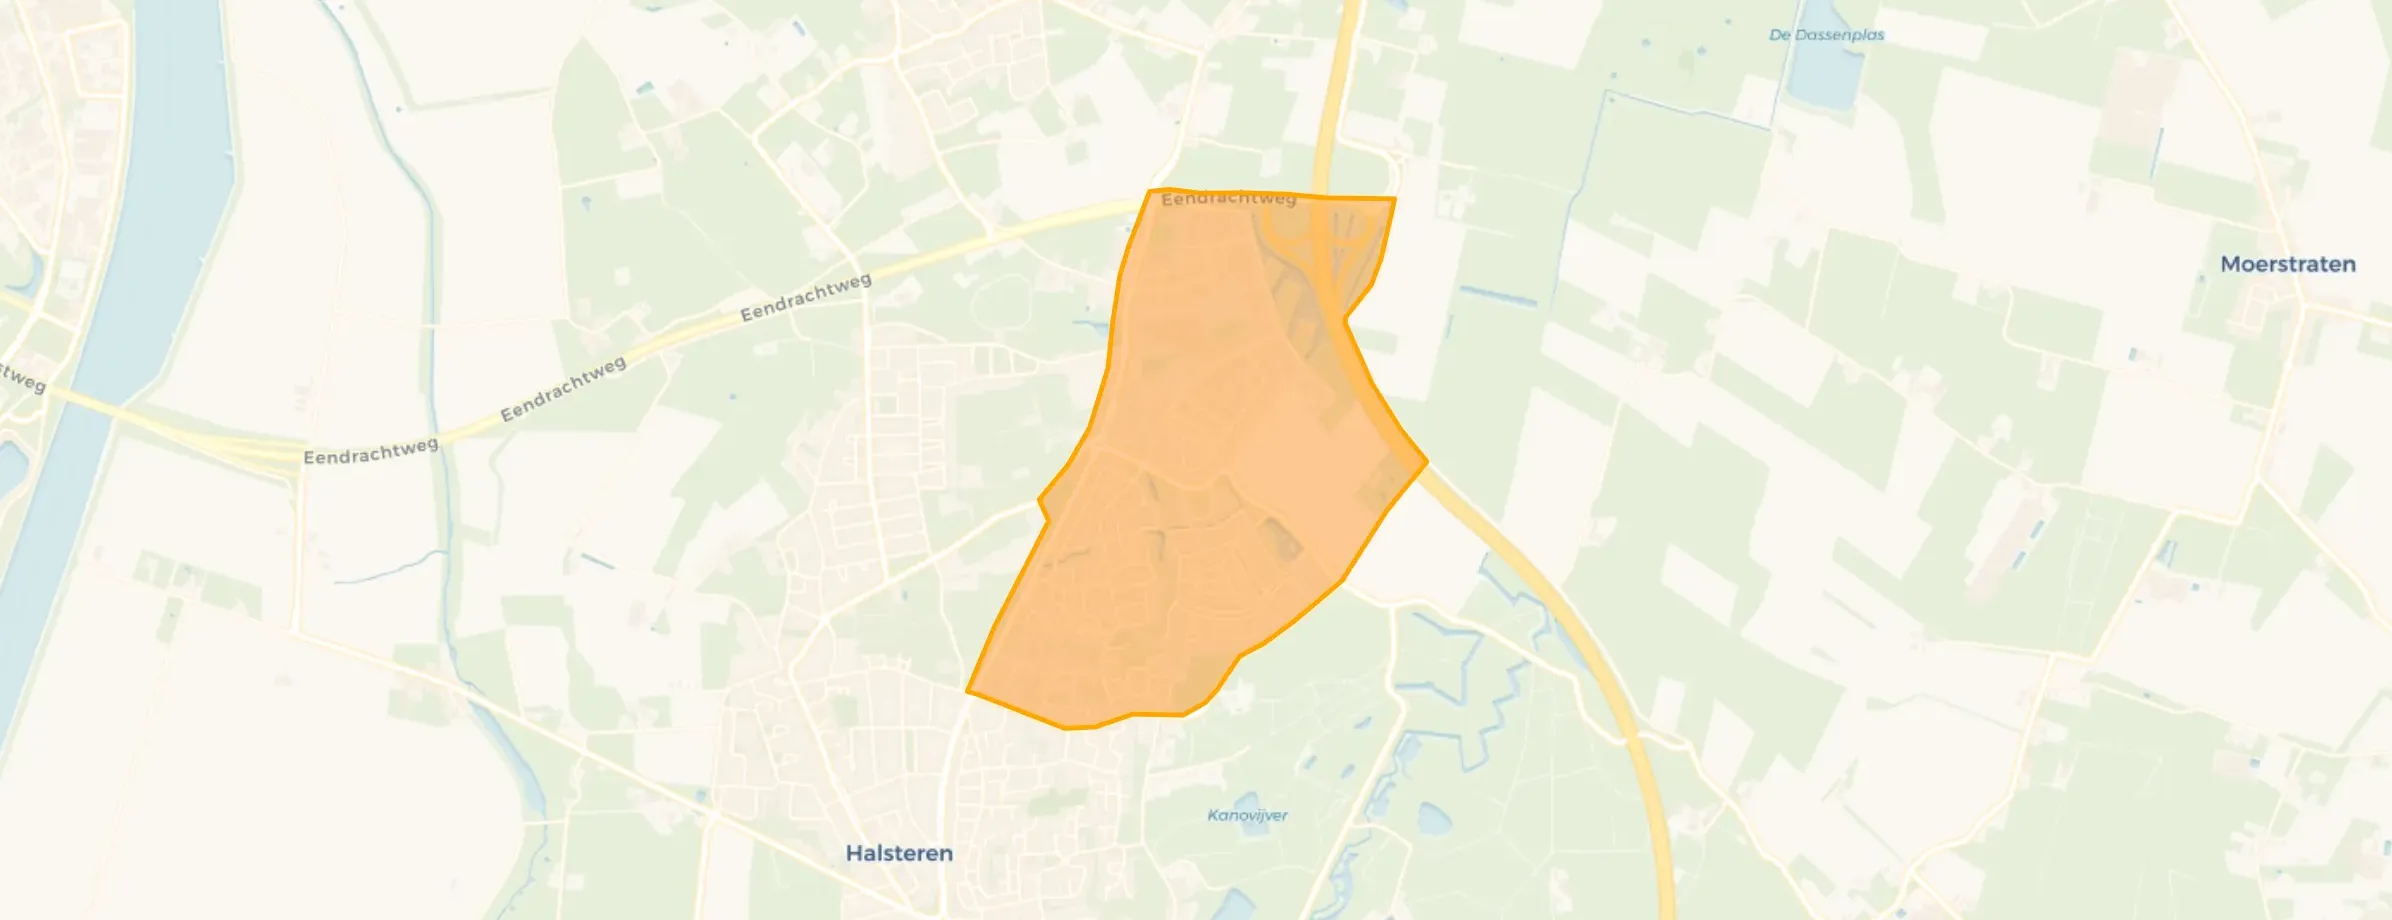
De Schans en Oude Molen is located in the province of Noord-Brabant, in the municipality of Bergen op Zoom, in the district Halsteren. The neighbourhood has a total area of 177 hectares, of which 174 hectares are land and 4 hectares are water. The neighbourhood is coded as BU07480405. The postcode area is 4661PL-4661ZN.
Three residents rate the neighbourhood as very good with a score of 8.3. They describe it as 'beautiful, green living environment', 'Not cosy. The area is, though.' and 'Nice child-friendly neighbourhood'. Residents experience big differences in this neighbourhood: greenery, housing, safety receive high ratings, while amenities and community are mentioned as weak points.
De Schans en Oude Molen has 3.135 residents. Of these, 50,1% are men and 49,9% are women. Most residents are 45 to 65 years (31,7%). The other age groups are 19,5% for '25 to 45 years', 18,2% for '65 years or older', 17,4% for '0 to 15 years' and 13,2% for '15 to 25 years'. Of the residents, 43,2% is unmarried, 47,5% is married, 5,7% is divorced and 3,7% is widowed. 2.715 residents originate from the Netherlands, 270 come from Europe and 150 come from countries outside Europe.
There are 1.195 households in De Schans en Oude Molen. 19,2% of these are single-person households, 33,5% households without children and 47,3% households with children. The average household size is 2,6 persons. The national average is 2,1 persons.
In De Schans en Oude Molen there are 2.500 income recipients. The average income per income recipient is €46.000, which is €3.800 (9%) higher than the national average of €42.200. Per resident, the average income is €40.100, which is €5.200 (15%) higher than the national average of €34.900. Most residents of De Schans en Oude Molen are educated to an intermediate level. 44,7% have an intermediate education (HAVO, VWO or MBO 2-4), 33,2% have a university or higher professional education (HBO/WO) and 22,1% have a lower education (VMBO or MBO 1).
Of the 3.135 residents, around 78% are in paid employment, which amounts to 2.445 people. This is 6% higher than the national average of 72%. The majority of workers are in salaried employment (85%), while 15% are self-employed. In De Schans en Oude Molen, 22% of residents receive a benefit. The largest group is those receiving a state pension (AOW). 520 people receive this benefit.
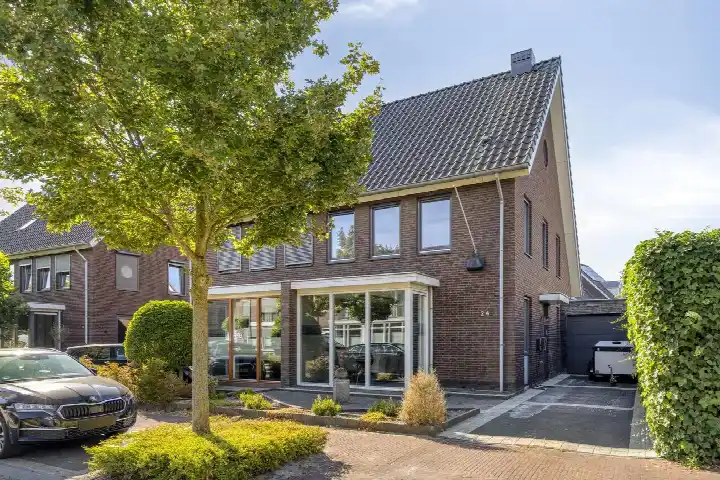
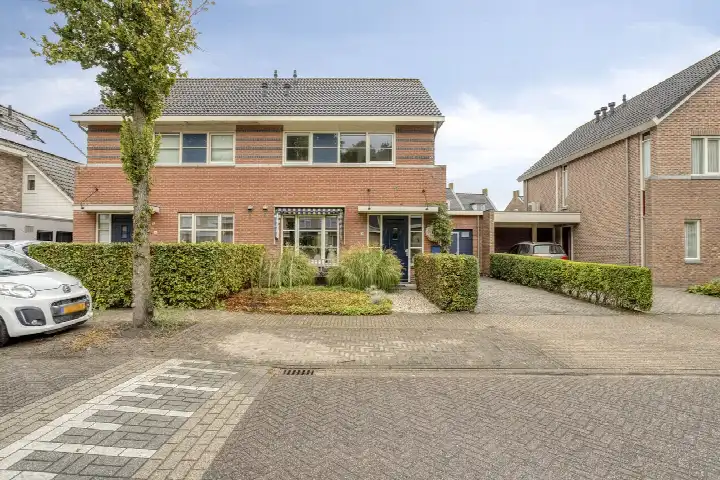
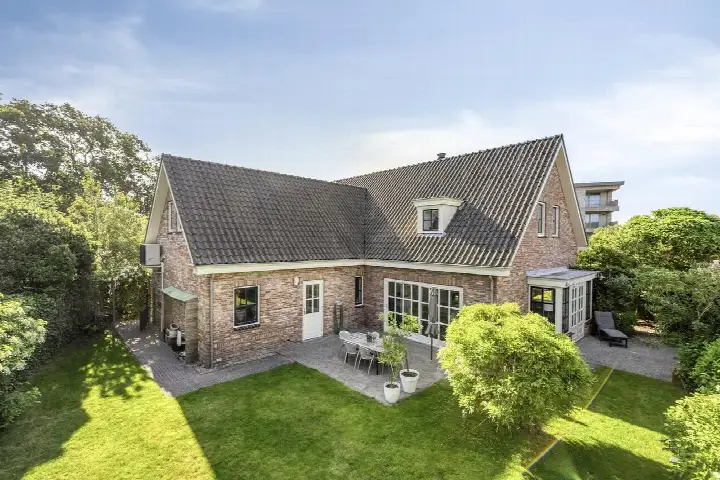
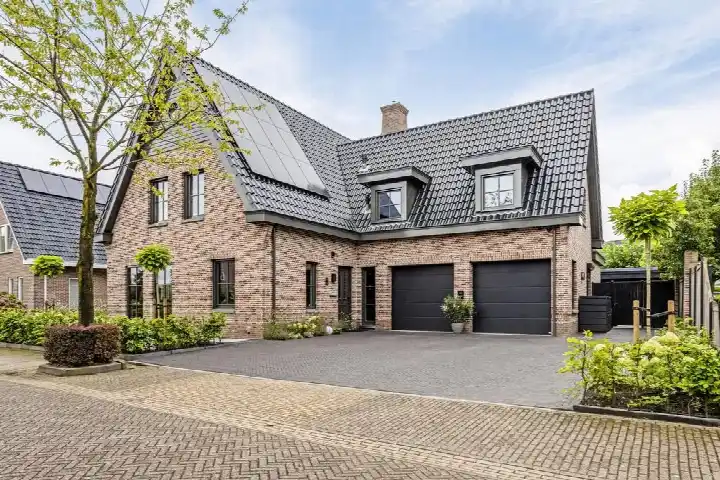
In De Schans en Oude Molen there are 1.164 homes with an average assessed value (WOZ) of €474.000. Of these, around 99% are occupied and 1% unoccupied. Most homes are owner-occupied. This amounts to 19% rental homes and 81% owner-occupied homes. Of the homes, 81% privately owned, 18% owned by housing associations and 1% owned by other landlords. The most common construction periods in De Schans en Oude Molen are 2000-2010 (38%) and 1990-2000 (32%).
There are currently 7 homes for sale in De Schans en Oude Molen. The most recently listed home is Magnolia 4 by Makelaar1 Internetmakelaar - Zelf uw huis verkopen. Over the past year, 28 homes were sold in De Schans en Oude Molen. On average, a home was sold within 37 days.
The average asking price for a home for sale in De Schans en Oude Molen over the past year was €635.072. This is 34% higher than the average assessed value (WOZ) of €474.000. The average asking price per m² of floor area is €3.567.
There are currently no homes for rent in De Schans en Oude Molen. No homes were let in De Schans en Oude Molen over the past year.
No recent rental data available for De Schans en Oude Molen.
In De Schans en Oude Molen there are 790 addresses with a registered energy label. The most common labels are A (61%), B (15%) and A+++ (10%). On average, an address in De Schans en Oude Molen uses 3.380 kWh of electricity per year. This is 33% above the national average of 2.550 kWh. Natural gas consumption, at 830 m³ per year, is 4% above the national average of 800 m³.
Safe, green, easily accessible, spacious layout.
Auto-translated to English by AIToo bad we don't have nice neighbours. That sometimes makes me sad. A few years ago they hung our dog. And a friend was spat on and beaten with a dog leash until she bled. Then I think why. Why do they do that. I have no idea. Stadlander also says the light is not on you. But I'm still bothered by it.
Auto-translated to English by AINice neighbourhood, many schools nearby, never been burgled, never experienced nuisance, child-friendly, friendly people, plenty of supermarkets in the area. Nice football club, little trouble, good hygiene. Often cleaned by the municipality. Nice forest where you can play with your children and take walks.
Auto-translated to English by AIThe housing stock is relatively young — 85% dates from after 1990.
Over the past year a home for sale in De Schans en Oude Molen was listed for an average of €635,072 (€3,567 per m²). That is 23% above the Dutch national average.
Residents give De Schans en Oude Molen a 8.3 out of 10 based on 3 reviews. Especially housing (9.3) scores well; community (5.7) receives the lowest rating.
Buurt De Schans en Oude Molen has 3,135 residents. The largest age group is 45 to 65 years (32%). Many families: 47% of the households have children.
The housing supply in De Schans en Oude Molen is remarkably efficient: 86% has an A, A+ or B label. The average natural gas consumption per household is 830 m³ per year.
From De Schans en Oude Molen you can on average reach a supermarket at 1.5 km, a GP at 0.8 km, a railway station at 5.4 km, a primary school at 0.7 km (as the crow flies, source: CBS).