Neighbourhood in Roosendaal
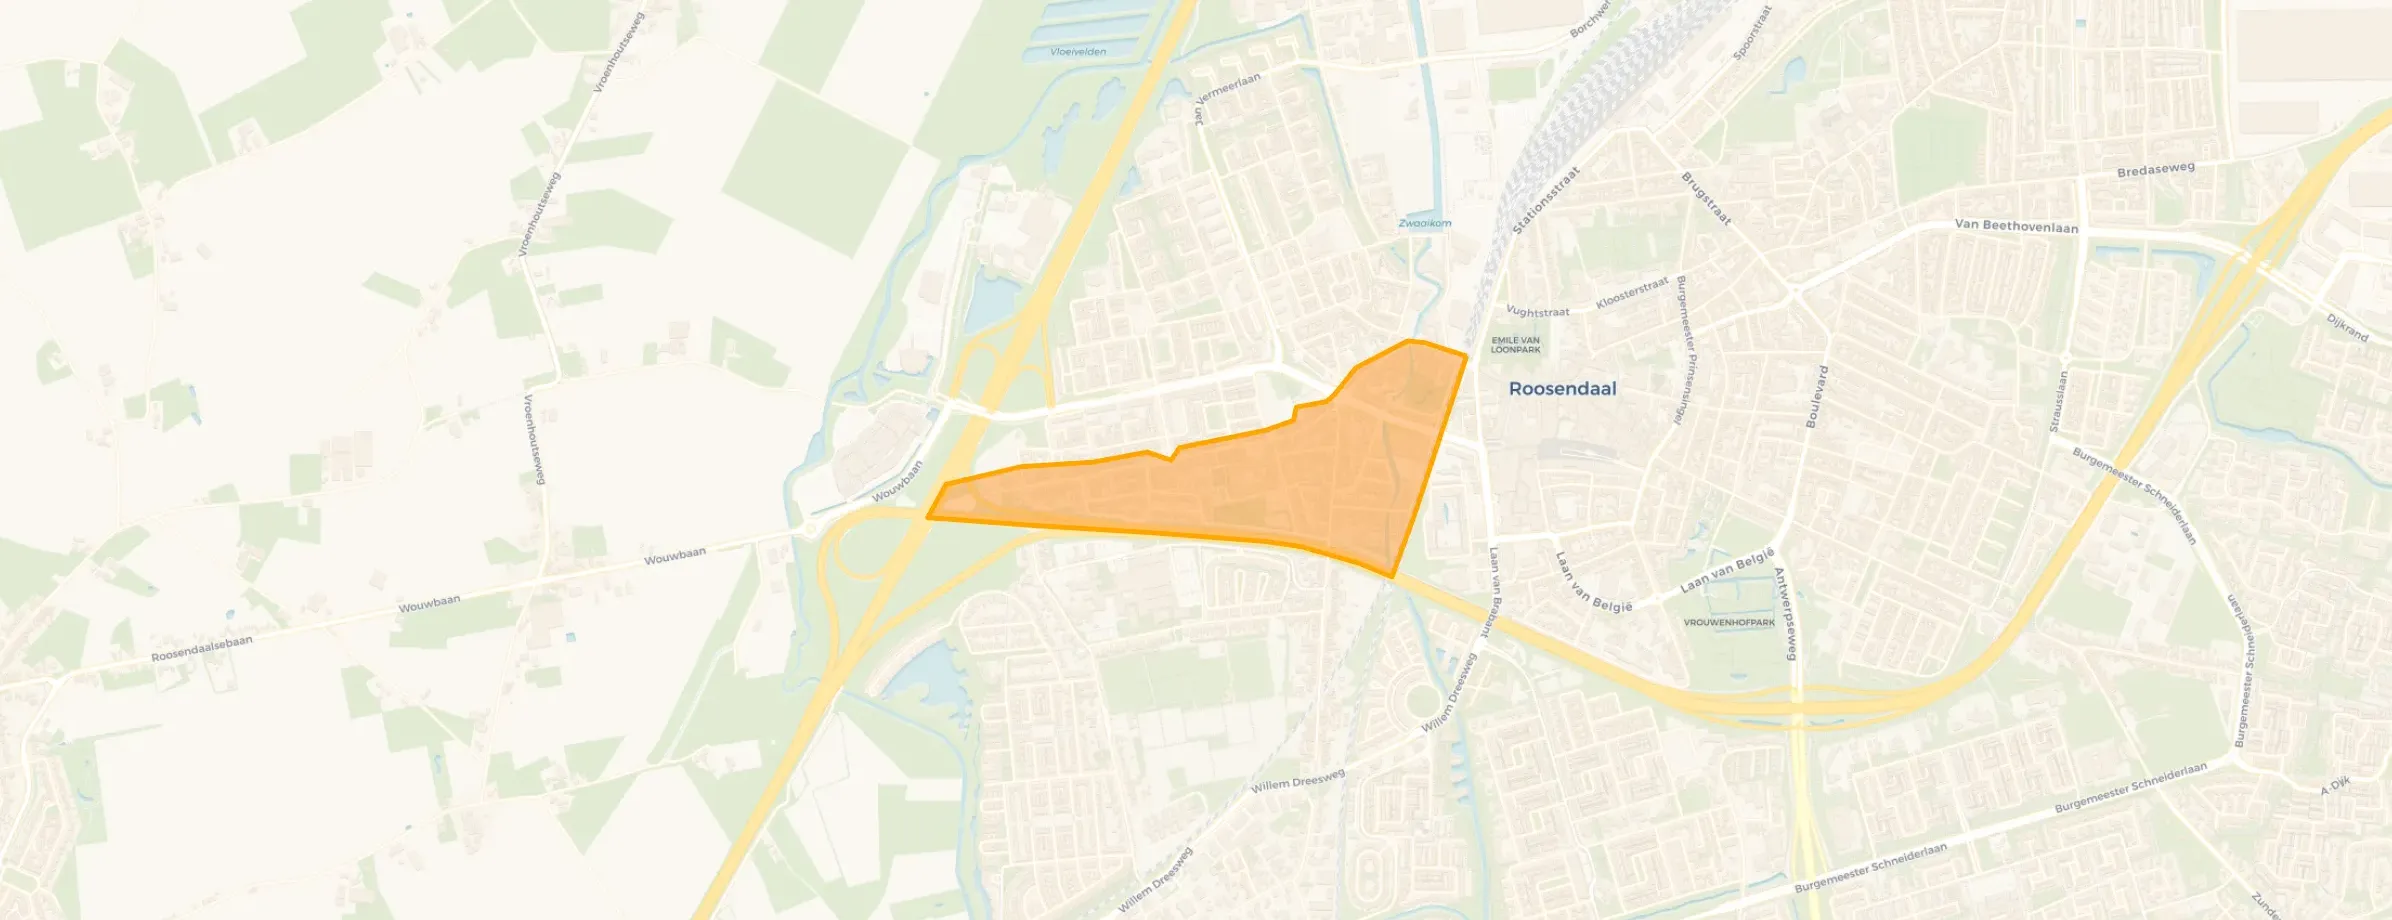
Heerma van Vossstraat-Molenbeek is located in the province of Noord-Brabant, in the municipality of Roosendaal, in the district West The neighbourhood has a total area of 40 hectares, of which 40 hectares are land and 0 hectares are water. The neighbourhood is coded as BU16740300. The postcode area is 4703AA-4703GH.
Two residents rate the neighbourhood as good with a score of 7.7. They describe it as 'Cosy neighbourhood' and 'Pushing against an elephant'. Based on a limited number of reviews, no clear trends are visible yet in this neighbourhood.
Heerma van Vossstraat-Molenbeek has 1.820 residents. Of these, 48,1% are men and 52,2% are women. Most residents are 65 years or older (30,8%). The other age groups are 26,4% for '25 to 45 years', 22,8% for '45 to 65 years', 11,5% for '0 to 15 years' and 8,8% for '15 to 25 years'. Of the residents, 48,4% is unmarried, 30,5% is married, 10,2% is divorced and 11,0% is widowed. 1.515 residents originate from the Netherlands, 180 come from Europe and 125 come from countries outside Europe.
There are 880 households in Heerma van Vossstraat-Molenbeek. 51,1% of these are single-person households, 26,7% households without children and 22,2% households with children. The average household size is 1,8 persons.
In Heerma van Vossstraat-Molenbeek there are 1.400 income recipients. The average income per income recipient is €34.500, which is €1.300 (4%) lower than the national average of €35.800. Per resident, the average income is €30.000, which is €800 (3%) higher than the national average of €29.200. Most residents of Heerma van Vossstraat-Molenbeek are educated to an intermediate level. 52,0% have an intermediate education (HAVO, VWO or MBO 2-4), 27,2% have a university or higher professional education (HBO/WO) and 20,8% have a lower education (VMBO or MBO 1).
Of the 1.820 residents, around 70% are in paid employment, which amounts to 1.274 people. This is 5% higher than the national average of 65%. The majority of workers are in salaried employment (86%), while 14% are self-employed. In Heerma van Vossstraat-Molenbeek, 35% of residents receive a benefit. The largest group is those receiving a state pension (AOW). 510 people receive this benefit.
In Heerma van Vossstraat-Molenbeek there are 1.028 homes with an average assessed value (WOZ) of €247.000. Of these, around 89% are occupied and 11% unoccupied. In Heerma van Vossstraat-Molenbeek there are roughly as many rental as owner-occupied homes. This amounts to 46% rental homes and 54% owner-occupied homes. Of the homes, 54% privately owned, 7% owned by housing associations and 39% owned by other landlords. The most common construction periods in Heerma van Vossstraat-Molenbeek are 1950-1970 (28%) and 1925-1950 (18%).
There are currently 11 homes for sale in Heerma van Vossstraat-Molenbeek. The most recently listed home is Engelselaan 1 by C&R Makelaars. Over the past year, 35 homes were sold in Heerma van Vossstraat-Molenbeek. On average, a home was sold within 62 days.
The average asking price for a home for sale in Heerma van Vossstraat-Molenbeek over the past year was €329.357. This is 33% higher than the average assessed value (WOZ) of €247.000. The average asking price per m² of plot is €2.495.
There are currently no homes for rent in Heerma van Vossstraat-Molenbeek. The most recent home is Burgemeester Freijterslaan 130A, offered by www.klikvoorwonen.nl. Over the past year, 13 homes were let in Heerma van Vossstraat-Molenbeek. On average, a listing was let within 21 days.
No recent rental data available for Heerma van Vossstraat-Molenbeek.
In Heerma van Vossstraat-Molenbeek there are 1.001 addresses with a registered energy label. The most common labels are A (24%), G (23%) and C (16%). On average, an address in Heerma van Vossstraat-Molenbeek uses 2.490 kWh of electricity per year. This is 11% below the national average of 2.810 kWh. With an annual consumption of 970 m³ per address, natural gas consumption is 24% below the national average of 1.280 m³.
Never had any problems, school is nearby and they drive calmly
Auto-translated to English by AIOur neighbourhood has been a bit abandoned by the municipality. Together with the neighbourhood, we often send messages to the municipality (via the BuitenBeter app) about decay, litter, illegal dumping, poor maintenance of the neighbourhood/living environment, poor maintenance of green spaces, and unsafe conditions around the playground. Illegal parking during busy times at the playground, blocking emergency services. Next to the playground is a street where cars coming to the playground can easily park. Heavy traffic (supply trucks) through our narrow street. We sometimes hold our breath here with all those happy running children heading to the playground. Behind our street is a dead-end street where we (residents) come out. This 'back street' is often 'forgotten' when it comes to sweeping, weeding, and pruning. We always have to complain to the municipality about this. It would be nice if this were just included in green/street maintenance. Rats run through people's gardens here. In our little stretch of street with 4 houses, it's really deteriorating. On one corner live labour migrants (every 3 months new people move in). The garden is overgrown, a dirty awning always hangs down, pieces of plastic in front of the windows. The owner of the house doesn't care about anything. For years, every 3 months, I've put energy into the occupants of that property. It makes me despondent. The municipality only enforces on the number of occupants and fire safety. On the other side, a private individual had the garages demolished. Now there's a fence in front, but it's easy to climb over. Rubbish bags are emptied and the area is overgrown. Adjacent buildings are constantly being partially demolished and then left like that. No one knows what will happen to this piece. The municipality doesn't respond. We've lived here for 42 years. Lived very nicely. Our children went to school here, to the playground, played outside in the 'back alley'. But it's increasingly decaying and deteriorating. Unfortunately. We like living in this part of Roosendaal. The municipality promises that the street will be renewed (sewers, road surface, etc.) but we see little of it. St. Elizabeth has been greatly expanded with maybe 100 residents. Construction traffic destroyed everything. The sewer system wasn't adapted, and residents have to use the road with their walkers and wheelchairs. Pavements are broken, too narrow, or full of cars. For example, during playground season or residents from other streets who don't want to park their cars in front of their own doors due to parking costs. We have a cosy neighbourhood. We look out for each other, help each other, have a good time together.
Auto-translated to English by AI
The housing stock is mainly post-war — 62% was built between 1945 and 1990. In addition, the most common type is flats (57%).
Over the past year a home for sale in Heerma van Vossstraat-Molenbeek was listed for an average of €325,941 (€3,402 per m²).
Buurt Heerma van Vossstraat-Molenbeek has 1,820 residents. The largest age group is 65+ years (31%). Notably, 51% of the households are single-person households.
The housing supply in Heerma van Vossstraat-Molenbeek is remarkably efficient: 53% has an A, A+ or B label. The average natural gas consumption per household is 970 m³ per year.
From Heerma van Vossstraat-Molenbeek you can on average reach a supermarket at 0.8 km, a GP at 0.8 km, a railway station at 1.9 km, a primary school at 0.5 km (as the crow flies, source: CBS).

Buurtje.nl uses cookies to make the site work and to improve it. In doing so, we process data such as your IP address and the pages you visit.
We use this data for three purposes: running the website (functional), measuring visits so we can improve Buurtje.nl (analytics), and — if you allow it — tailoring ads to your interests (marketing).
How we handle your data is described in our privacy policy. You can change your preferences at any time via 'Cookie preferences' at the bottom of every page.
Choose per category which cookies we may place. Read more in our privacy policy.