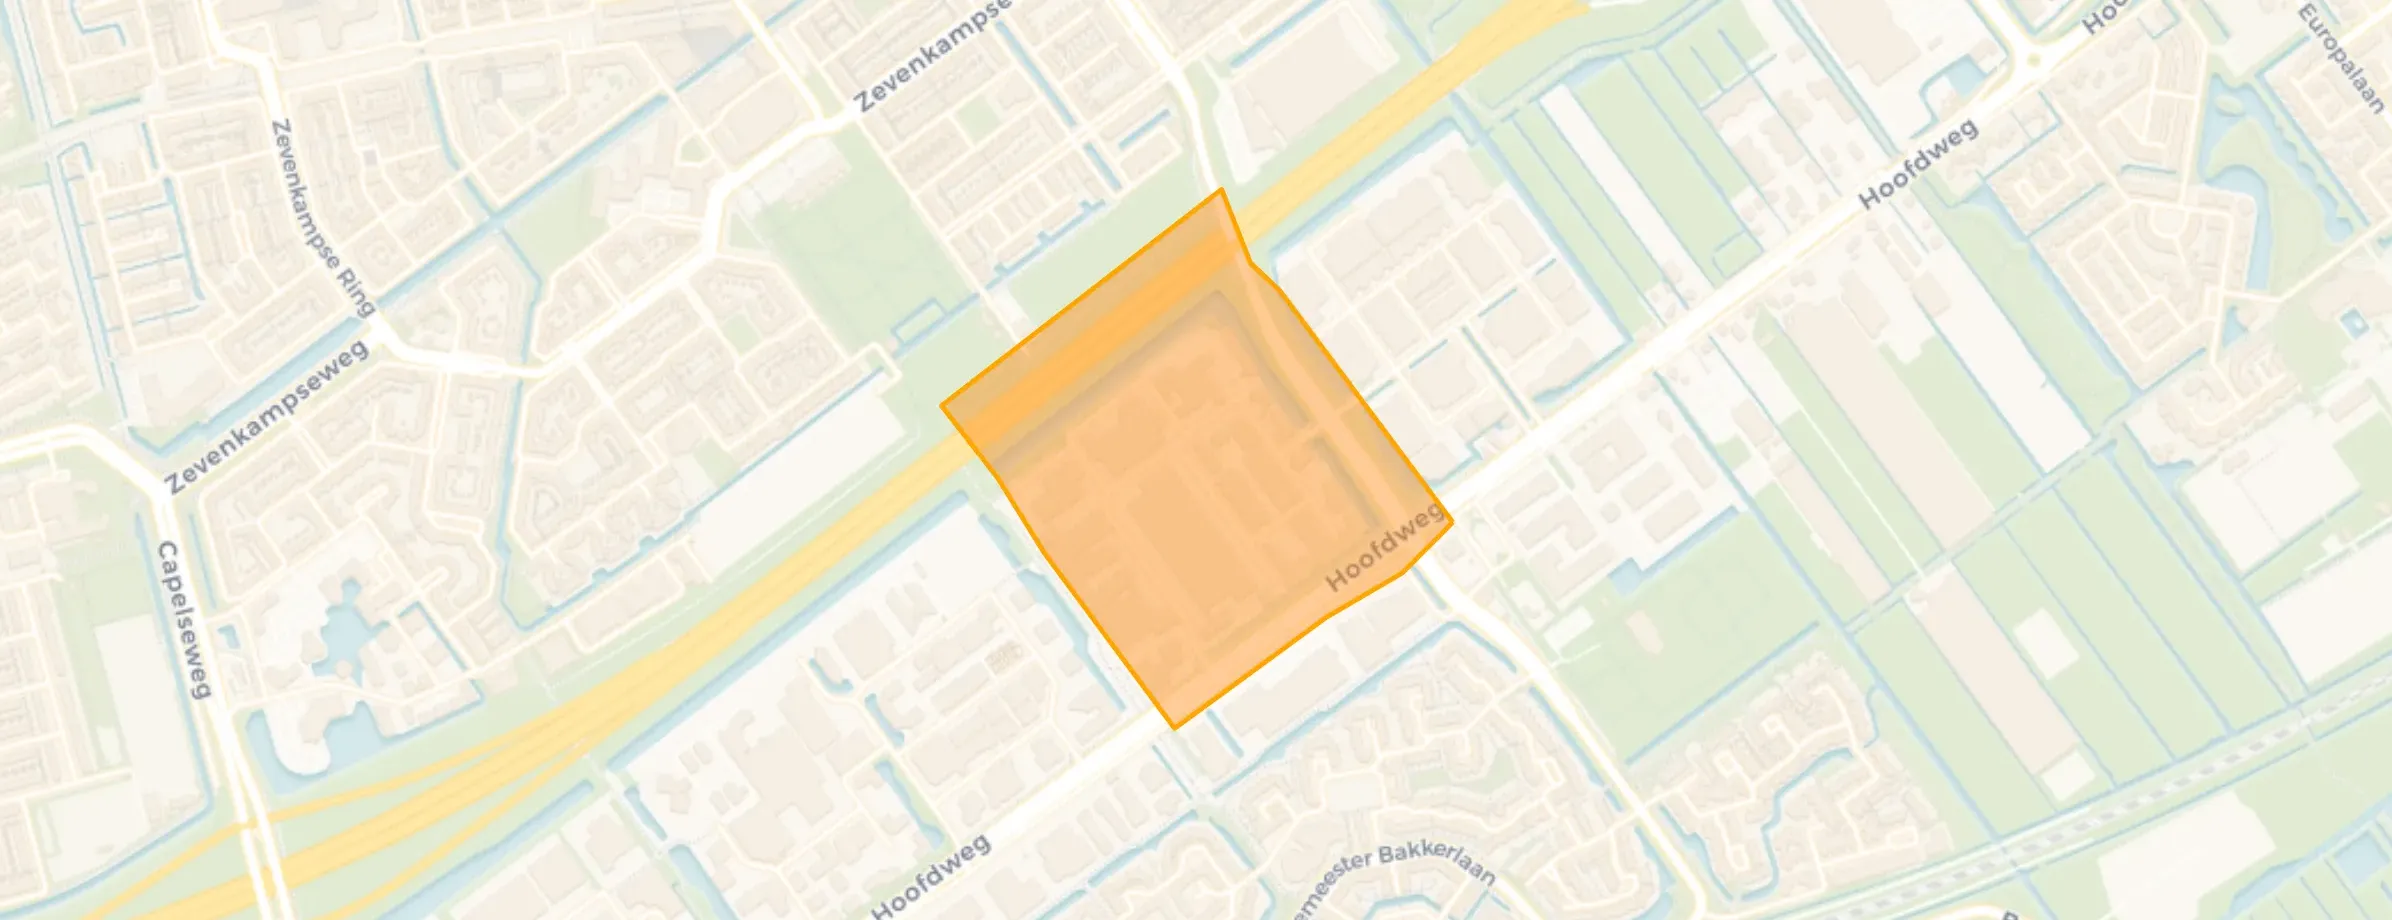
Hoofdweg sector D

Hoofdweg sector D, Capelle aan den IJssel

Neighbourhood in Capelle aan den IJssel

Energy label A is the most common in Hoofdweg sector DBased on registered homes

Hoofdweg sector D is located in the province of Zuid-Holland, in the municipality of Capelle aan den IJssel, in the district Schollevaar Noord The neighbourhood has a total area of 23 hectares, of which 22 hectares are land and 1 hectares are water. The neighbourhood is coded as BU05020884. The postcode area is 2908LJ-2908LM.

Homes for sale

There are currently no homes for sale in Hoofdweg sector D. No homes were sold in Hoofdweg sector D over the past year.

Rental homes

There is 1 homes for rent in Hoofdweg sector D. The most recent home is Essebaan 15C, offered by YouSpace B.V.. No homes were let in Hoofdweg sector D over the past year.

The average rent for a rental home in Hoofdweg sector D over the past year was €2.750 per month. Per m² of plot area that is €9 per month.

Energy

In Hoofdweg sector D there are 49 addresses with a registered energy label. The most common labels are A++ (51%), A (22%) and A+ (14%).

Street names

  • Polderbaan
  • Schollevaartse Dreef
  • Molenbaan
  • Venkelbaan
  • Cornusbaan
  • Burgemeester Schalijlaan
  • Hoofdweg
  • Essebaan
  • Nieuwemeer
View homes in Hoofdweg sector D

Easily find available homes, schools and supermarkets on our map.

View homes for sale View homes for rent
Rate Hoofdweg sector D

Share your opinion and help improve the neighbourhood.

  • Takes less than 2 minutes
  • Help home seekers
  • Improve your neighbourhood
Write a review
–
Hoofdweg sector D has no ratings yet
Ratings can be submitted via the button below
Write a review
Safety
Housing
Cleanliness
Amenities
Education
Community
Greenery
Accessibility

Housing market in Schollevaar Noord

Figures for the district Schollevaar Noord due to limited data

Sales market

Market speed and dynamics, last 12 months
58 days ▲ 60,8%
average time listed · vs. last year
86
sales in the past year
105 m²
average living area
€280.000
lowest sale price in the past year

Rental market

Market speed and dynamics, last 12 months
33 days
average time listed · vs. last year
19
lettings in the past year
66 m²
average living area
€914
lowest rent in the past year

Year built

Age of the housing stock

Energy labels

Sustainability of the housing stock

Living area

Distribution of home sizes

Statistics about the homes

Home types

Addresses per home type

Construction periods

Addresses per construction period

Labels

Addresses per energy label

Energy consumption

Average per address, compared with the Netherlands
Natural gas (m³)
Hoofdweg sector D
0
Netherlands
800
Electricity (kWh)
Hoofdweg sector D
0
Netherlands
2.550

Frequently asked questions about Hoofdweg sector D

What does the housing stock in Hoofdweg sector D look like?

The housing stock is mainly post-war — 81% was built between 1945 and 1990. In addition, the most common type is flats (55%).

How much does a home cost in Hoofdweg sector D?

Over the past year a home for sale in Hoofdweg sector D was listed for an average of €440,081 (€4,285 per m²).

What is the average rent in Hoofdweg sector D?

A rental home in Hoofdweg sector D cost an average of €1,279 per month (€20 per m²).

What are the energy labels in Hoofdweg sector D?

The housing supply in Hoofdweg sector D is remarkably efficient: 89% has an A, A+ or B label.

Buurtje.nl
Buurtje.nl in the appSearch faster and respond first
Open


