Municipality in Zuid-Holland
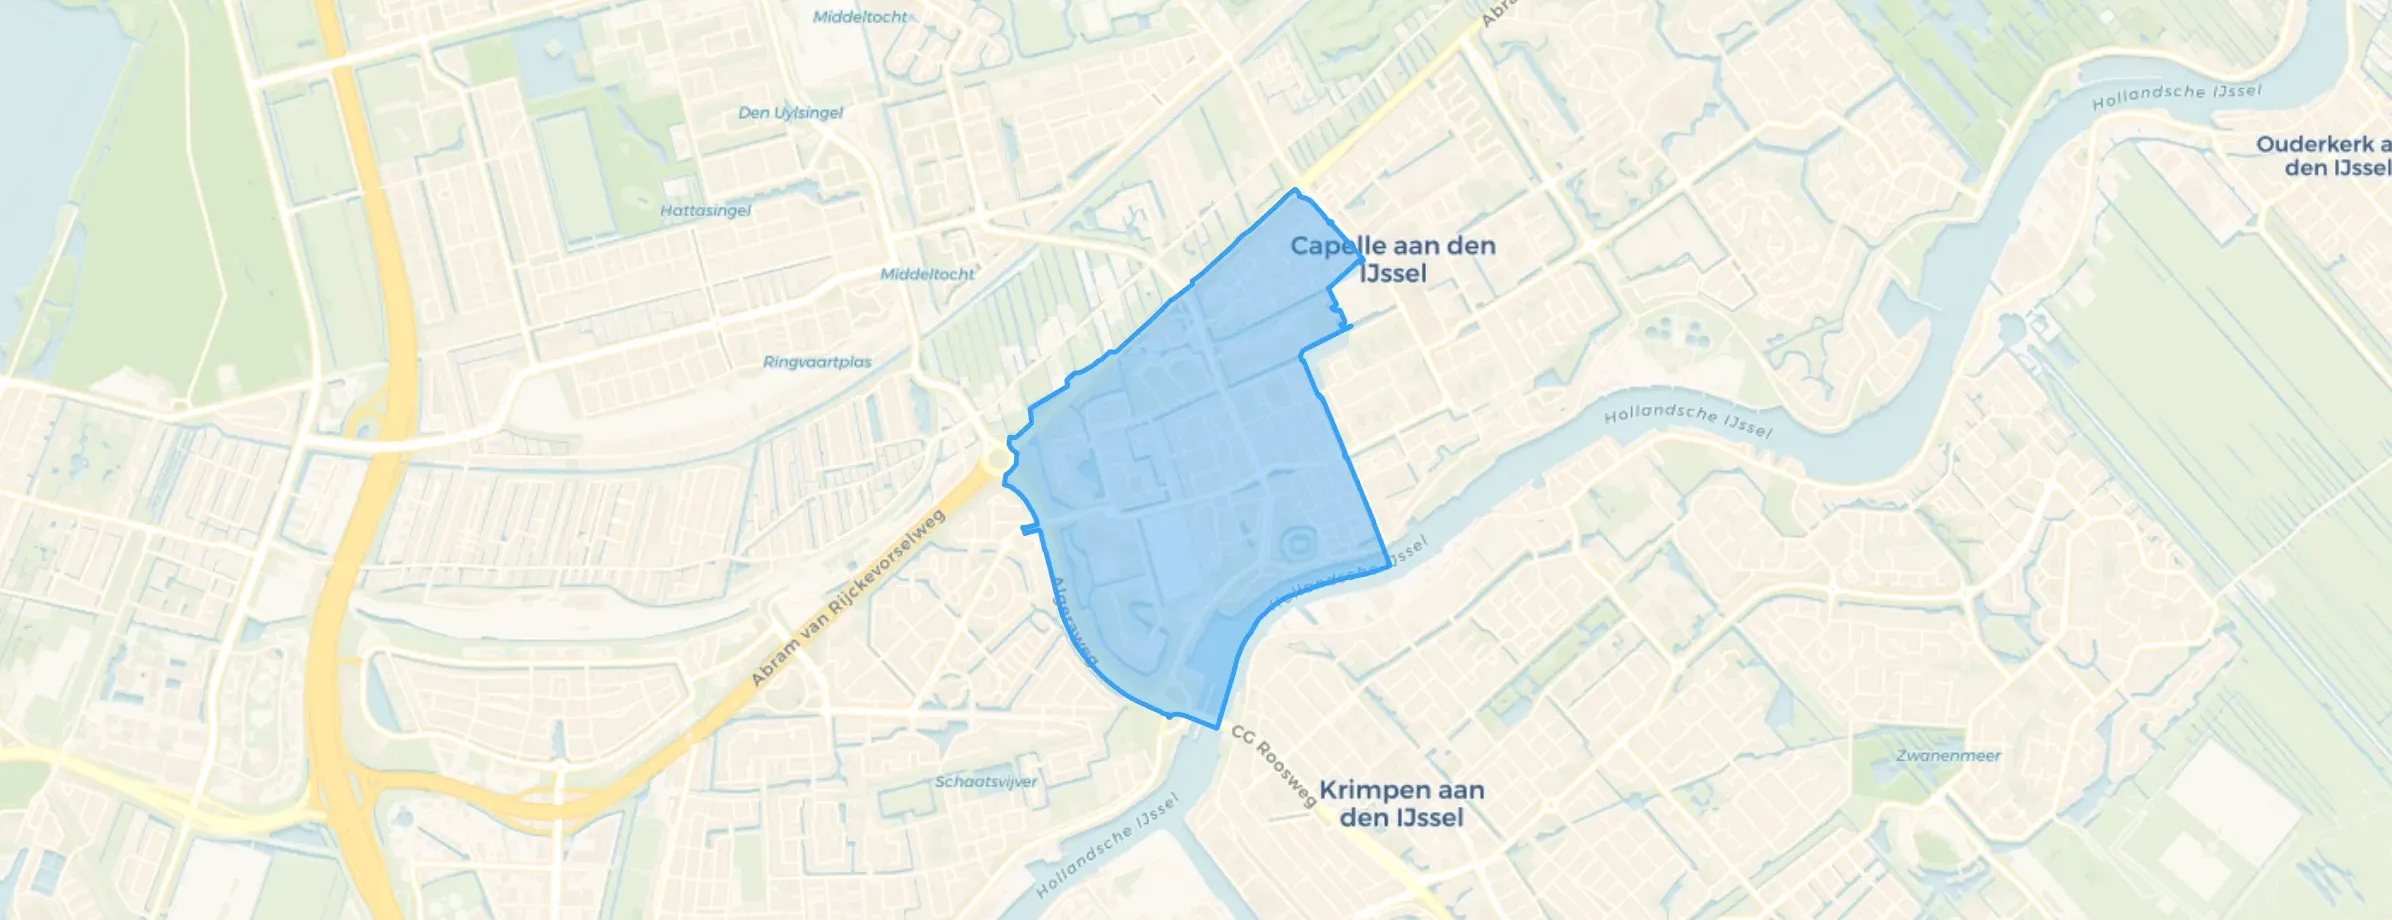
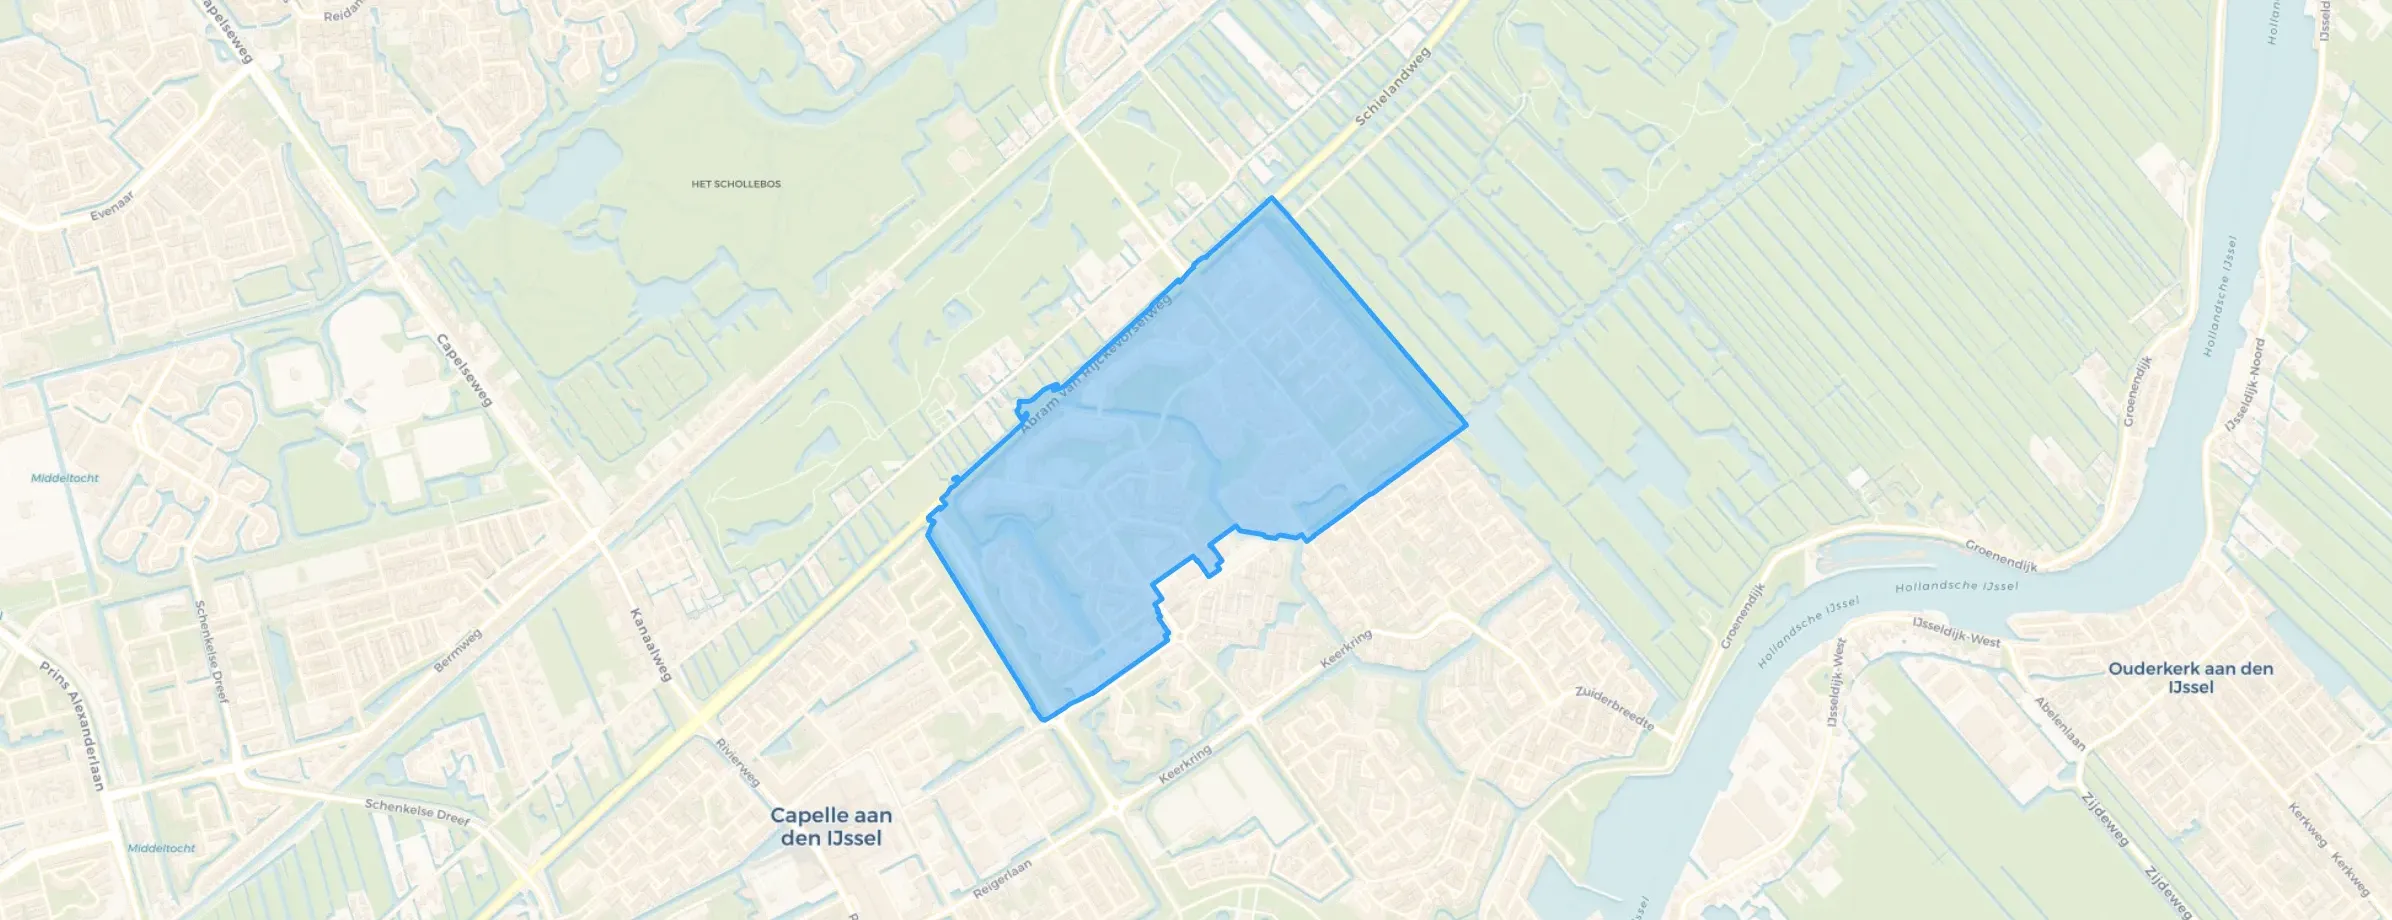
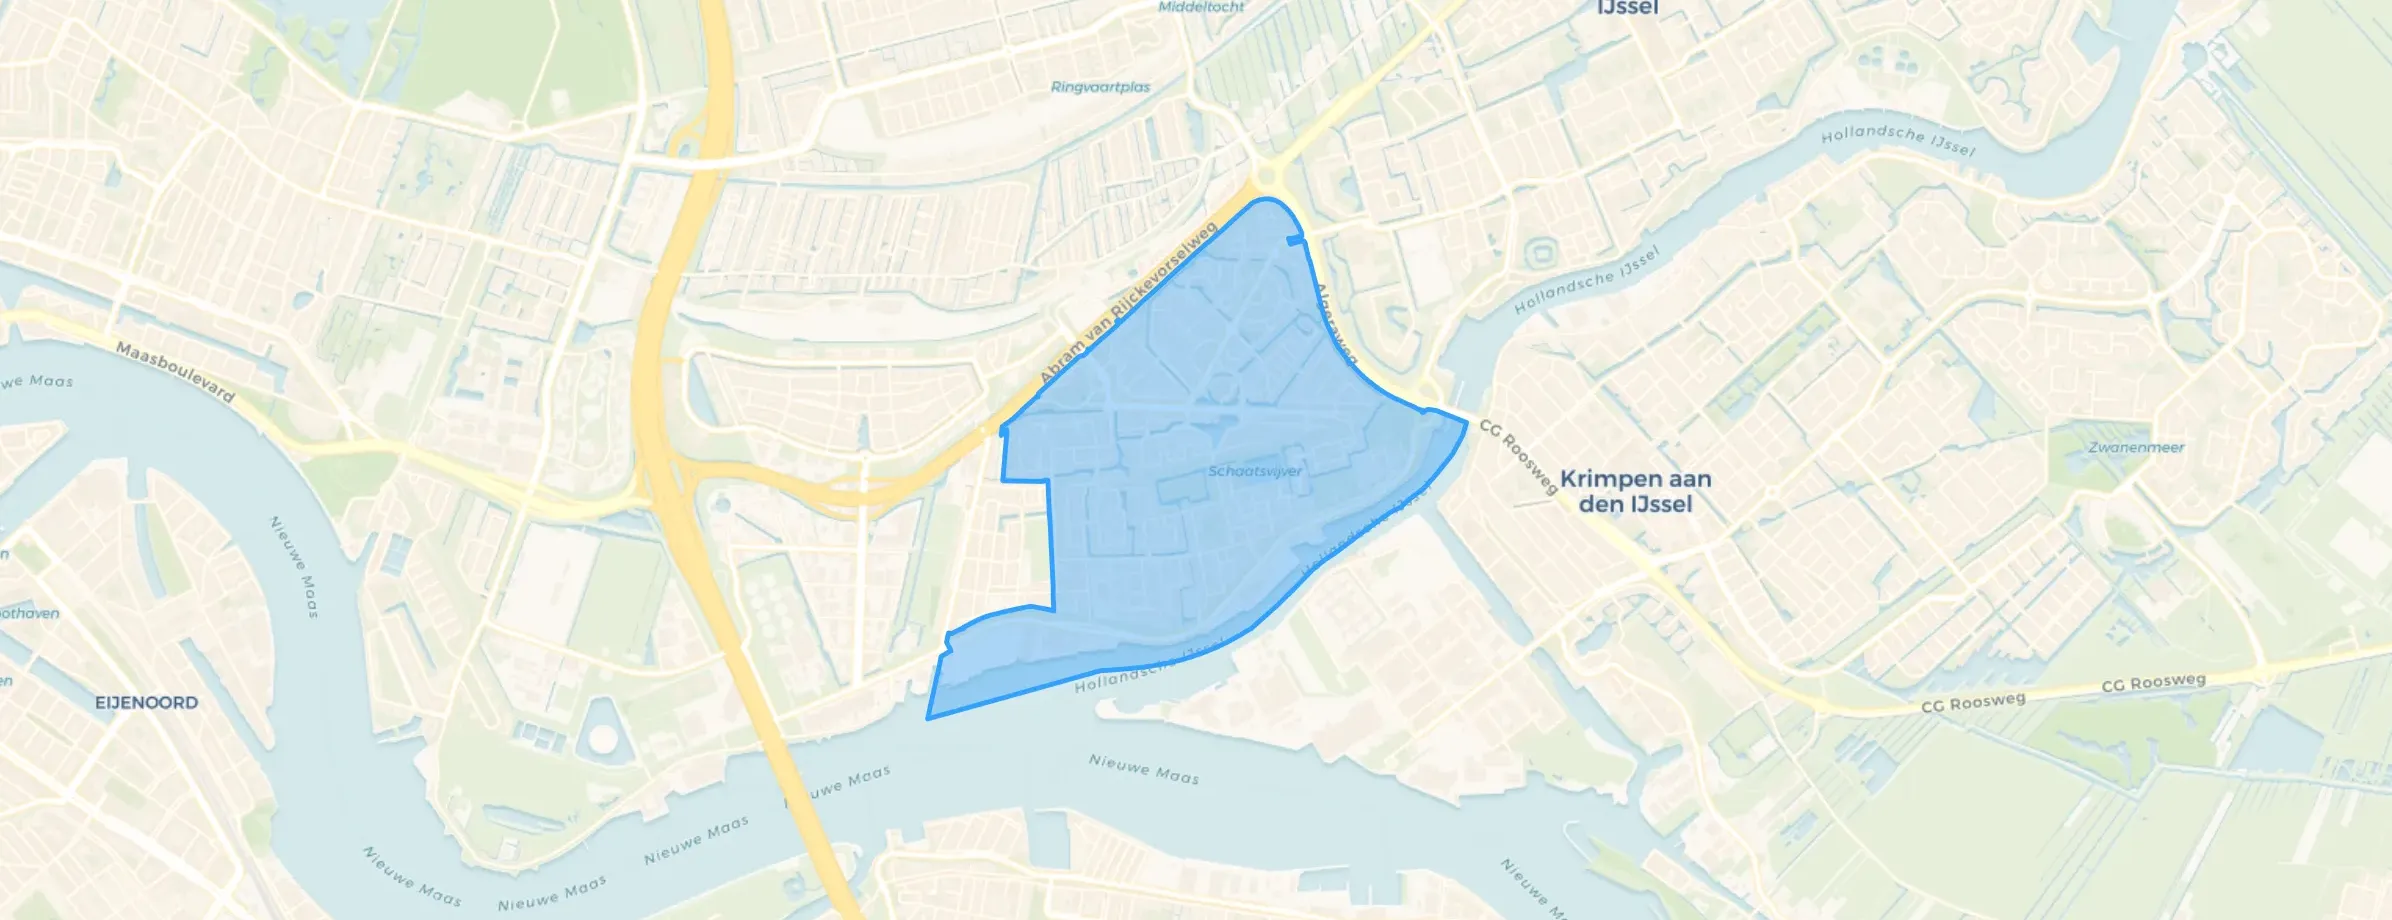
Capelle aan den IJssel is located in the province of Zuid-Holland The municipality has a total area of 1.540 hectares, of which 1.414 hectares are land and 126 hectares are water. The municipality is coded as GM0502. The postcode area is 2901AA-2909VD.
Capelle aan den IJssel has 67.925 residents. Of these, 48,4% are men and 51,6% are women. Most residents are 45 to 65 years (25,9%). The other age groups are 25,0% for '25 to 45 years', 22,0% for '65 years or older', 15,7% for '0 to 15 years' and 11,4% for '15 to 25 years'. Of the residents, 49,6% is unmarried, 36,2% is married, 9,2% is divorced and 5,1% is widowed. 39.700 residents originate from the Netherlands, 6.021 come from Europe and 22.204 come from countries outside Europe.
There are 32.117 households in Capelle aan den IJssel. 40,1% of these are single-person households, 26,6% households without children and 33,3% households with children. The average household size is 2,1 persons.
In Capelle aan den IJssel there are 53.800 income recipients. The average income per income recipient is €37.400, which is €1.600 (4%) higher than the national average of €35.800. Per resident, the average income is €30.400, which is €1.200 (4%) higher than the national average of €29.200. Most residents of Capelle aan den IJssel are educated to an intermediate level. 43,8% have an intermediate education (HAVO, VWO or MBO 2-4), 29,3% have a university or higher professional education (HBO/WO) and 26,9% have a lower education (VMBO or MBO 1).
Of the 67.925 residents, around 63% are in paid employment, which amounts to 42.793 people. This is 2% lower than the national average of 65%. The majority of workers are in salaried employment (86%), while 14% are self-employed. In Capelle aan den IJssel, 26% of residents receive a benefit. The largest group is those receiving a state pension (AOW). 13.180 people receive this benefit.
In Capelle aan den IJssel there are 31.488 homes with an average assessed value (WOZ) of €310.000. Of these, around 97% are occupied and 3% unoccupied. In Capelle aan den IJssel there are roughly as many rental as owner-occupied homes. This amounts to 46% rental homes and 54% owner-occupied homes. Of the homes, 53% privately owned, 35% owned by housing associations and 12% owned by other landlords. The most common construction periods in Capelle aan den IJssel are 1970-1980 (26%) and 1980-1990 (24%).
There are currently no homes for sale in Capelle aan den IJssel. The most recently listed home is Evertsenstraat 3M by Delta NVM Makelaars op Funda. No homes were sold in Capelle aan den IJssel over the past year.
There are currently no homes for rent in Capelle aan den IJssel. The most recent home is Wormerhoek 14Z, offered by Schep Vastgoedmakelaars. No homes were let in Capelle aan den IJssel over the past year.
No recent rental data available for Capelle aan den IJssel.
In Capelle aan den IJssel there are 33.028 addresses with a registered energy label. The most common labels are C (31%), A (25%) and B (20%). On average, an address in Capelle aan den IJssel uses 2.600 kWh of electricity per year. This is 7% below the national average of 2.810 kWh. With an annual consumption of 620 m³ per address, natural gas consumption is 52% below the national average of 1.280 m³.
There are more facilities than indicated here. There is a vet in the neighbourhood itself and a church within walking distance. There is a dog walking area nearby. As for hygiene, there is always rubbish next to the bins, especially bulky waste. People just dump it without reporting it. There is little or no control over this. It doesn't look good for the neighbourhood. What I find strange is that there is also an anti-squat house in the area.
Auto-translated to English by AIThe neighbourhood is well maintained by the municipality and residents. Cosy and quiet. Bus runs through the area, good connection to train and metro.
Auto-translated to English by AIIs deteriorating very quickly and little is being done about it
Auto-translated to English by AINice neighbourhood. With residents who care about each other. We go to clubhouse Klavier to dance, bingo, bands. In our building they eat together, bingo, communal garden. Which we use and arrange together. Beautiful forest with the playground. Enjoy a cosy coffee at the Portuguese place Meesterwerk or pancake house, great neighbourhood!
Auto-translated to English by AIThe neighbourhood is directly linked to Rotterdam, given the metro, and often feels more like an extension of the city. There are plenty of amenities. The children here are really very cheeky, I think. Lately, much more noise nuisance and just strange things on the street. Saw a guy doing karaoke at 1 AM outside my door recently. Almost everything is adequate, but it's getting weirder and weirder. I feel safe enough to walk around at night, but as soon as I see someone, I'm also quick to leave.
Auto-translated to English by AIIt's a place to settle down. Very safe, very green and peaceful.
Auto-translated to English by AIPerfect environment, very calm and peaceful. High access to public transportation & highway.
Auto-translated to English by AIGreat place to live
Auto-translated to English by AI
The housing stock is mainly post-war — 60% was built between 1945 and 1990. In addition, the most common type is flats (57%).
Over the past year a home for sale in Capelle aan den IJssel was listed for an average of €463,032 (€4,295 per m²).
A rental home in Capelle aan den IJssel cost an average of €1,768 per month (€19 per m²).
Residents give Capelle aan den IJssel a 8.2 out of 10 based on 20 reviews. Especially accessibility (8.8) scores well; education (7.5) receives the lowest rating.
The housing supply in Capelle aan den IJssel is remarkably efficient: 54% has an A, A+ or B label. The average natural gas consumption per household is 620 m³ per year.
From Capelle aan den IJssel you can on average reach a supermarket at 0.7 km, a GP at 0.8 km, a railway station at 3.5 km, a primary school at 0.7 km (as the crow flies, source: CBS).
Right now you will find 305 homes for sale and 33 homes for rent in Capelle aan den IJssel.

Buurtje.nl uses cookies to make the site work and to improve it. In doing so, we process data such as your IP address and the pages you visit.
We use this data for three purposes: running the website (functional), measuring visits so we can improve Buurtje.nl (analytics), and — if you allow it — tailoring ads to your interests (marketing).
How we handle your data is described in our privacy policy. You can change your preferences at any time via 'Cookie preferences' at the bottom of every page.
Choose per category which cookies we may place. Read more in our privacy policy.