Neighbourhood in Hengelo
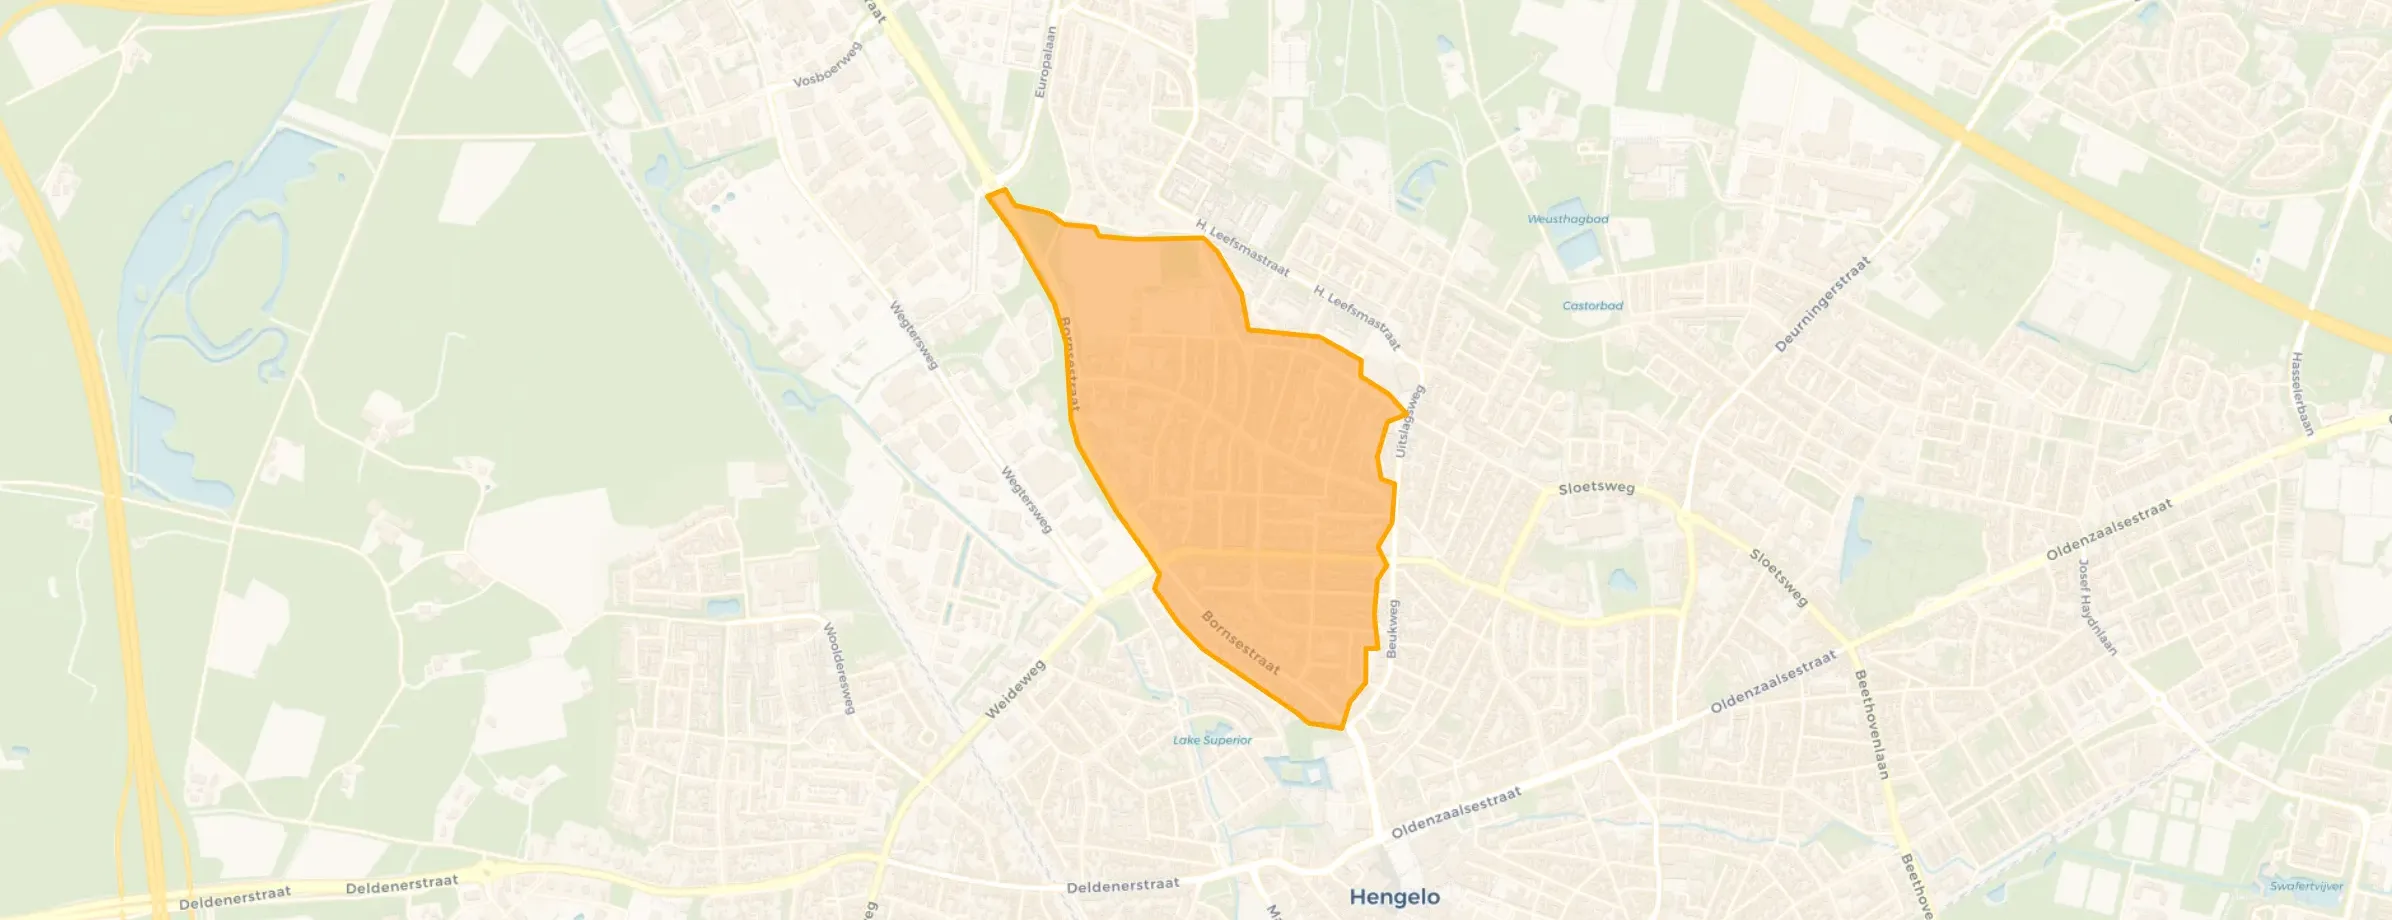
’t Wilbert is located in the province of Overijssel, in the municipality of Hengelo, in the district Hengelose Es The neighbourhood has a total area of 59 hectares, of which 59 hectares are land and 0 hectares are water. The neighbourhood is coded as BU01640102. The postcode area is 7556BA-7556WZ.
Three residents rate the neighbourhood as more than satisfactory with a score of 6.9. They describe it as 'A neighbourhood that was once so beautiful.', 'Just cosy' and 'Cosy'. Residents experience big differences in this neighbourhood: accessibility, amenities, safety receive high ratings, while housing and community are mentioned as weak points.
’t Wilbert has 2.940 residents. Of these, 49,1% are men and 50,7% are women. Most residents are 45 to 65 years (28,9%). The other age groups are 24,5% for '25 to 45 years', 19,9% for '65 years or older', 13,8% for '0 to 15 years' and 12,8% for '15 to 25 years'. Of the residents, 51,4% is unmarried, 34,7% is married, 9,7% is divorced and 3,9% is widowed. 2.355 residents originate from the Netherlands, 165 come from Europe and 420 come from countries outside Europe.
There are 1.415 households in ’t Wilbert. 40,3% of these are single-person households, 24,7% households without children and 35,0% households with children. The average household size is 2,1 persons. The national average is 2,1 persons.
In ’t Wilbert there are 2.500 income recipients. The average income per income recipient is €35.200, which is €7.000 (17%) lower than the national average of €42.200. Per resident, the average income is €31.700, which is €3.200 (9%) lower than the national average of €34.900. Most residents of ’t Wilbert are educated to an intermediate level. 40,8% have an intermediate education (HAVO, VWO or MBO 2-4), 31,6% have a university or higher professional education (HBO/WO) and 27,6% have a lower education (VMBO or MBO 1).
Of the 2.940 residents, around 72% are in paid employment, which amounts to 2.117 people. This is 0% lower than the national average of 72%. The majority of workers are in salaried employment (87%), while 13% are self-employed. In ’t Wilbert, 28% of residents receive a benefit. The largest group is those receiving a state pension (AOW). 500 people receive this benefit.
In ’t Wilbert there are 1.420 homes with an average assessed value (WOZ) of €300.000. Of these, around 97% are occupied and 3% unoccupied. Most homes are owner-occupied. This amounts to 45% rental homes and 55% owner-occupied homes. Of the homes, 55% privately owned, 40% owned by housing associations and 5% owned by other landlords. The most common construction periods in ’t Wilbert are 1925-1950 (65%) and 1900-1925 (12%).
There are currently 10 homes for sale in ’t Wilbert. The most recently listed home is Mr. P.J. Troelstrastraat 103 by HOME makelaars op Funda. Over the past year, 107 homes were sold in ’t Wilbert. On average, a home was sold within 31 days.
The average asking price for a home for sale in ’t Wilbert over the past year was €379.603. This is 27% higher than the average assessed value (WOZ) of €300.000. The average asking price per m² of plot is €2.711.
There are currently no homes for rent in ’t Wilbert. The most recent home is Rembrandtstraat 67, offered by www.woninghuren.nl. Over the past year, 2 homes were let in ’t Wilbert. On average, a listing was let within 14 days.
No recent rental data available for ’t Wilbert.
In ’t Wilbert there are 812 addresses with a registered energy label. The most common labels are C (23%), B (16%) and D (16%). On average, an address in ’t Wilbert uses 2.450 kWh of electricity per year. This is 4% below the national average of 2.550 kWh. Natural gas consumption, at 970 m³ per year, is 21% above the national average of 800 m³.
Our street was once a beautiful street. But ruined completely by certain people. And you don't get any help. Such a shame. The neighbourhood is also not well maintained by the municipality; nowadays this is only for the better neighbourhoods where people with money live. And the housing association washes its hands of many things. The ordinary person can only get flats anymore. Where has our Hengelo gone, where I always lived so happily! What could be improved is the rubbish situation, that houses are better maintained, overall maintenance of streets, etc. And that there aren't deep trenches next to streets, life-threatening. Even if you call them, they change nothing. Fences around playgrounds, making unsafe streets safe again. And that they don't charge mega rent prices for small old houses and that new houses are also built for social renters. And that the municipality and police really intervene when necessary. But something has to happen first. Sad, all of it! Such a shame!
Auto-translated to English by AIIt's cosy here with the family, but there's no doing anything with the neighbours.
Auto-translated to English by AILiving there is quite fine because living close to the city is within walking distance
Auto-translated to English by AIThe housing stock is predominantly pre-war — 80% of the homes date from before 1945.
Over the past year a home for sale in ’t Wilbert was listed for an average of €380,965 (€2,952 per m²). That is 28% below the Dutch national average. Last quarter prices fell by 12%.
Residents give ’t Wilbert a 6.9 out of 10 based on 3 reviews. Especially accessibility (8.7) scores well; community (4.3) receives the lowest rating.
Buurt ’t Wilbert has 2,940 residents. Many families: 35% of the households have children.
A considerable share of the supply in ’t Wilbert is less efficient: 38% has an E, F or G label. The average natural gas consumption per household is 970 m³ per year.
From ’t Wilbert you can on average reach a supermarket at 0.7 km, a GP at 0.8 km, a railway station at 1.9 km, a primary school at 0.7 km (as the crow flies, source: CBS).
Right now you will find 10 homes for sale in ’t Wilbert.