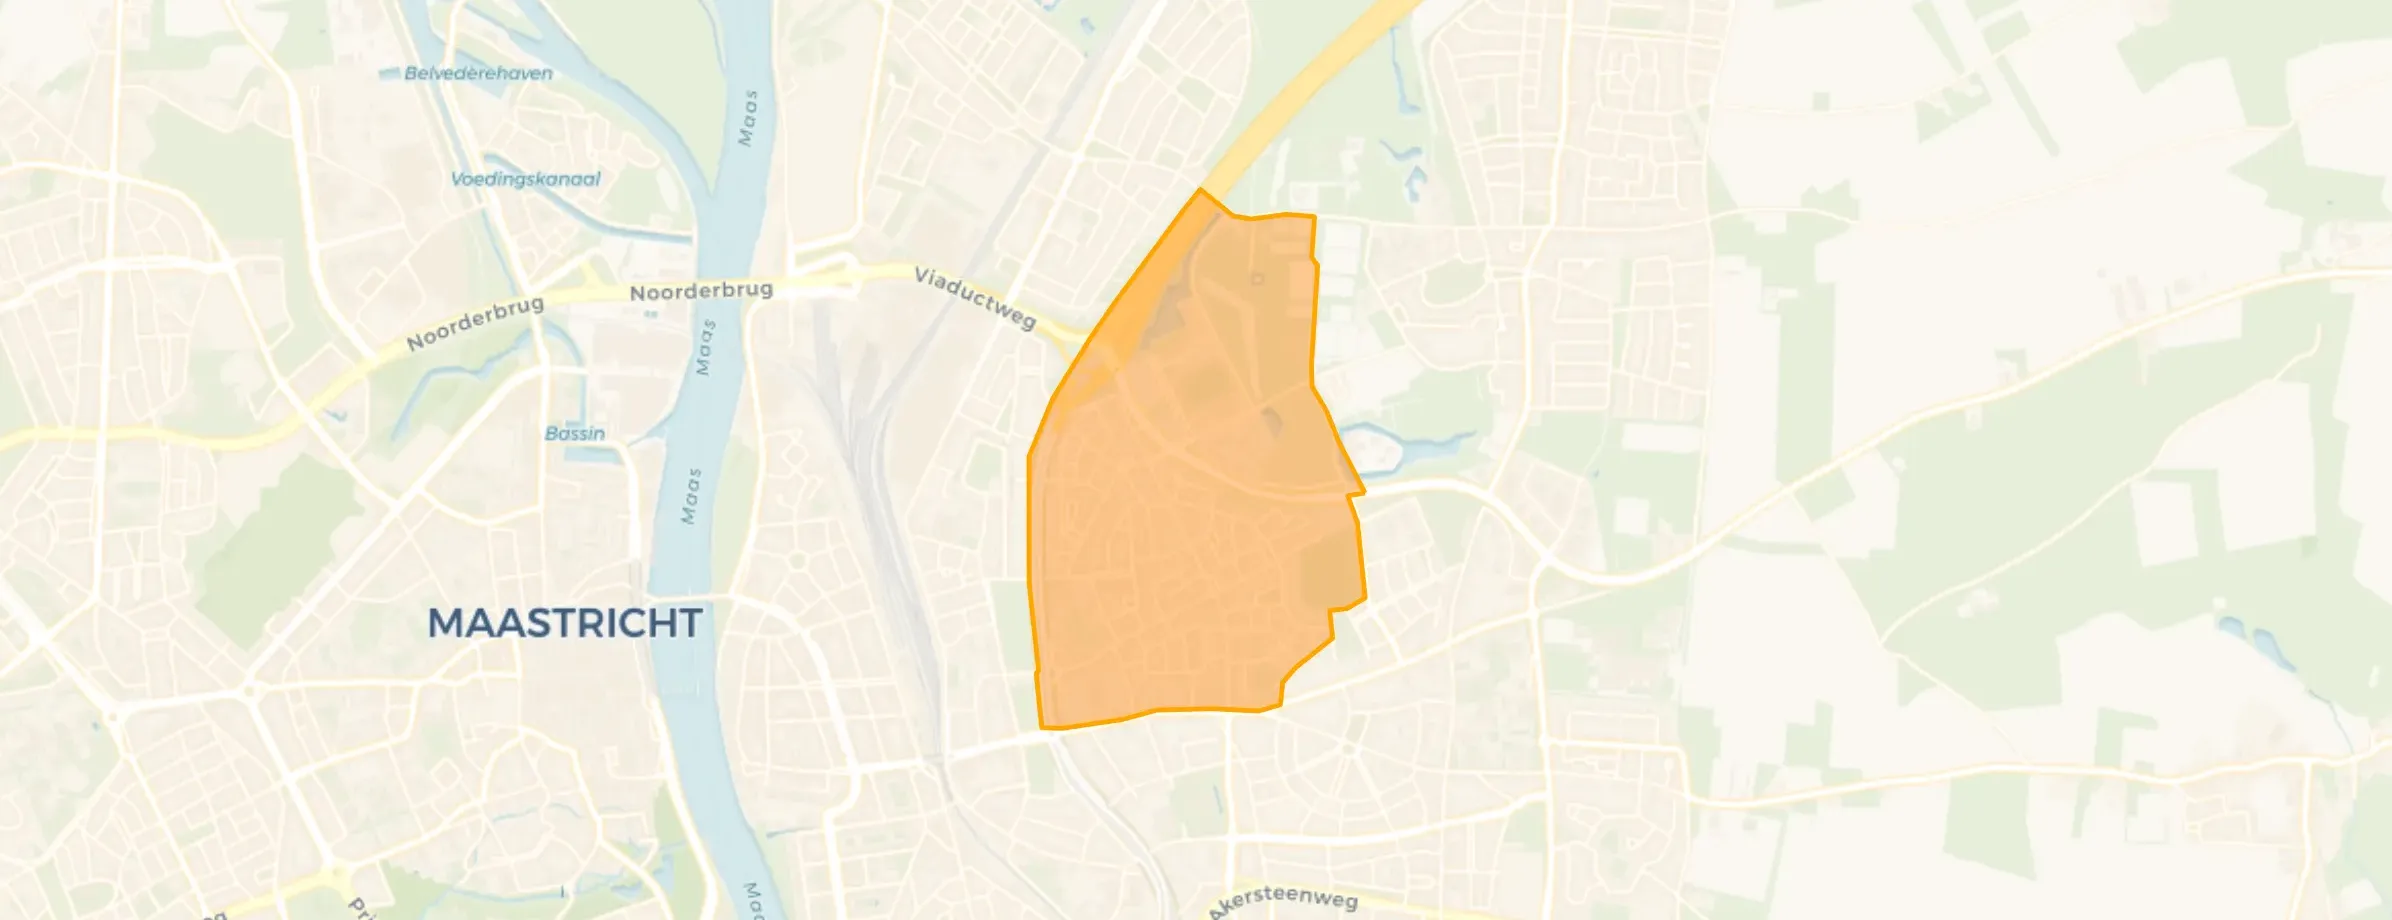
Wittevrouwenveld
LimburgMaastrichtBuitenwijk OostWittevrouwenveld

Wittevrouwenveld, Maastricht – “Fine”

Neighbourhood in Maastricht

6.9
Residents give Wittevrouwenveld a satisfactory ratingThis score is based on 2 responses
View
Wittevrouwenveld has 6,055 residentsMost are 25 to 45 years old
There are 2,772 homes in WittevrouwenveldCurrently there are 28 for sale and 31 for rent
Energy label A is the most common in WittevrouwenveldBased on registered homes

Wittevrouwenveld is located in the province of Limburg, in the municipality of Maastricht, in the district Buitenwijk Oost The neighbourhood has a total area of 115 hectares, of which 112 hectares are land and 3 hectares are water. The neighbourhood is coded as BU09350402. The postcode area is 6224AA-6226XZ.

Two residents rate the neighbourhood as more than satisfactory with a score of 6.9. They describe it as 'Fine' and 'Cosy and fun neighbourhood'. Based on a limited number of reviews, no clear trends are visible yet in this neighbourhood.

Residents

Wittevrouwenveld has 6.055 residents. Of these, 47,5% are men and 52,5% are women. Most residents are 25 to 45 years (28,5%). The other age groups are 22,9% for '45 to 65 years', 21,8% for '15 to 25 years', 14,6% for '65 years or older' and 12,1% for '0 to 15 years'. Of the residents, 61,0% is unmarried, 26,3% is married, 8,9% is divorced and 3,6% is widowed. 3.505 residents originate from the Netherlands, 1.170 come from Europe and 1.380 come from countries outside Europe.

There are 3.470 households in Wittevrouwenveld. 57,8% of these are single-person households, 21,2% households without children and 21,0% households with children. The average household size is 1,7 persons.

In Wittevrouwenveld there are 4.400 income recipients. The average income per income recipient is €28.400, which is €7.400 (21%) lower than the national average of €35.800. Per resident, the average income is €23.800, which is €5.400 (18%) lower than the national average of €29.200. Most residents of Wittevrouwenveld are educated to a lower level. 46,1% have a lower education (VMBO or MBO 1), 31,9% have an intermediate education (HAVO, VWO or MBO 2-4) and 22,0% have a university or higher professional education (HBO/WO).

Of the 6.055 residents, around 52% are in paid employment, which amounts to 3.149 people. This is 13% lower than the national average of 65%. The majority of workers are in salaried employment (89%), while 11% are self-employed. In Wittevrouwenveld, 26% of residents receive a benefit. The largest group is those receiving a state pension (AOW). 750 people receive this benefit.

Housing

In Wittevrouwenveld there are 2.772 homes with an average assessed value (WOZ) of €256.000. Of these, around 95% are occupied and 5% unoccupied. Most homes are rental properties. This amounts to 72% rental homes and 28% owner-occupied homes. Of the homes, 28% privately owned, 47% owned by housing associations, 24% owned by other landlords and 1% of unknown ownership. The most common construction periods in Wittevrouwenveld are 1925-1950 (27%) and 2020 and later (17%).

Homes for sale

There are currently 24 homes for sale in Wittevrouwenveld. The most recently listed home is President Rooseveltlaan 154 by Pro Housing Exclusive Real Estate. Over the past year, 131 homes were sold in Wittevrouwenveld. On average, a home was sold within 66 days.

The average asking price for a home for sale in Wittevrouwenveld over the past year was €429.052. This is 68% higher than the average assessed value (WOZ) of €256.000. The average asking price per m² of plot is €3.797.

Rental homes

There are 18 homes for rent in Wittevrouwenveld. The most recent home is Tillystraat 22, offered by www.thuisinlimburg.nl. Over the past year, 122 homes were let in Wittevrouwenveld. On average, a listing was let within 26 days.

The average rent for a rental home in Wittevrouwenveld over the past year was €1.954 per month. Per m² of plot area that is €17 per month.

Energy

In Wittevrouwenveld there are 3.157 addresses with a registered energy label. The most common labels are A (20%), C (18%) and B (16%). On average, an address in Wittevrouwenveld uses 2.280 kWh of electricity per year. This is 19% below the national average of 2.810 kWh. With an annual consumption of 880 m³ per address, natural gas consumption is 31% below the national average of 1.280 m³.

Street names

  • Maasgouwstraat
  • De la Rivestraat
  • Aartshertogenplein
  • Marconistraat
  • Schepenenplein
  • Burgemeester Hennequinstraat
  • Austrasiëstraat
  • Stadionweg
  • Reinier Langhalsstraat
  • Karolingenstraat
  • Paardentunnel
  • Albertusstraat
  • Tillystraat
  • Koningsplein flat
  • Groene Loper
  • Giselbertstraat
  • Voltastraat
  • Eburonenweg
  • Pastoor Jacobsweg
  • Schepen Bemelmansstraat
  • Stadionplein
  • Saksenstraat
  • Van Pallantstraat
  • James Wattstraat
  • Tubantenstraat
  • Habsburgerstraat
  • Hofmeiersplein
  • Schepen Helgersstraat
  • Lourdesplein
  • Aldegondaplantsoen
  • Edisonstraat
  • Gerbergaplantsoen
  • Bergmansweg
  • Koning Clovisstraat
  • Batavierenstraat
  • Schwartzenbergstraat
  • Dagobertstraat
  • Tapijnstraat
  • Friezenplein
  • Burgemeester van Akenstraat
  • Doctor Schaepmanstraat
  • Geusseltweg
  • Franklinstraat
  • Karel Martelstraat
  • Amalbergastraat
  • Burgemeestersplein
  • Monseigneur Beelpad
  • Ampèreplantsoen
  • Keizer Arnulfstraat
  • Aartshertogenstraat
  • Burgemeester Michiels van Kessenichpassage
  • Burgemeester Baetencour
  • Friezenstraat
  • Habsburgerplein
  • Pierre de Coubertinweg
  • Burgemeester Pijlsstraat
  • Frankenstraat
  • Burgemeester Raatstraat
  • Schepen Pichotstraat
  • Schepen Roosenstraat
  • Terblijterweg
  • Stadhoudersstraat
  • Merovingenstraat
  • Hornestraat
  • Koningsplein
  • Schepen van Panhuysstraat
  • Beerselstraat
  • Koning Zwentiboldstraat
  • Atletenbaan
  • Parmastraat
  • Burgemeester Wijnandtsstraat
  • Keizer Ottostraat
  • Morsestraat
  • Schepen Engelenstraat
  • Professor Quixstraat
  • Tolbiacstraat
  • Schepen van Meerbekestraat
  • Marathonweg
  • President Rooseveltlaan
  • Severenstraat
  • Discusworp
  • Koning Childebertstraat
  • Hofmeiersstraat
  • Burgemeester Nierstraszstraat
  • Burgemeester Bauduinstraat
  • Olympiaweg
  • Graham Bellpad
  • Burgemeester van Oppenstraat
  • Aldegondapad
  • Czaar Peterstraat

Amenities

GP
0,4 km
Pharmacy
0,5 km
Hospital
1,5 km
Supermarket
0,4 km
Railway station
2,0 km
Day nursery
0,5 km
Primary school
0,6 km
Secondary school
0,8 km
View homes in Wittevrouwenveld

Easily find available homes, schools and supermarkets on our map.

View 28 homes for sale View 31 homes for rent
Rate Wittevrouwenveld

Share your opinion and help improve the neighbourhood.

  • Takes less than 2 minutes
  • Help home seekers
  • Improve your neighbourhood
Write a review
6.9
Residents give Wittevrouwenveld a more than satisfactory rating
This score is based on 2 responses
Join the conversation
Safety
Housing
Cleanliness
Amenities
Education
Community
Greenery
Accessibility

Experiences of Wittevrouwenveld

Join the conversation
6.1
Jeanine kuijpers
Living together · Terraced house
09-12-2024
Fine

It's a nice neighbourhood to live in. The only pity is that nothing has been created for children on the square. Otherwise, we have everything we need in the neighbourhood. GP, pharmacy, supermarket, etc. It's just a short walk to the centre. But I find it terrible that, especially in summer, the council only collects the bins every other week.

Auto-translated to English by AI
7.6
Emma
Gezin
12-11-2023
Cosy and fun neighbourhood

....

Auto-translated to English by AI

Statistics about the residents

Ages

Residents per age category

Household composition

Households per category
2,005Single-person households
735Households without children
730Households with children

Gender

Residents by gender
Men
Women

Marital status

Residents by marital status
Married
Unmarried
Divorced
Widowed

Origin

Residents per category of origin
Netherlands
Europe
Outside Europe

Work & income

Labour participation and average income
€23,800 P.A.average per resident22% below the national average
€28,400 P.A.average per income recipient24% below the national average
1%is in paid employment
0%is self-employed
1%
of the residents are employed
72%
is the national average

Education level

Residents per education level
VMBO, MBO 1
HAVO/VWO, MBO 2-4
HBO/WO

Wealth

Median wealth per household
Wittevrouwenveld
Netherlands

Benefits

Residents per benefit type
Social assistance
Disability
Unemployment
Sponsored
View more than 250 topics about Wittevrouwenveld in clear figures and charts on AlleCijfers.nl!
View on AlleCijfers.nl

Housing market in Wittevrouwenveld

Sale price · Q3 2026
€464.198
average▲ 7,0%
€450.000
median▲ 1,2%
24 sales · vs. Q2 2026
€/m² for sale · Q3 2026
€4.441
average▲ 7,3%
€4.462
median▲ 4,3%

Price trend for rent

Rent per quarter · Q3 '25 – Q2 '26
Average
Median

Sales market

Market speed and dynamics, last 12 months
71 days
average time listed · vs. last year
78
sales in the past year
104 m²
average living area
€117.000
lowest sale price in the past year

Rental market

Market speed and dynamics, last 12 months
30 days
average time listed · vs. last year
29
lettings in the past year
81 m²
average living area
€694
lowest rent in the past year

Year built

Age of the housing stock

Energy labels

Sustainability of the housing stock

Living area

Distribution of home sizes

Statistics about the homes

Home types

Addresses per home type

Construction periods

Addresses per construction period

Labels

Addresses per energy label

Energy consumption

Average per address, compared with the Netherlands
Natural gas (m³)
Wittevrouwenveld
880
Netherlands
1.280
Electricity (kWh)
Wittevrouwenveld
2.280
Netherlands
2.810

Frequently asked questions about Wittevrouwenveld

What kind of homes are there in Wittevrouwenveld?

The most common type is flats (51%).

What do you pay for a house in Wittevrouwenveld?

Over the past year a home for sale in Wittevrouwenveld was listed for an average of €429,808 (€4,313 per m²). Last quarter prices rose by 7%.

What do you pay for a rental home in Wittevrouwenveld?

A rental home in Wittevrouwenveld cost an average of €1,591 per month (€21 per m²).

What kind of people live in Wittevrouwenveld?

Buurt Wittevrouwenveld has 6,055 residents. Notably, 58% of the households are single-person households.

How energy-efficient are the homes in Wittevrouwenveld?

The housing supply in Wittevrouwenveld is remarkably efficient: 62% has an A, A+ or B label. The average natural gas consumption per household is 880 m³ per year.

What is within walking distance in Wittevrouwenveld?

From Wittevrouwenveld you can on average reach a supermarket at 0.4 km, a GP at 0.4 km, a railway station at 2.0 km, a primary school at 0.6 km (as the crow flies, source: CBS).

How many houses are on offer in Wittevrouwenveld?

Right now you will find 28 homes for sale and 31 homes for rent in Wittevrouwenveld. A home for sale here is listed for an average of 70 days — relatively long for the current market.

Buurtje.nl
Buurtje.nl in the appSearch faster and respond first
Open