Give feedback Report a problem
District in HeerlenDe Beitel
Limburg›Heerlen›De Beitel
De Beitel has 80 residentsMost are 45 to 65 years old
There are 29 homes in De BeitelCurrently there are 0 for sale and 0 for rent
Energy label A is the most common in De BeitelBased on registered homes

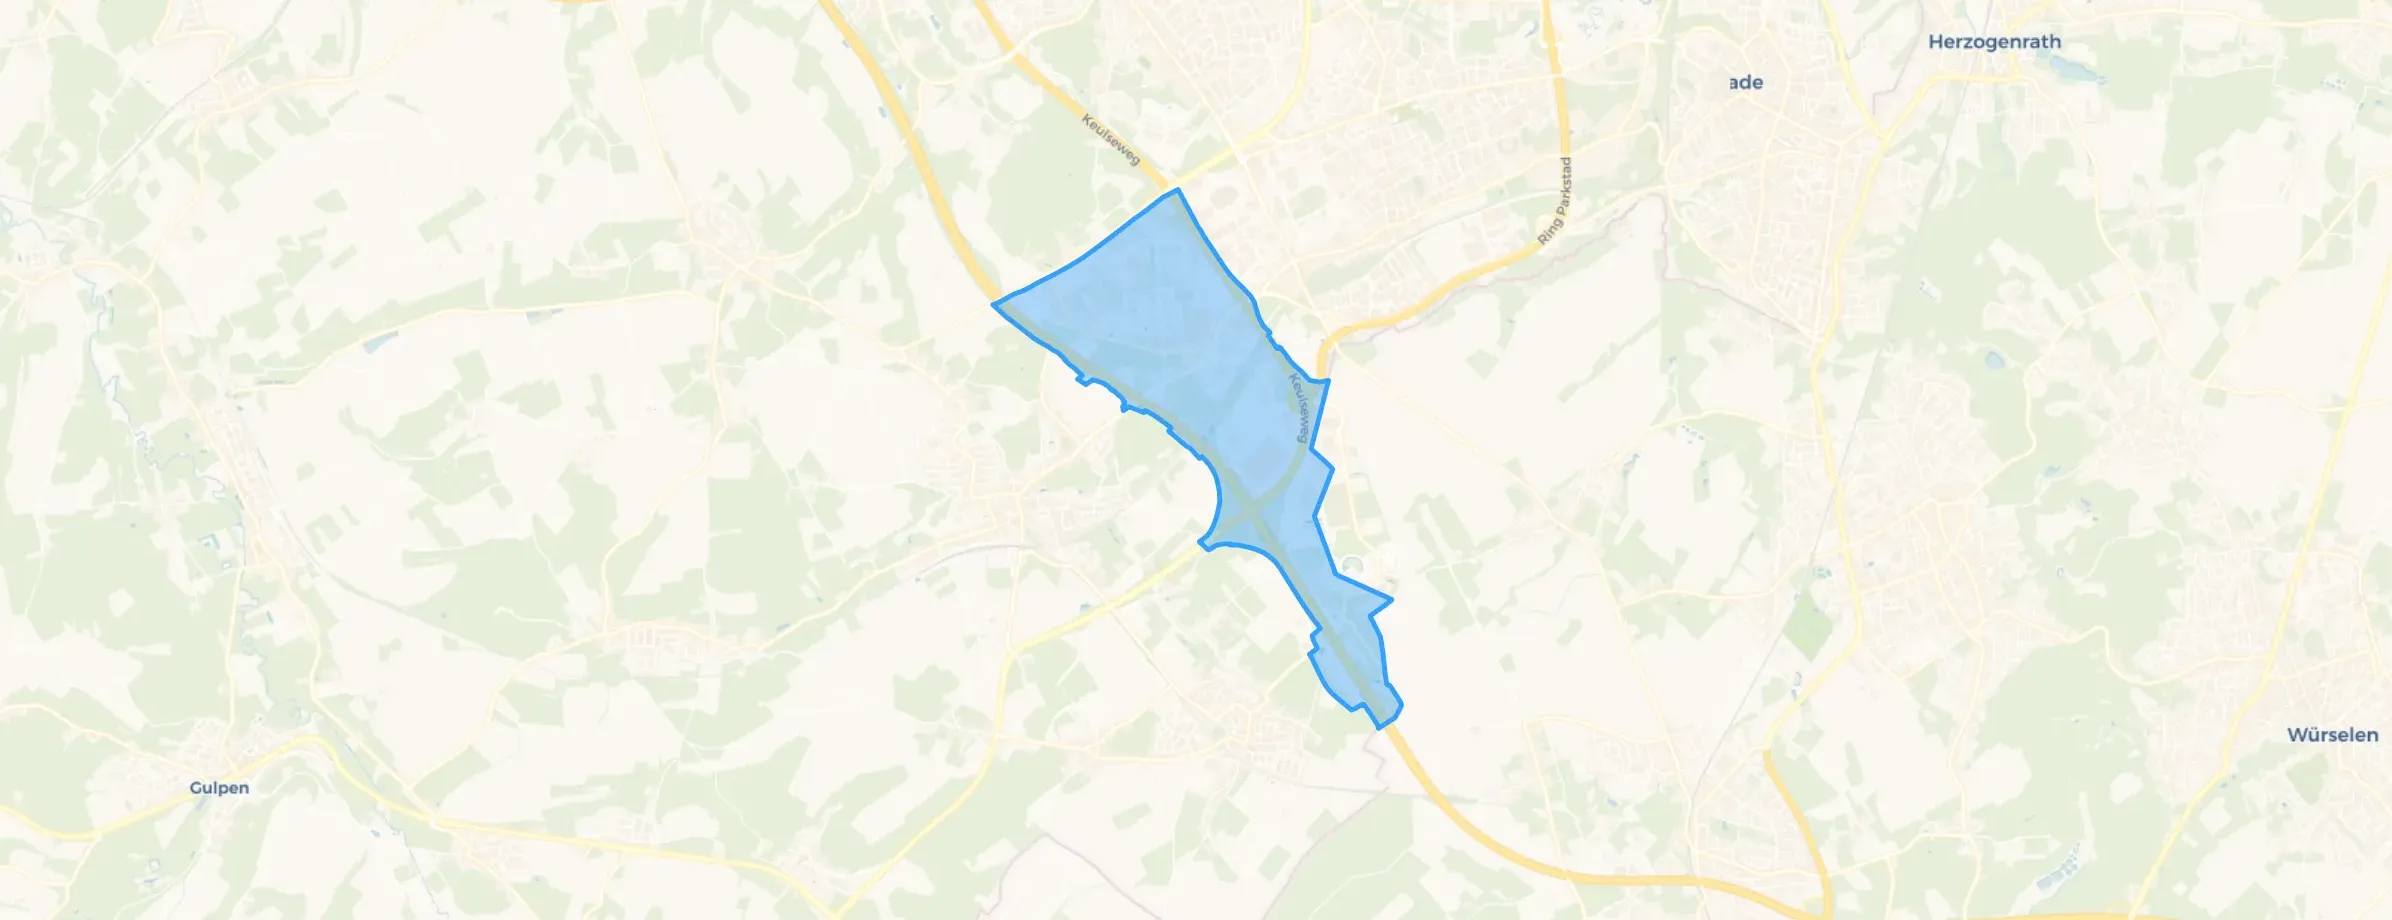
De Beitel is located in the province of Limburg, in the municipality of Heerlen. The district has a total area of 433 hectares, of which 433 hectares are land and 0 hectares are water. The district is coded as WK091742. The postcode area is 6422PA-6422RP.

Residents

De Beitel has 80 residents. Of these, 56,3% are men and 43,8% are women. Most residents are 45 to 65 years (37,5%). The other age groups are 18,8% for '25 to 45 years', 18,8% for '65 years or older', 12,5% for '0 to 15 years' and 12,5% for '15 to 25 years'. Of the residents, 31,3% is unmarried, 50,0% is married and 12,5% is divorced. 75 residents originate from the Netherlands, 5 come from Europe and 5 come from countries outside Europe.

There are 30 households in De Beitel. 33,3% of these are single-person households, 33,3% households without children and 33,3% households with children. The average household size is 2,3 persons. The national average is 2,1 persons.

In De Beitel there are 100 income recipients.

In De Beitel, 13% of residents receive a benefit. The largest group is those receiving a state pension (AOW). 10 people receive this benefit.

Housing

In De Beitel there are 29 homes with an average assessed value (WOZ) of €389.000. Of these, around 76% are occupied and 24% unoccupied. Most homes are owner-occupied. This amounts to 21% rental homes and 79% owner-occupied homes. Of the homes, 79% privately owned and 21% owned by other landlords. The most common construction periods in De Beitel are 1990-2000 (20%) and 2020 and later (20%).

Homes for sale in De Beitel

There are currently no homes for sale in De Beitel. No homes were sold in De Beitel over the past year.

Rental homes in De Beitel

There are currently no homes for rent in De Beitel. The most recent home is Beitel 112, offered by Wooncheckpunt Makelaars op Funda. No homes were let in De Beitel over the past year.

No recent rental data available for De Beitel.

Energy

In De Beitel there are 119 addresses with a registered energy label. The most common labels are G (35%), A (20%) and C (9%). On average, an address in De Beitel uses 4.220 kWh of electricity per year. This is 65% above the national average of 2.550 kWh. Natural gas consumption, at 1.380 m³ per year, is 73% above the national average of 800 m³.

Amenities

GP
2,2 km
Pharmacy
2,2 km
Hospital
4,5 km
Supermarket
1,7 km
Railway station
5,2 km
Day nursery
1,4 km
Primary school
2,4 km
Secondary school
5,0 km
Rate De Beitel

Share your opinion and help improve the neighbourhood.

  • Takes less than 2 minutes
  • Help home seekers
  • Improve your neighbourhood
Write a review

Neighbourhoods in De Beitel

Map of Beitel
BeitelNeighbourhood
–
De Beitel has no ratings yet
Ratings can be submitted via the button below
Write a review
Safety
Housing
Cleanliness
Amenities
Education
Community
Greenery
Accessibility

Statistics about the residents

Ages

Residents per age category

Household composition

Households per category
10Single-person households
10Households without children
10Households with children

Gender

Residents by gender
Men
Women

Marital status

Residents by marital status
Married
Unmarried
Divorced
Widowed

Origin

Residents per category of origin
Netherlands
Europe
Outside Europe

Work & income

Labour participation and average income
€0 P.A.average per resident
€0 P.A.average per income recipient
0%of the employed are in paid employment
0%of the employed are self-employed
0%
of the residents are employed
72%
is the national average

Education level

Residents per education level
VMBO, MBO 1
HAVO/VWO, MBO 2-4
HBO/WO

Wealth

Median wealth per household
De Beitel
Netherlands

Benefits

Residents per benefit type
Social assistance
Disability
Unemployment

Housing market in Heerlen

Figures for the municipality Heerlen due to limited data

Price trend for sale

Sale price per quarter · Q2 '25 – Q4 '26
Average
Median

Price trend for rent

Rent per quarter · Q2 '25 – Q4 '26
Average
Median

Sales market

Market speed and dynamics, last 12 months
77 days ▲ 10,0%
average time listed · vs. last year
1,304
sales in the past year
134 m²
average living area
-43%
cheaper than the national average

Rental market

Market speed and dynamics, last 12 months
43 days stabiel
average time listed · vs. last year
174
lettings in the past year
102 m²
average living area
-40%
cheaper than the national average

Year built

Age of the housing stock

Energy labels

Sustainability of the housing stock

Living area

Distribution of home sizes

Statistics about the homes

Home types

Addresses per home type

Construction periods

Addresses per construction period

Labels

Addresses per energy label

Energy consumption

Average per address, compared with the Netherlands
Natural gas (m³)
De Beitel
1.380
Netherlands
800
Electricity (kWh)
De Beitel
4.220
Netherlands
2.550

Frequently asked questions about De Beitel

What kind of homes are there in De Beitel?

The housing stock is mainly post-war — 69% was built between 1945 and 1990. In addition, the most common type is flats (41%).

What do you pay for a house in De Beitel?

Over the past year a home for sale in De Beitel was listed for an average of €298,171 (€2,444 per m²). That is 43% below the Dutch national average.

What do you pay for a rental home in De Beitel?

A rental home in De Beitel cost an average of €1,123 per month (€13 per m²). That is 40% below the national average.

Which amenities are close to De Beitel?

From De Beitel you can on average reach a supermarket at 1.7 km, a GP at 2.2 km, a railway station at 5.2 km, a primary school at 2.4 km (as the crow flies, source: CBS).

Homes Rate your neighbourhood
Buurtje.nl
Buurtje.nl in the appSearch faster and respond first
Open