District in Tilburg
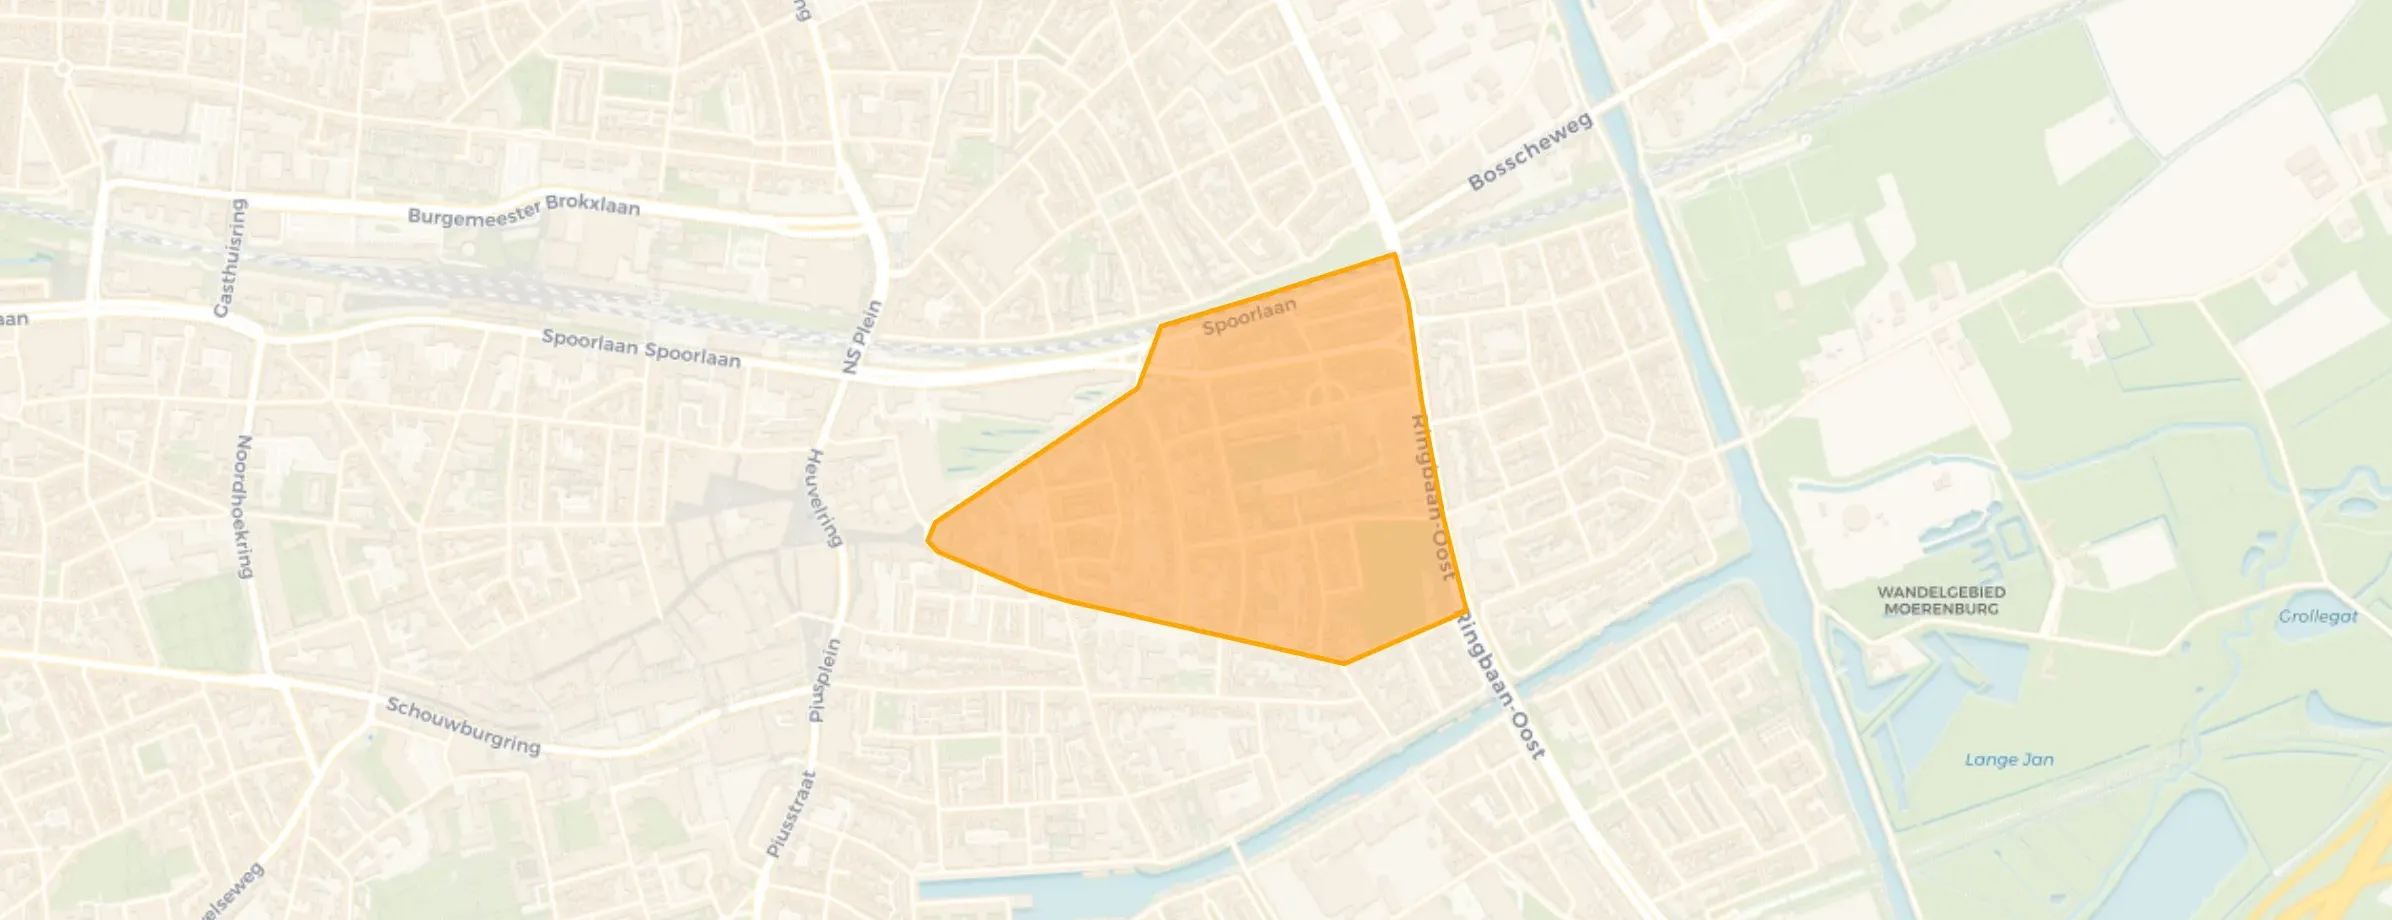
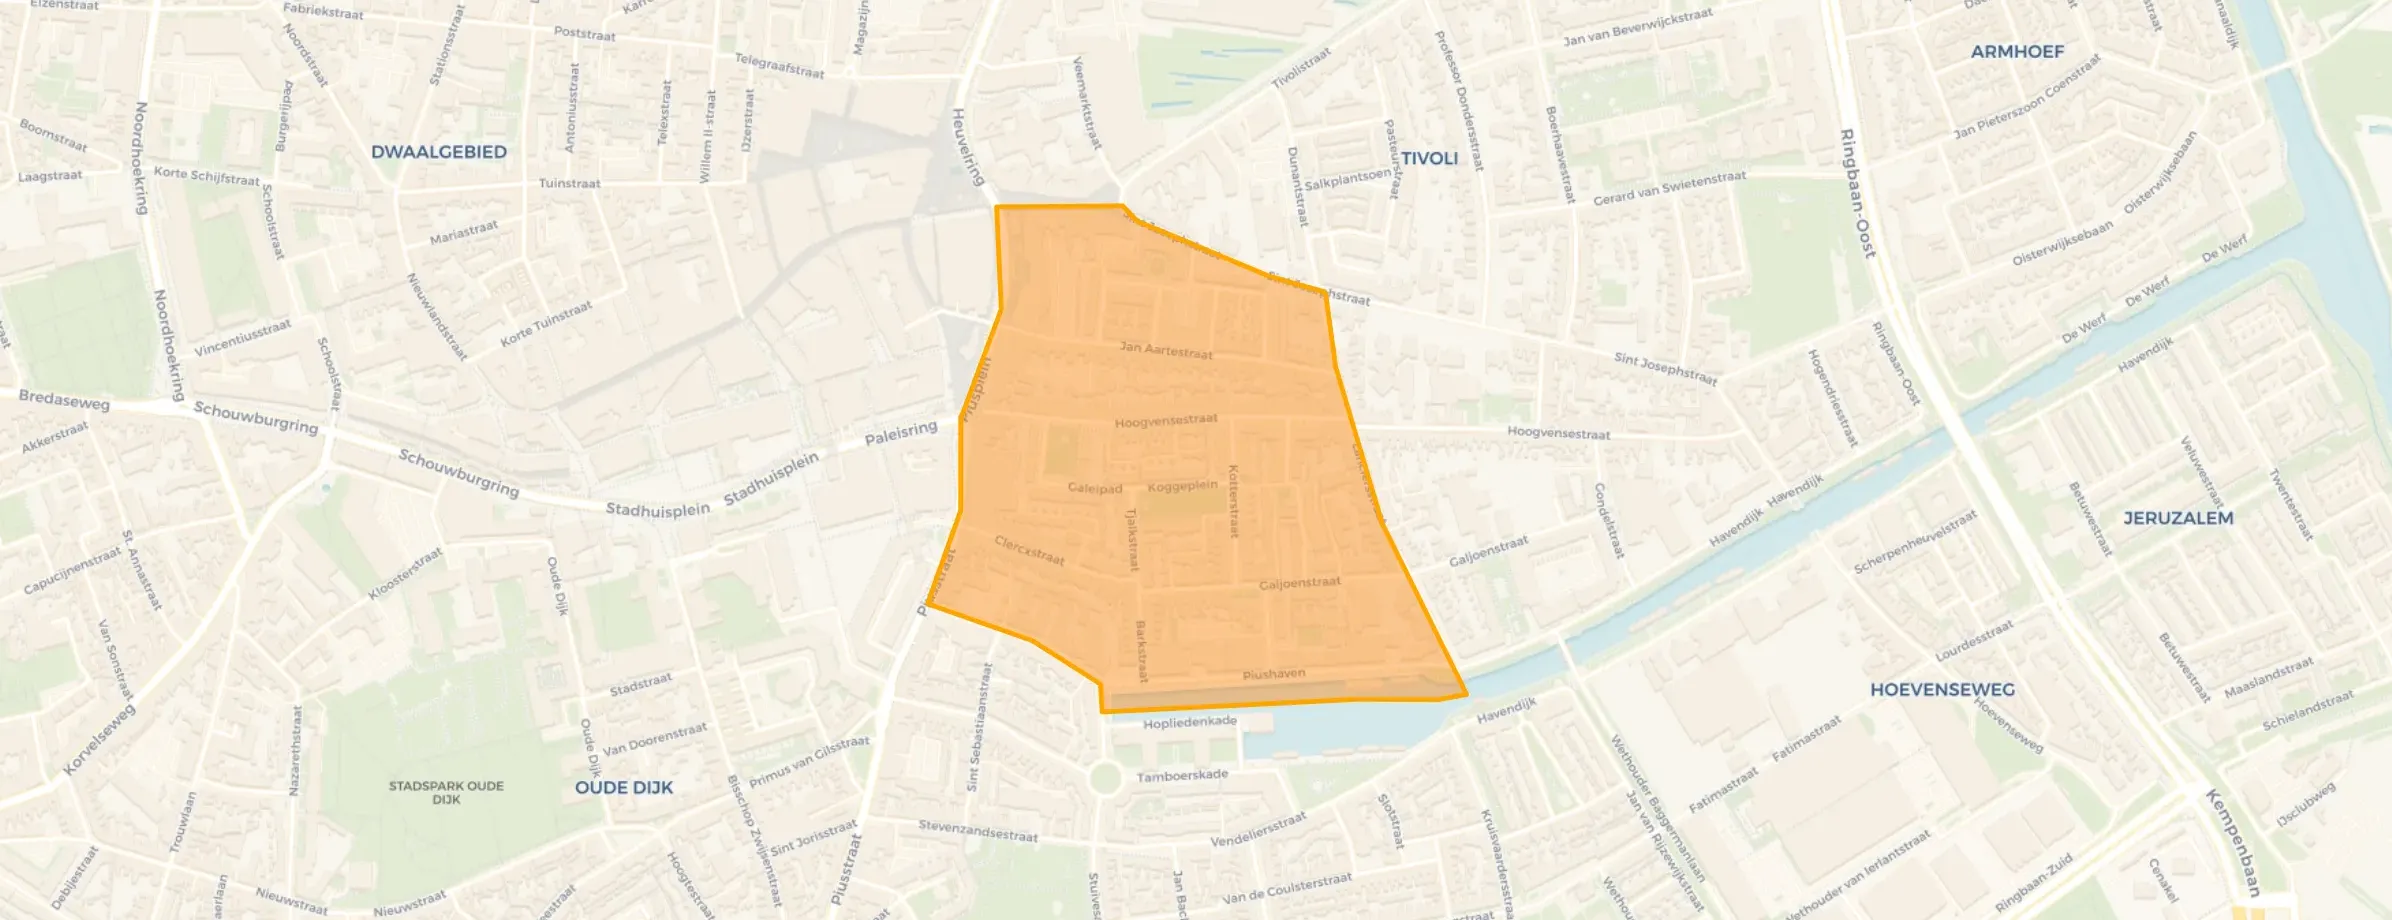
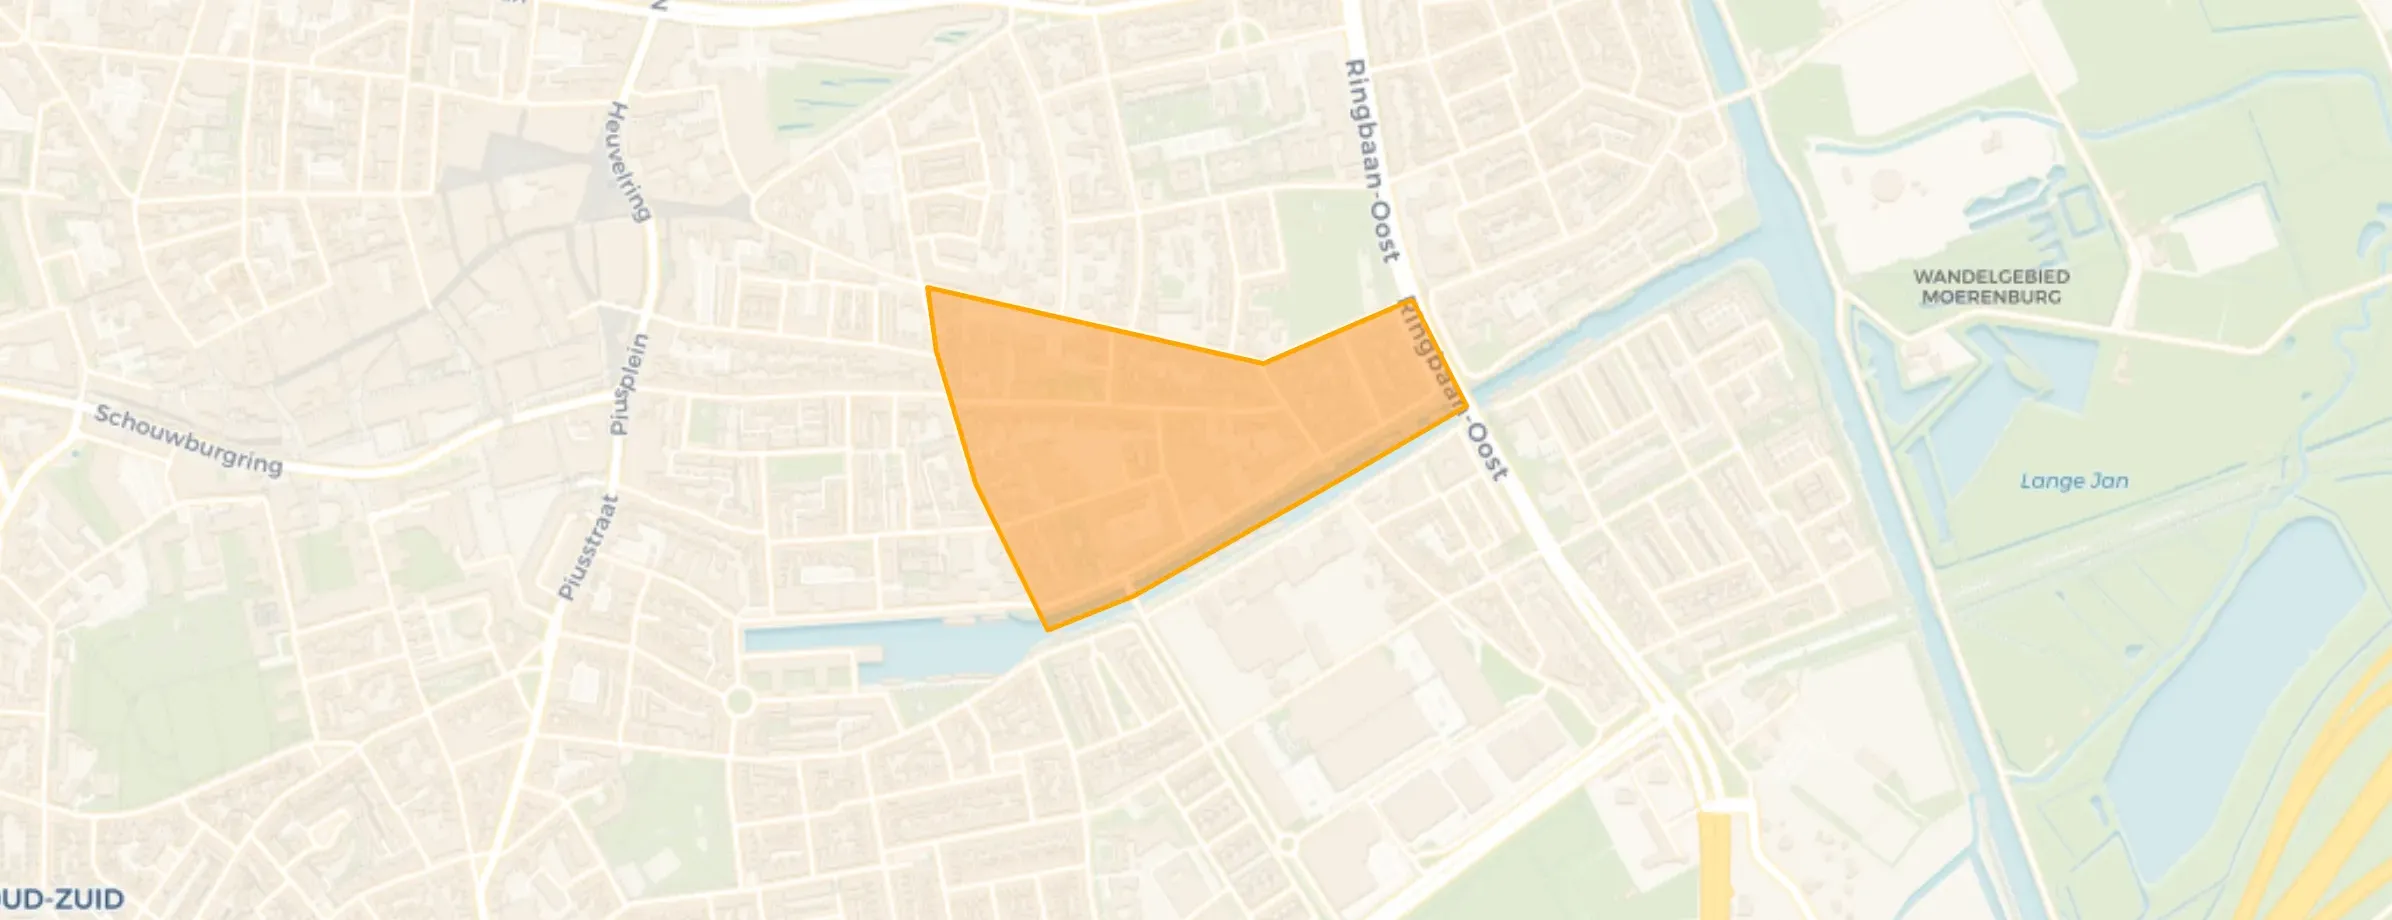
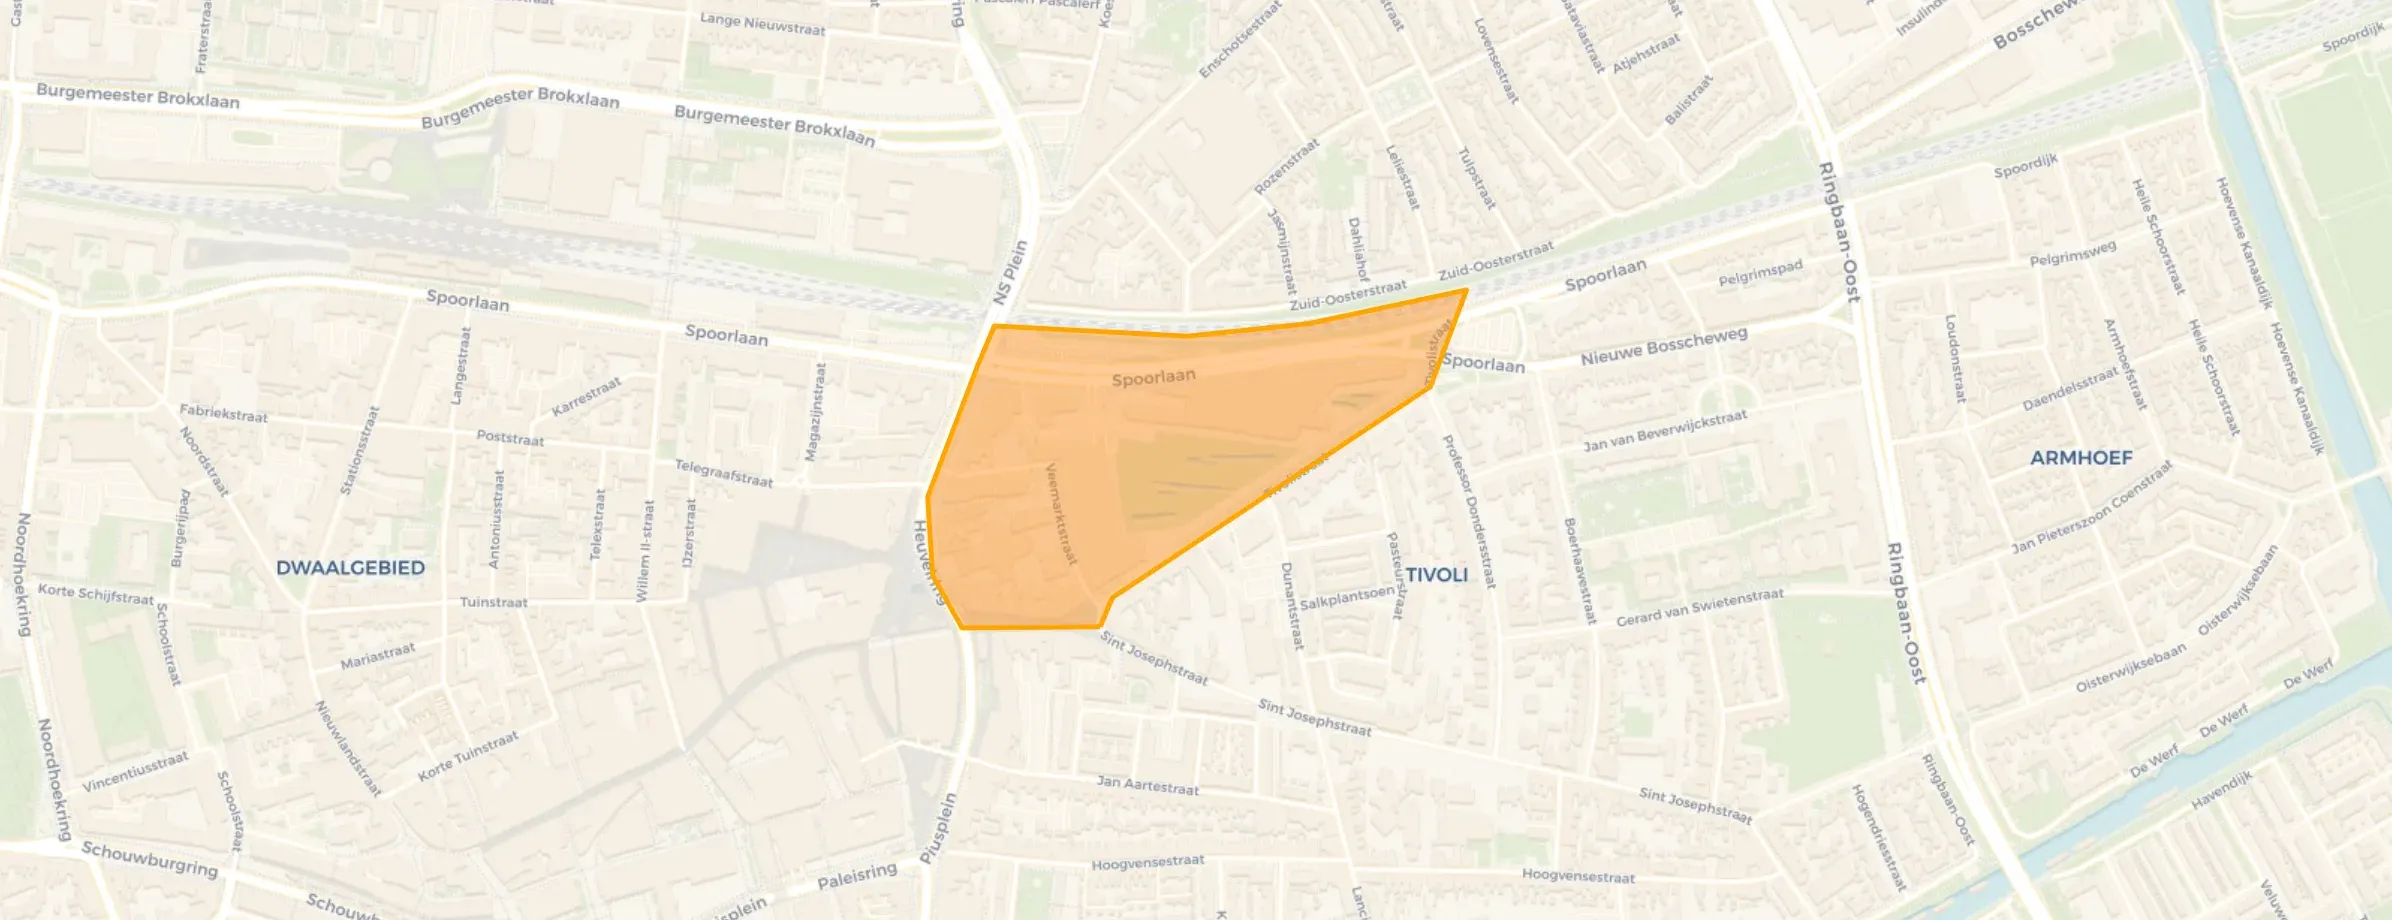
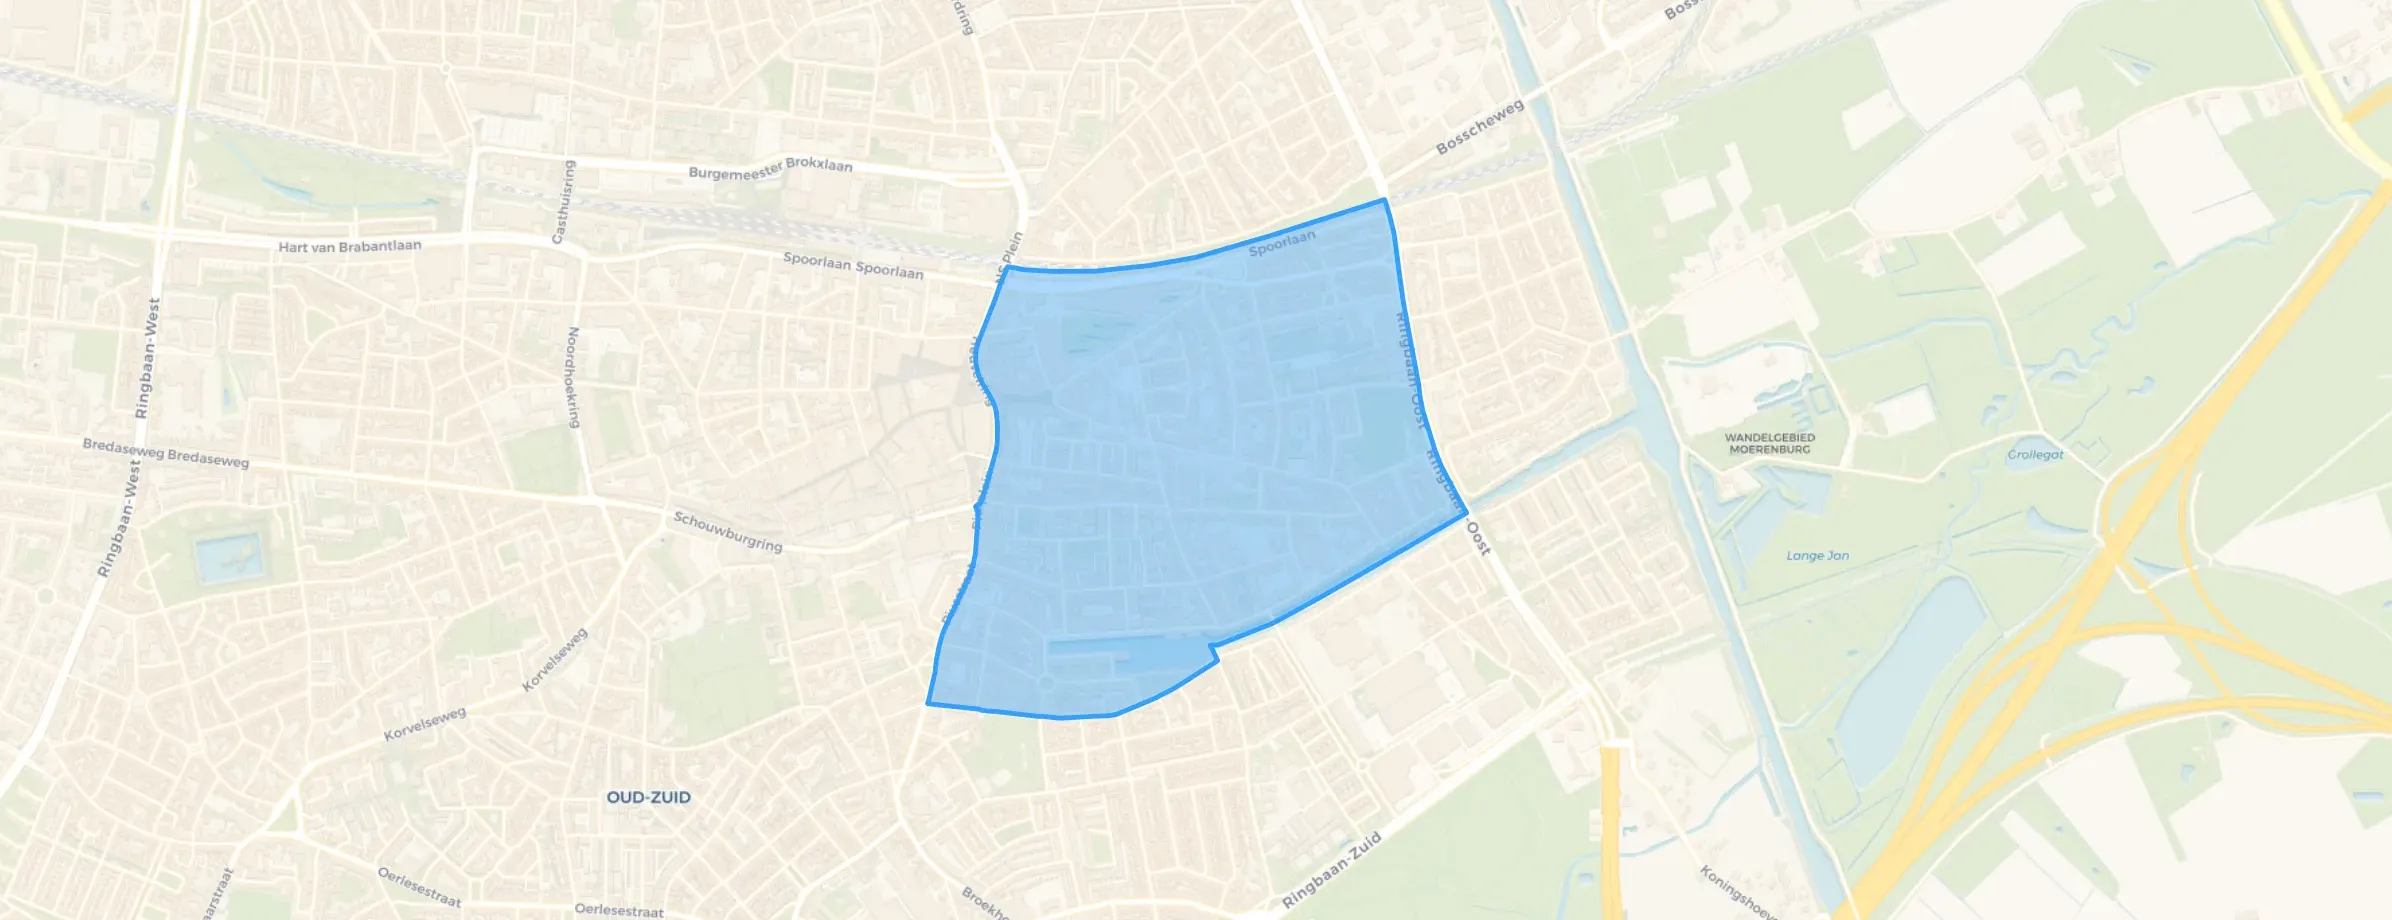
Hoogvenne is located in the province of Noord-Brabant, in the municipality of Tilburg The district has a total area of 89 hectares, of which 86 hectares are land and 3 hectares are water. The district is coded as WK085511. The postcode area is 5017AA-5038WT.
Hoogvenne has 6.160 residents. Of these, 49,2% are men and 50,8% are women. Most residents are 25 to 45 years (29,6%). The other age groups are 23,5% for '45 to 65 years', 21,5% for '65 years or older', 15,3% for '15 to 25 years' and 10,1% for '0 to 15 years'. Of the residents, 58,2% is unmarried, 28,8% is married, 8,4% is divorced and 4,5% is widowed. 4.820 residents originate from the Netherlands, 570 come from Europe and 765 come from countries outside Europe.
There are 3.600 households in Hoogvenne. 55,8% of these are single-person households, 26,4% households without children and 17,8% households with children. The average household size is 1,7 persons. The national average is 2,1 persons.
In Hoogvenne there are 5.400 income recipients. The average income per income recipient is €43.200, which is €1.000 (2%) higher than the national average of €42.200. Per resident, the average income is €38.400, which is €3.500 (10%) higher than the national average of €34.900. Most residents of Hoogvenne are highly educated. 52,2% have a university or higher professional education (HBO/WO), 33,7% have an intermediate education (HAVO, VWO or MBO 2-4) and 14,1% have a lower education (VMBO or MBO 1).
Of the 6.160 residents, around 73% are in paid employment, which amounts to 4.497 people. This is 1% higher than the national average of 72%. The majority of workers are in salaried employment (83%), while 17% are self-employed. In Hoogvenne, 26% of residents receive a benefit. The largest group is those receiving a state pension (AOW). 1.200 people receive this benefit.
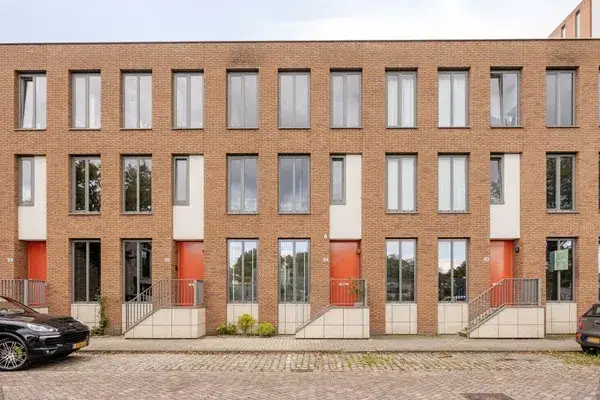
In Hoogvenne there are 3.336 homes with an average assessed value (WOZ) of €379.000. Of these, around 96% are occupied and 4% unoccupied. In Hoogvenne there are roughly as many rental as owner-occupied homes. Of the homes, 50% privately owned, 23% owned by housing associations and 27% owned by other landlords. The most common construction periods in Hoogvenne are 1980-1990 (28%) and 1925-1950 (14%).
There are currently no homes for sale in Hoogvenne. The most recently listed home is Panhuijsenpad 43 by Van de Water Makelaars Tilburg. No homes were sold in Hoogvenne over the past year.
There are currently no homes for rent in Hoogvenne. The most recent home is Carré 147, offered by www.woninginzicht.nl. No homes were let in Hoogvenne over the past year.
No recent rental data available for Hoogvenne.
In Hoogvenne there are 2.719 addresses with a registered energy label. The most common labels are A (31%), C (19%) and B (16%). On average, an address in Hoogvenne uses 2.230 kWh of electricity per year. This is 13% below the national average of 2.550 kWh. With an annual consumption of 750 m³ per address, natural gas consumption is 6% below the national average of 800 m³.
Met genoeg voorzieningen op 200 meter aan de ene kant in de stad (zonder daar last van te hebben). Heb je aan de andere kant op 300 meter een heel mooi groen natuurgebied. De wijk is zelf ook heel groen en heel netjes met amper straatafval. Via de snelweg kun je er in 3 minuten komen aangezien de straat aan de ringbaan-oost ligt.
Auto-translated to English by AII have never experienced anything unpleasant in this neighbourhood. Not even in the evening.
Auto-translated to English by AICould be better in terms of sociability
Auto-translated to English by AII cycle there daily and find it fine, lots of nightlife traffic and in the evenings I often hear bangs or fireworks but I don't know how close that actually is. overall a decent neighbourhood with many trees and beautiful houses.
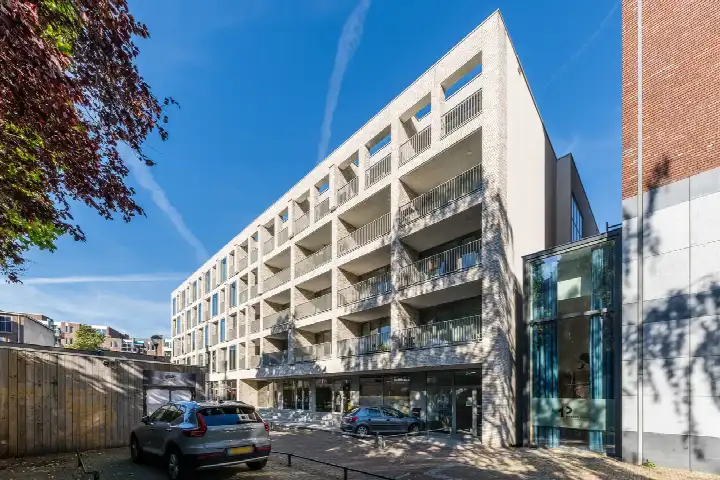
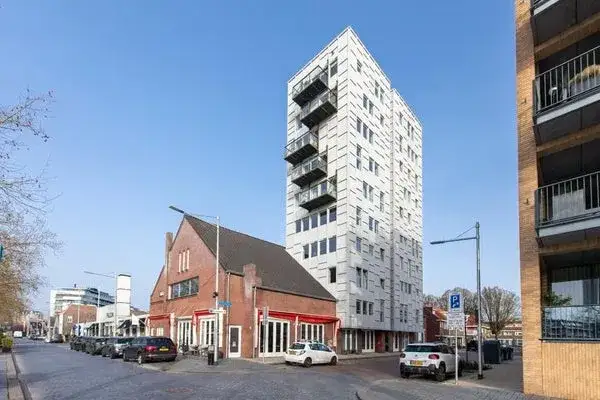
Auto-translated to English by AIThe most common type is flats (51%).
Over the past year a home for sale in Hoogvenne was listed for an average of €508,829 (€5,142 per m²). Last quarter prices rose by 5%.
A rental home in Hoogvenne cost an average of €1,425 per month (€18 per m²). That is 34% below the national average.
Residents give Hoogvenne a 7.8 out of 10 based on 4 reviews. Accessibility stands out with a 9.0; community lags behind with a 6.5.
Wijk Hoogvenne has 6,160 residents. The largest age group is 25 to 45 years (30%). Notably, 56% of the households are single-person households.
The housing supply in Hoogvenne is remarkably efficient: 55% has an A, A+ or B label. The average natural gas consumption per household is 750 m³ per year.
From Hoogvenne you can on average reach a supermarket at 0.9 km, a GP at 0.7 km, a railway station at 2.6 km, a primary school at 0.5 km (as the crow flies, source: CBS).
Right now you will find 38 homes for sale and 9 homes for rent in Hoogvenne.