District in Oss
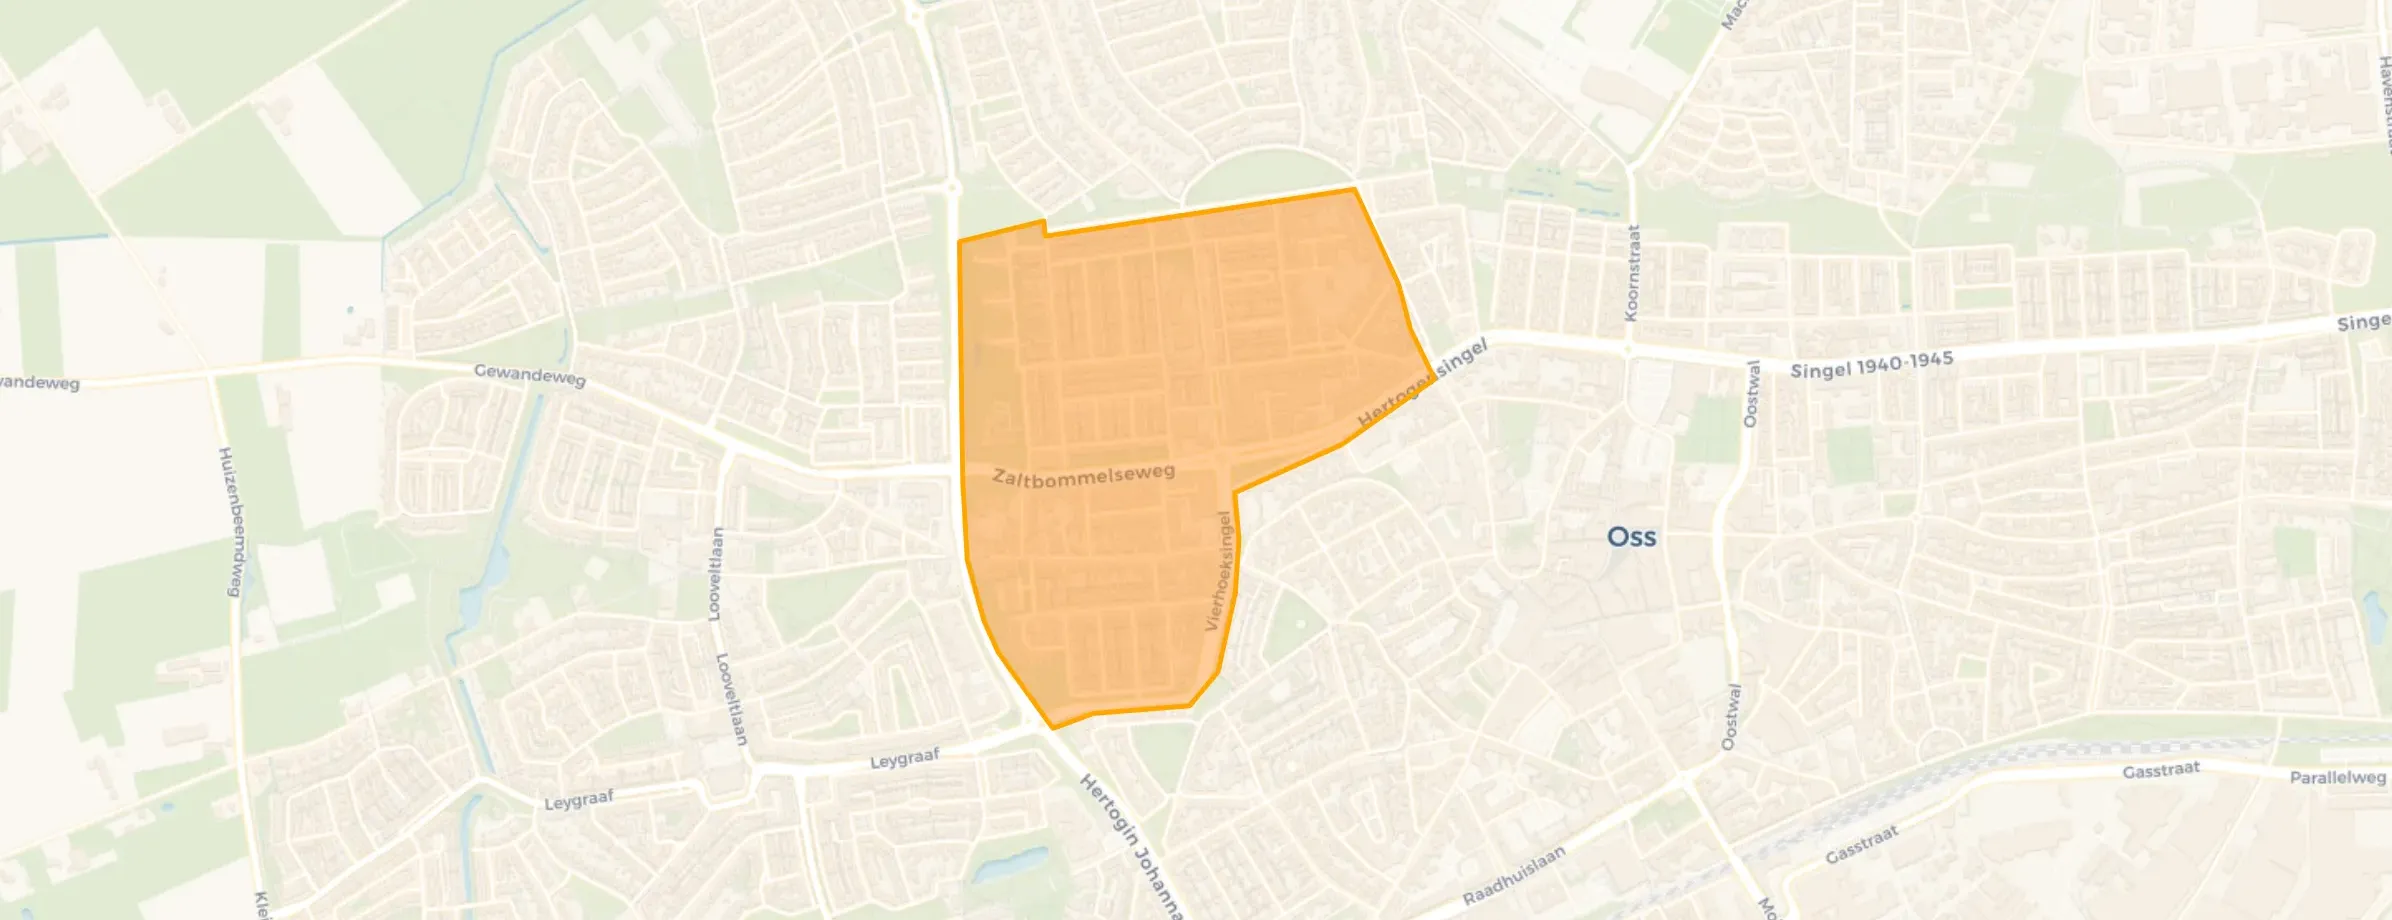
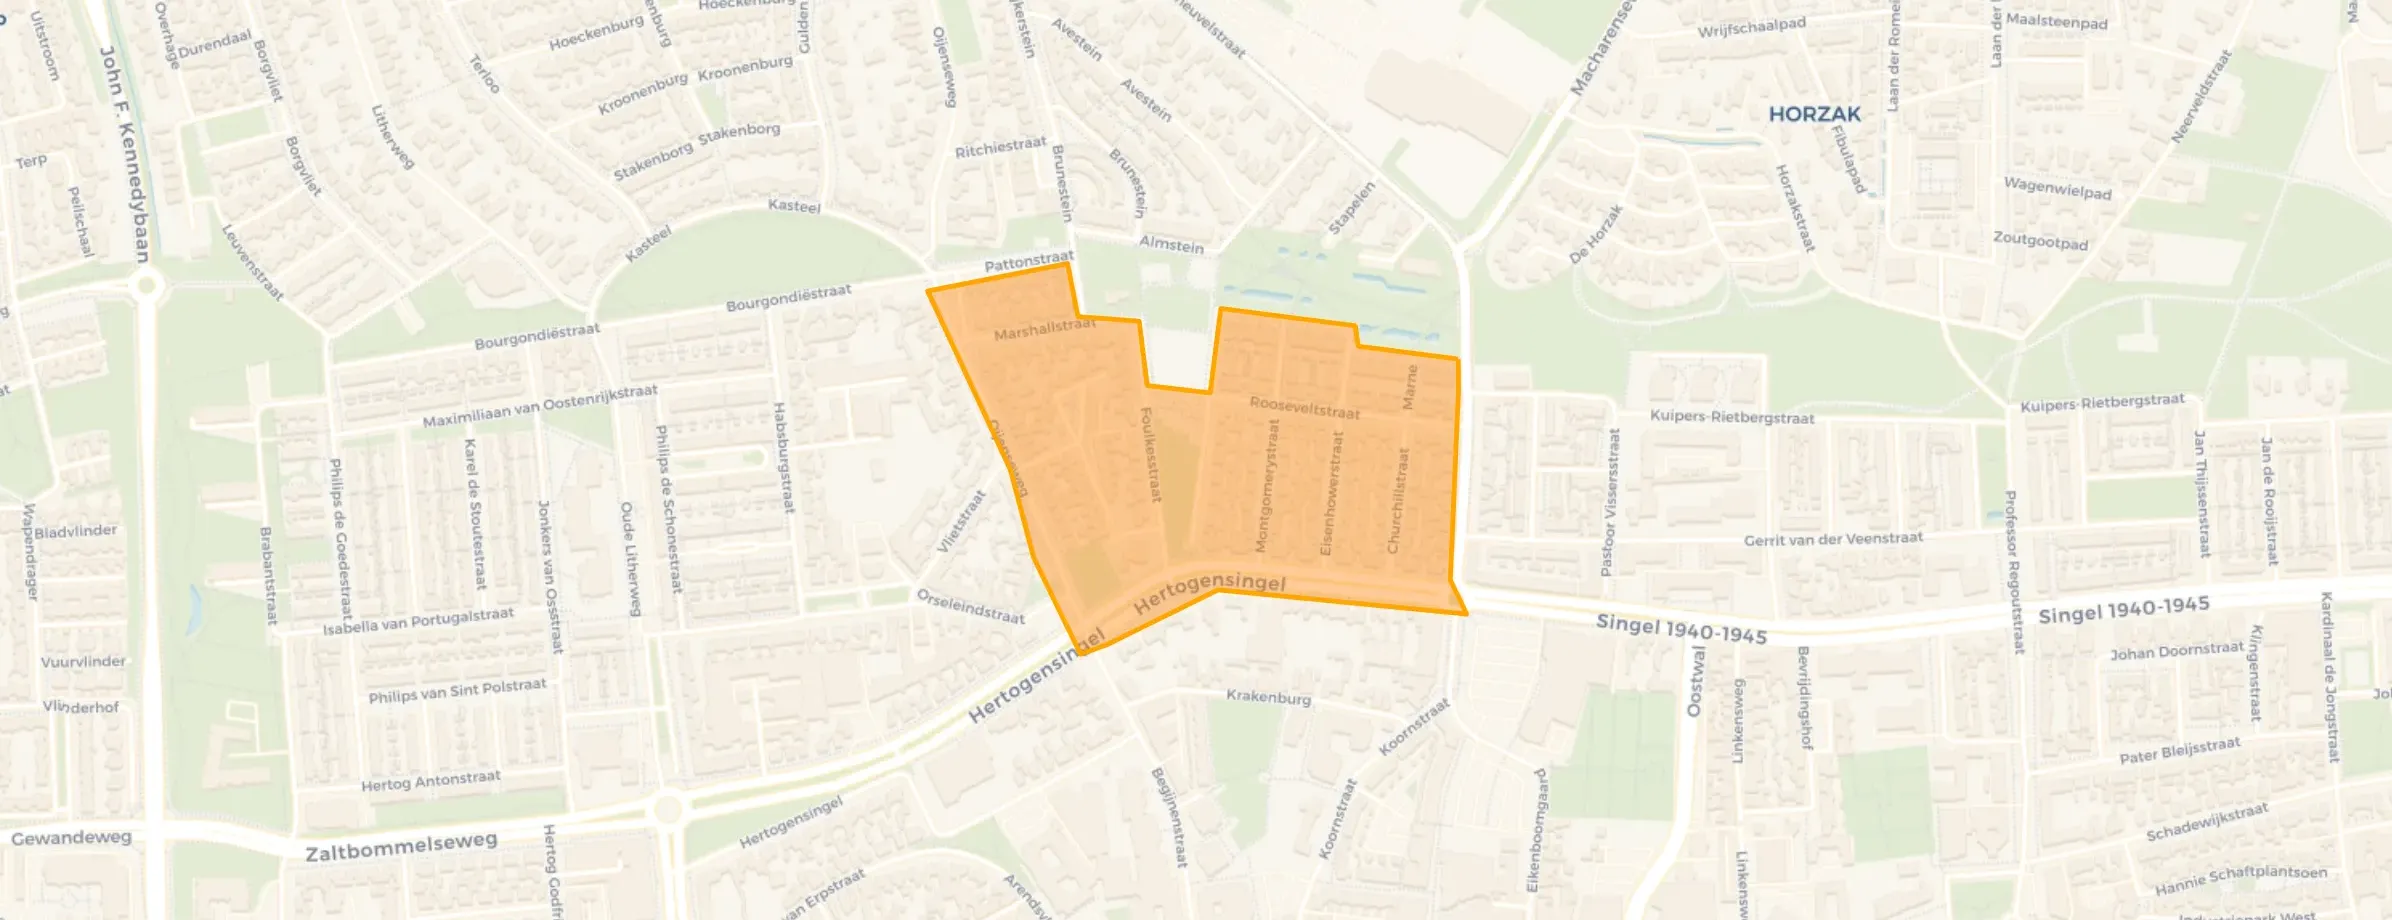
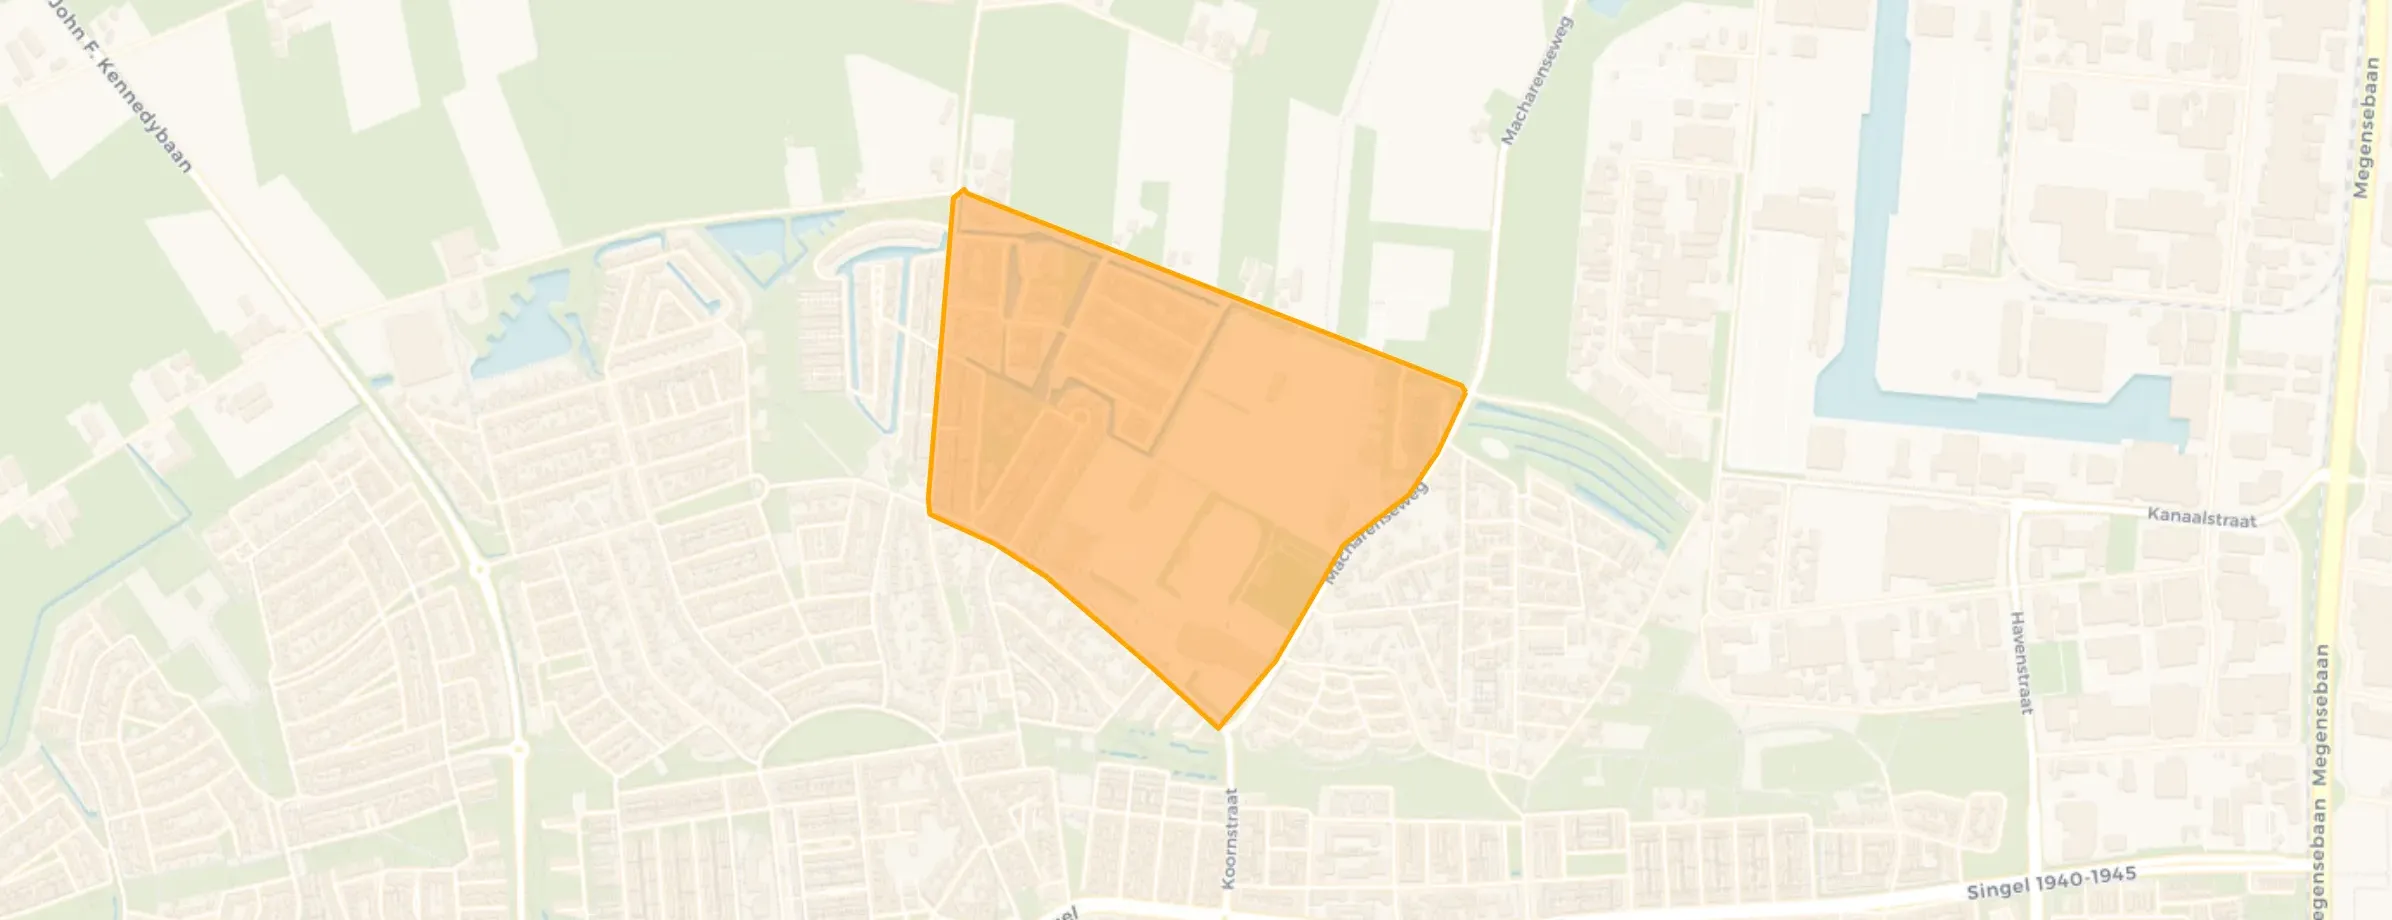
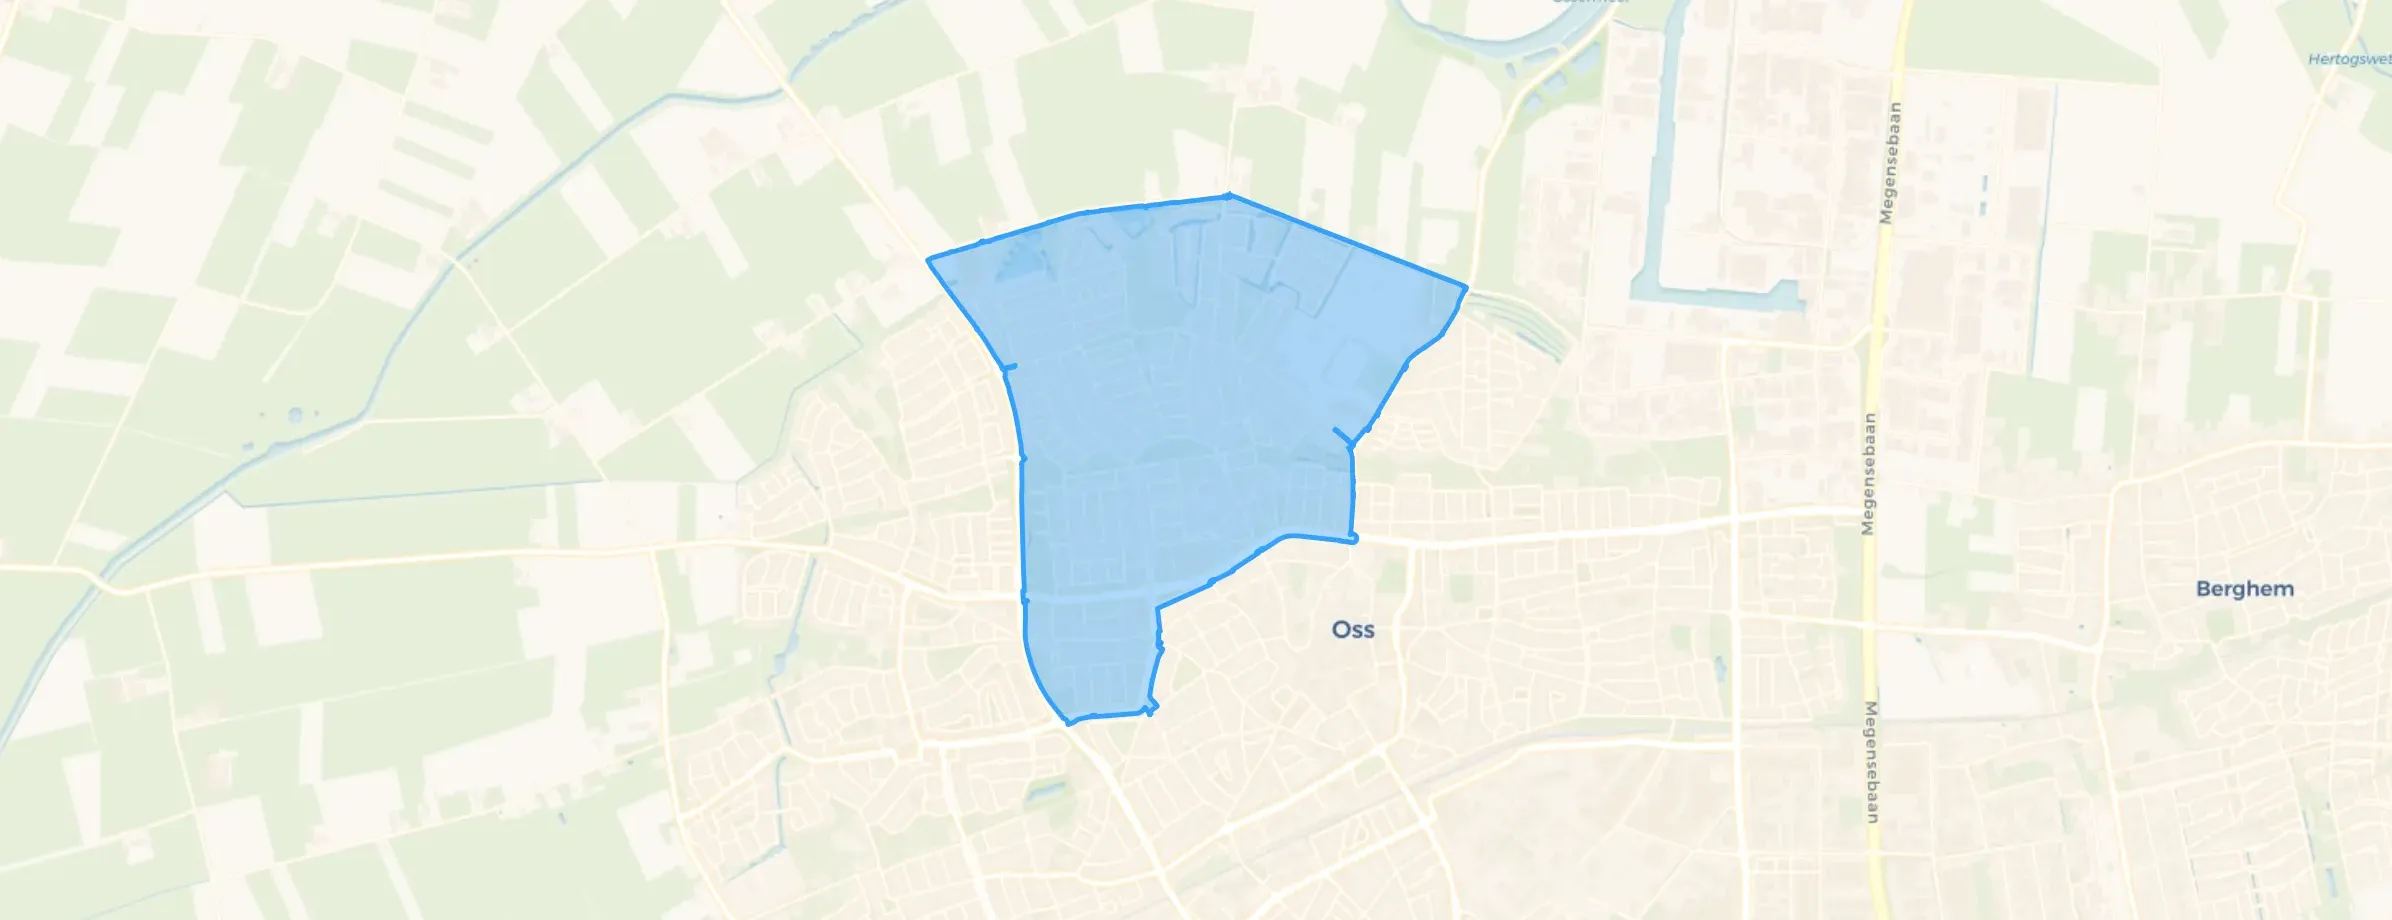
Krinkelhoek is located in the province of Noord-Brabant, in the municipality of Oss The district has a total area of 202 hectares, of which 199 hectares are land and 3 hectares are water. The district is coded as WK082804. The postcode area is 5341AA-5346XJ.
Krinkelhoek has 8.655 residents. Of these, 49,8% are men and 50,3% are women. Most residents are 45 to 65 years (29,4%). The other age groups are 27,1% for '25 to 45 years', 15,7% for '0 to 15 years', 15,2% for '65 years or older' and 12,7% for '15 to 25 years'. Of the residents, 50,0% is unmarried, 39,5% is married, 7,1% is divorced and 3,4% is widowed. 6.575 residents originate from the Netherlands, 630 come from Europe and 1.450 come from countries outside Europe.
There are 3.705 households in Krinkelhoek. 30,0% of these are single-person households, 29,1% households without children and 40,9% households with children. The average household size is 2,3 persons. The national average is 2,1 persons.
In Krinkelhoek there are 7.100 income recipients. The average income per income recipient is €41.300, which is €900 (2%) lower than the national average of €42.200. Per resident, the average income is €34.200, which is €700 (2%) lower than the national average of €34.900. Most residents of Krinkelhoek are educated to an intermediate level. 43,6% have an intermediate education (HAVO, VWO or MBO 2-4), 30,8% have a university or higher professional education (HBO/WO) and 25,6% have a lower education (VMBO or MBO 1).
Of the 8.655 residents, around 75% are in paid employment, which amounts to 6.491 people. This is 3% higher than the national average of 72%. The majority of workers are in salaried employment (86%), while 14% are self-employed. In Krinkelhoek, 23% of residents receive a benefit. The largest group is those receiving a state pension (AOW). 1.170 people receive this benefit.
In Krinkelhoek there are 3.604 homes with an average assessed value (WOZ) of €390.000. Of these, around 99% are occupied and 1% unoccupied. Most homes are owner-occupied. This amounts to 30% rental homes and 70% owner-occupied homes. Of the homes, 70% privately owned, 24% owned by housing associations and 6% owned by other landlords. The most common construction periods in Krinkelhoek are 1950-1970 (36%) and 1990-2000 (35%).
There are currently no homes for sale in Krinkelhoek. The most recently listed home is Philips de Goedestraat 49 by Van der Krabben Makelaardij Uden. No homes were sold in Krinkelhoek over the past year.
There are currently no homes for rent in Krinkelhoek. The most recent home is Oude Litherweg 65, offered by www.thuispoort.nl. No homes were let in Krinkelhoek over the past year.
No recent rental data available for Krinkelhoek.
In Krinkelhoek there are 2.322 addresses with a registered energy label. The most common labels are A (38%), B (23%) and C (14%). On average, an address in Krinkelhoek uses 2.960 kWh of electricity per year. This is 16% above the national average of 2.550 kWh. Natural gas consumption, at 830 m³ per year, is 4% above the national average of 800 m³.
The togetherness in the apartment is great and I get along with most neighbours, except for a few whiners... But the surroundings, the neighbourhood, are less pleasant: drug dealers and users, youths on fatbikes, cyclists riding on the pavement where you walk your dog, and a lot of rubbish and junk at the underground bins are the order of the day. But if you walk a little further, there is a beautiful green area with a survival trail for children, although I've never seen a child do it, it is there, but certainly nice for walking too and a nice off-leash area for dogs, nothing to complain about on that point. But on the street itself, it's a filthy mess, with all that rubbish at the underground bins, including household waste (plastic waste from people who were too late putting it out and then left it standing) but also furniture because the thrift shop no longer collects everything or does so but for a fee that people don't want or can't pay (previously it was free here). That means the underground bins usually become a large dumping ground: if one thing is there, the next person just adds to it, and so the pile grows bigger and bigger...
Auto-translated to English by AIOur neighbourhood is very cosy and helpful; if something is needed, you can easily ask your neighbours.
Auto-translated to English by AIMy experience is positive, because everyone is respectful and sociable with each other
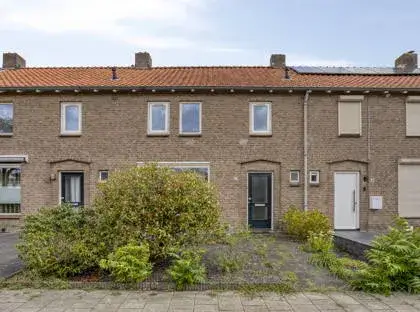
Auto-translated to English by AIThe housing stock is relatively young — 68% dates from after 1990. In addition, the most common type is terraced houses (42%).
Over the past year a home for sale in Krinkelhoek was listed for an average of €487,389 (€3,735 per m²).
A rental home in Krinkelhoek cost an average of €1,268 per month (€13 per m²). That is 41% below the national average.
Residents give Krinkelhoek a 7.5 out of 10 based on 3 reviews. The strongest score is for accessibility (9.0), the weakest for cleanliness (6.0).
Wijk Krinkelhoek has 8,655 residents. Many families: 41% of the households have children.
The housing supply in Krinkelhoek is remarkably efficient: 77% has an A, A+ or B label. The average natural gas consumption per household is 830 m³ per year.
From Krinkelhoek you can on average reach a supermarket at 1.0 km, a GP at 1.7 km, a railway station at 2.1 km, a primary school at 0.5 km (as the crow flies, source: CBS).
Right now you will find 30 homes for sale and 1 homes for rent in Krinkelhoek.