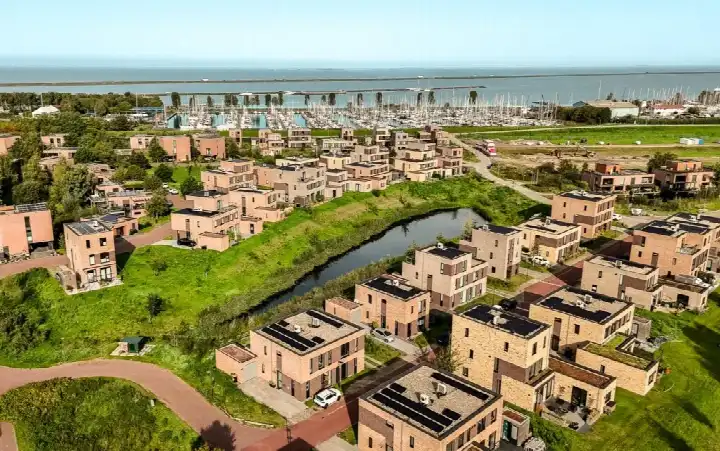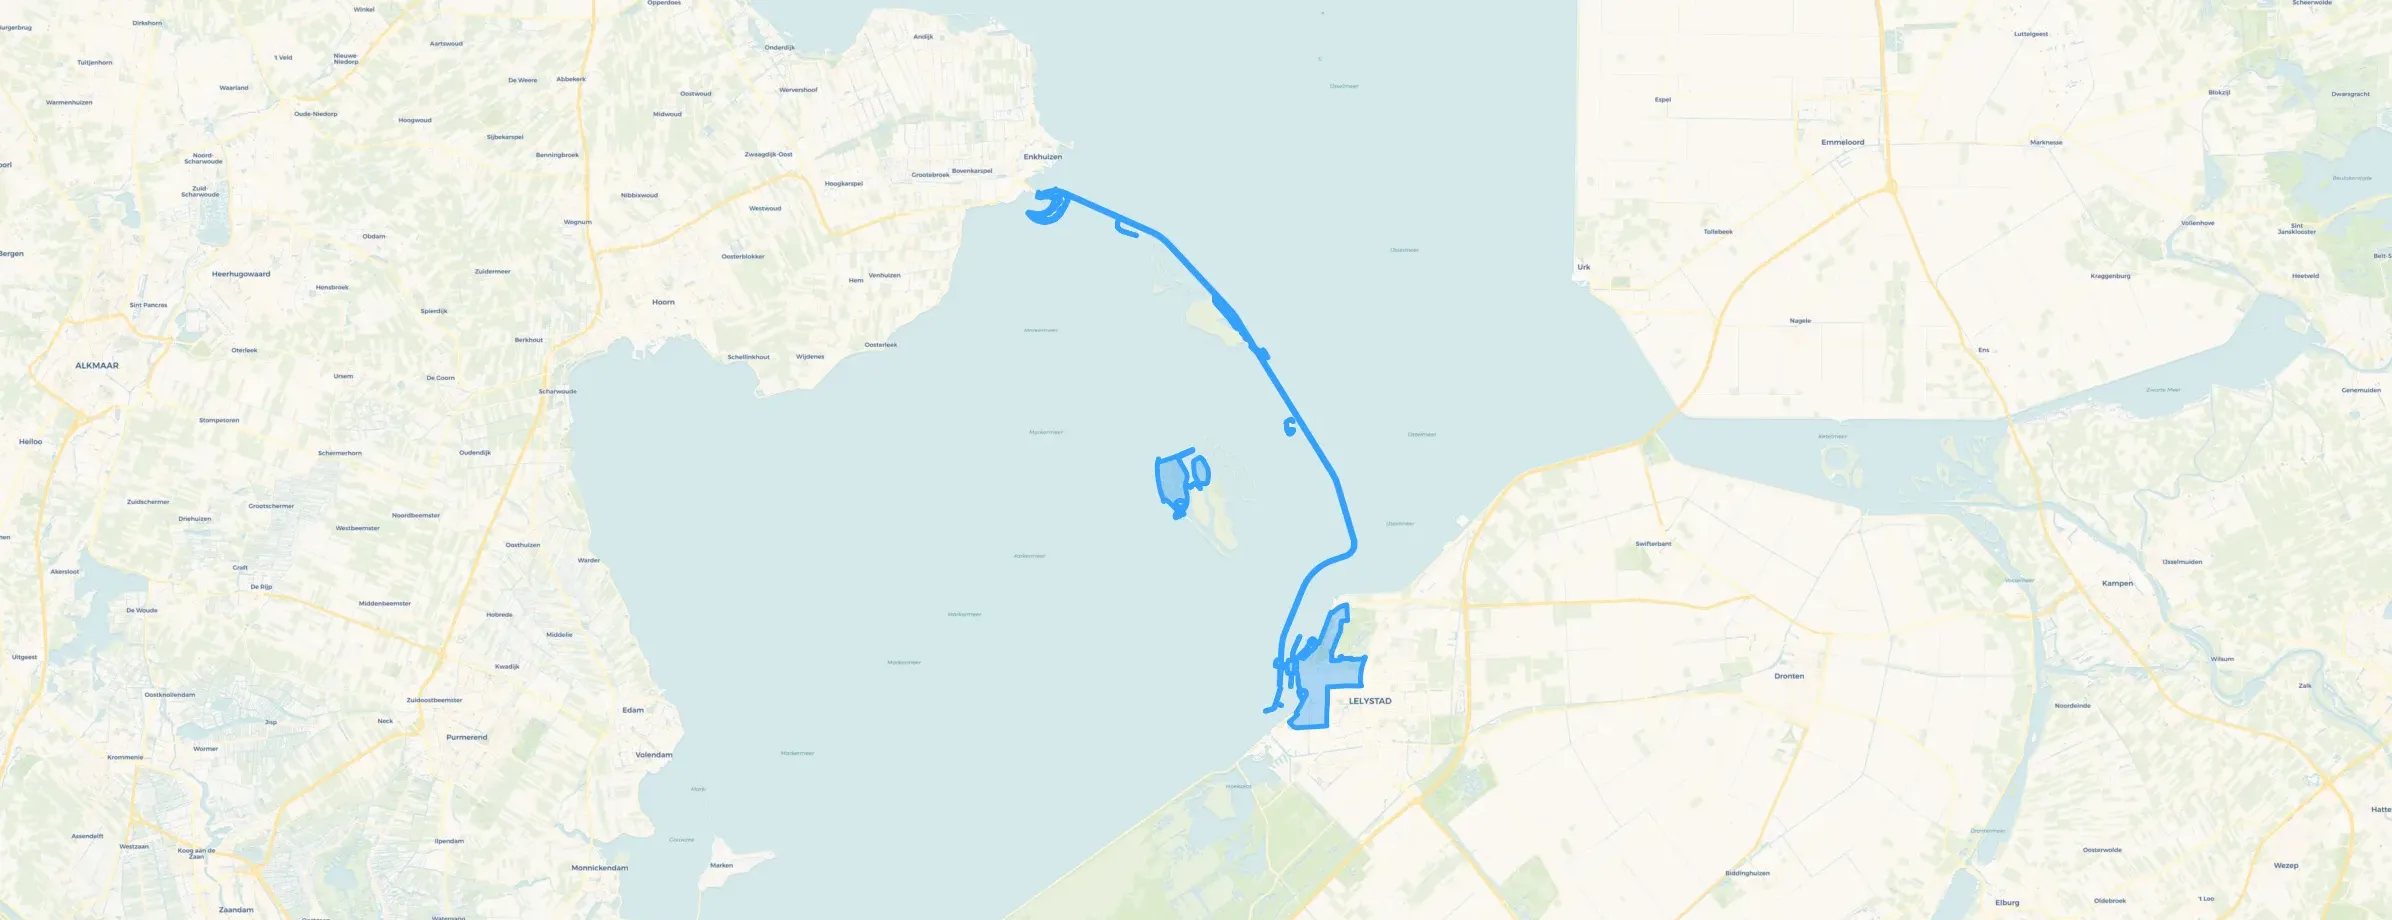
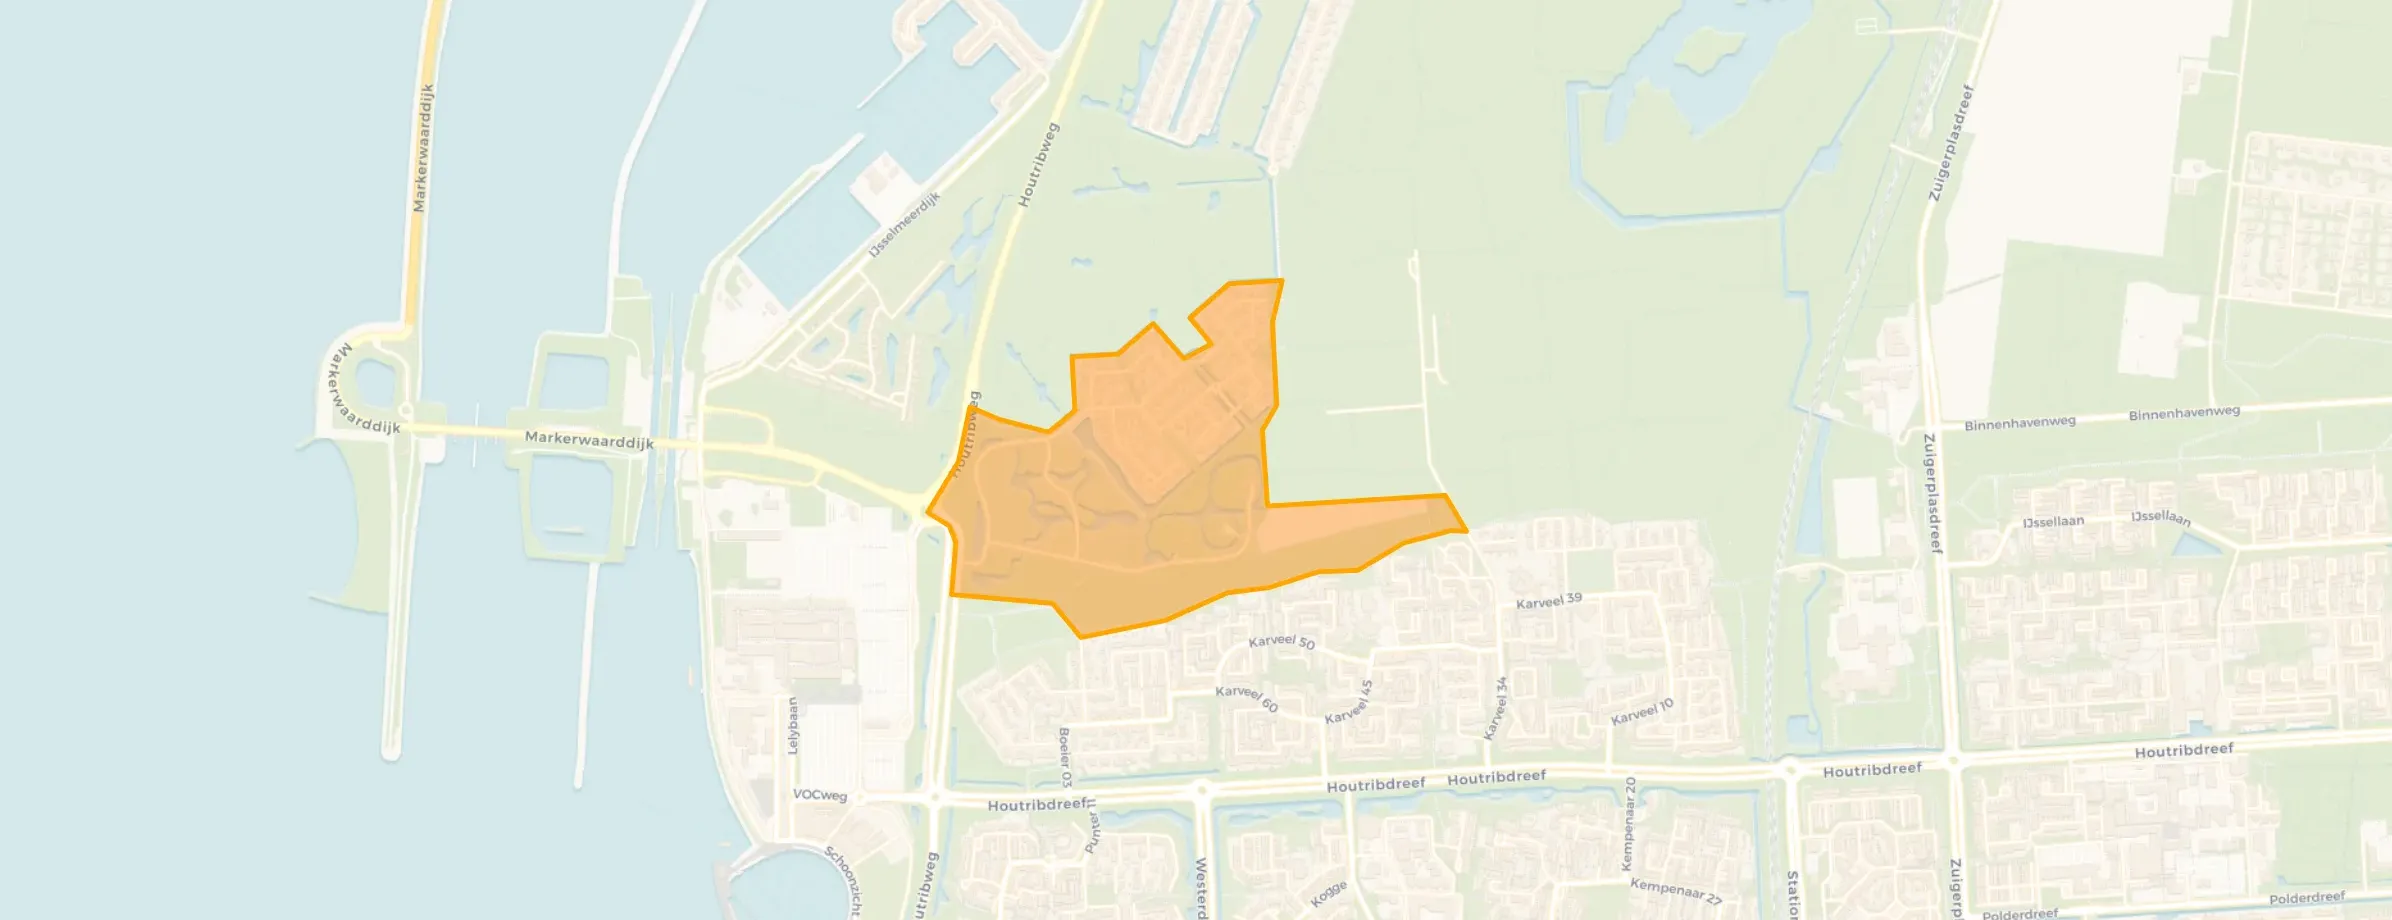
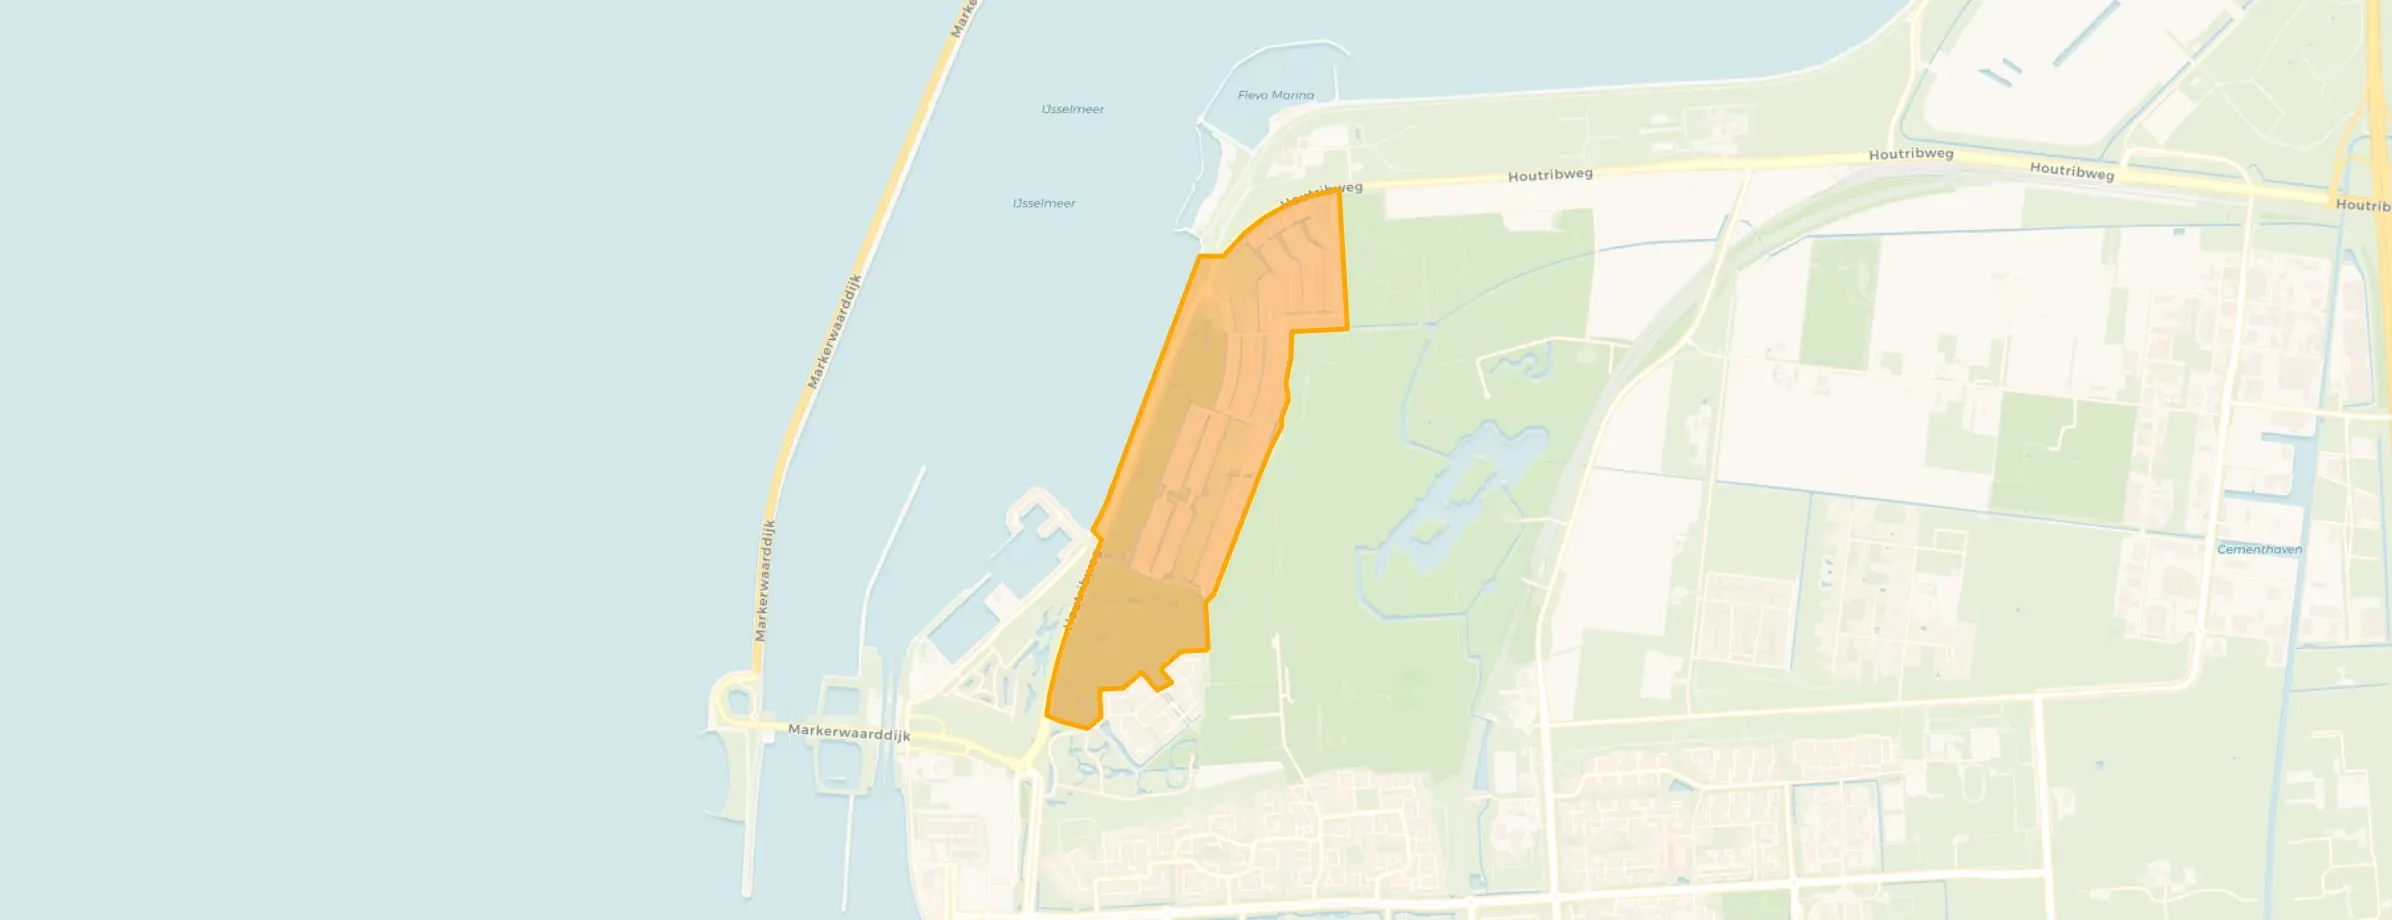
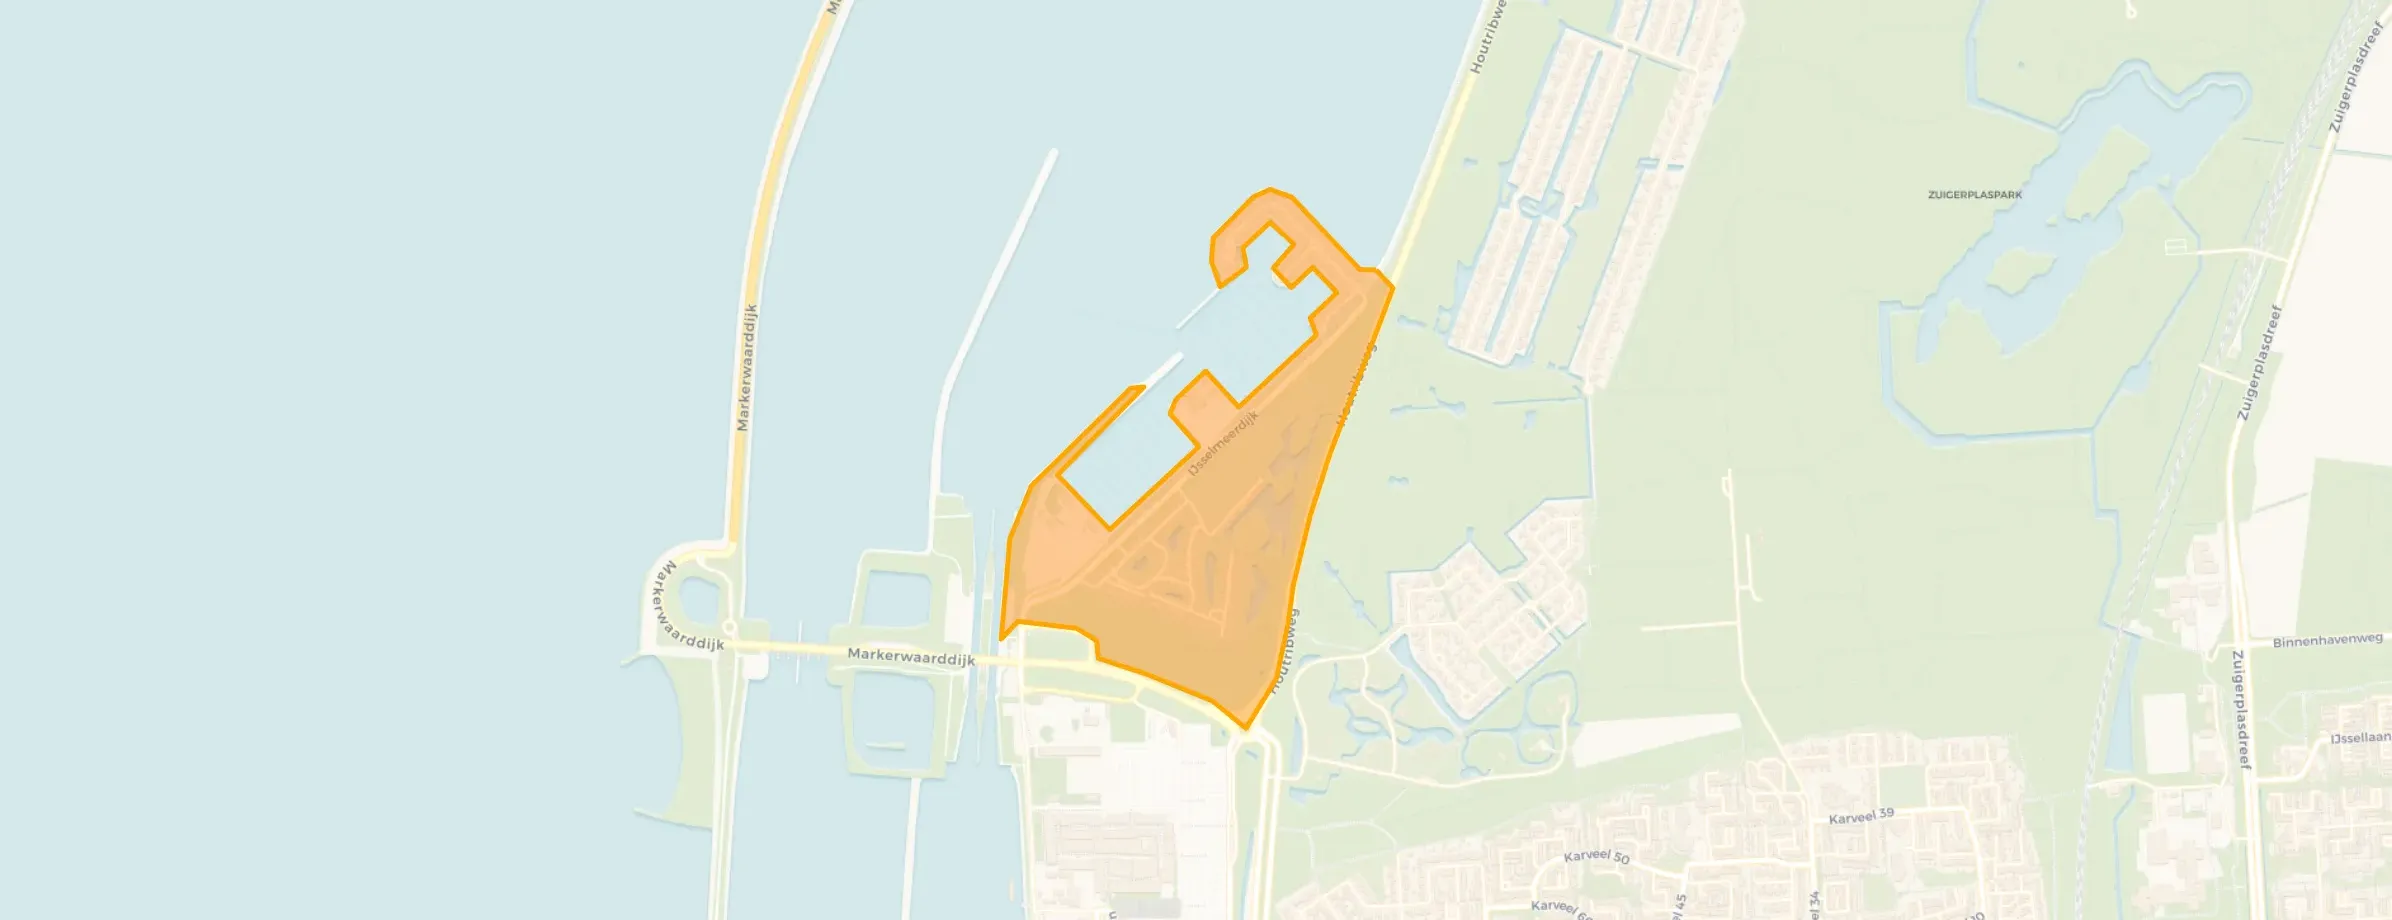
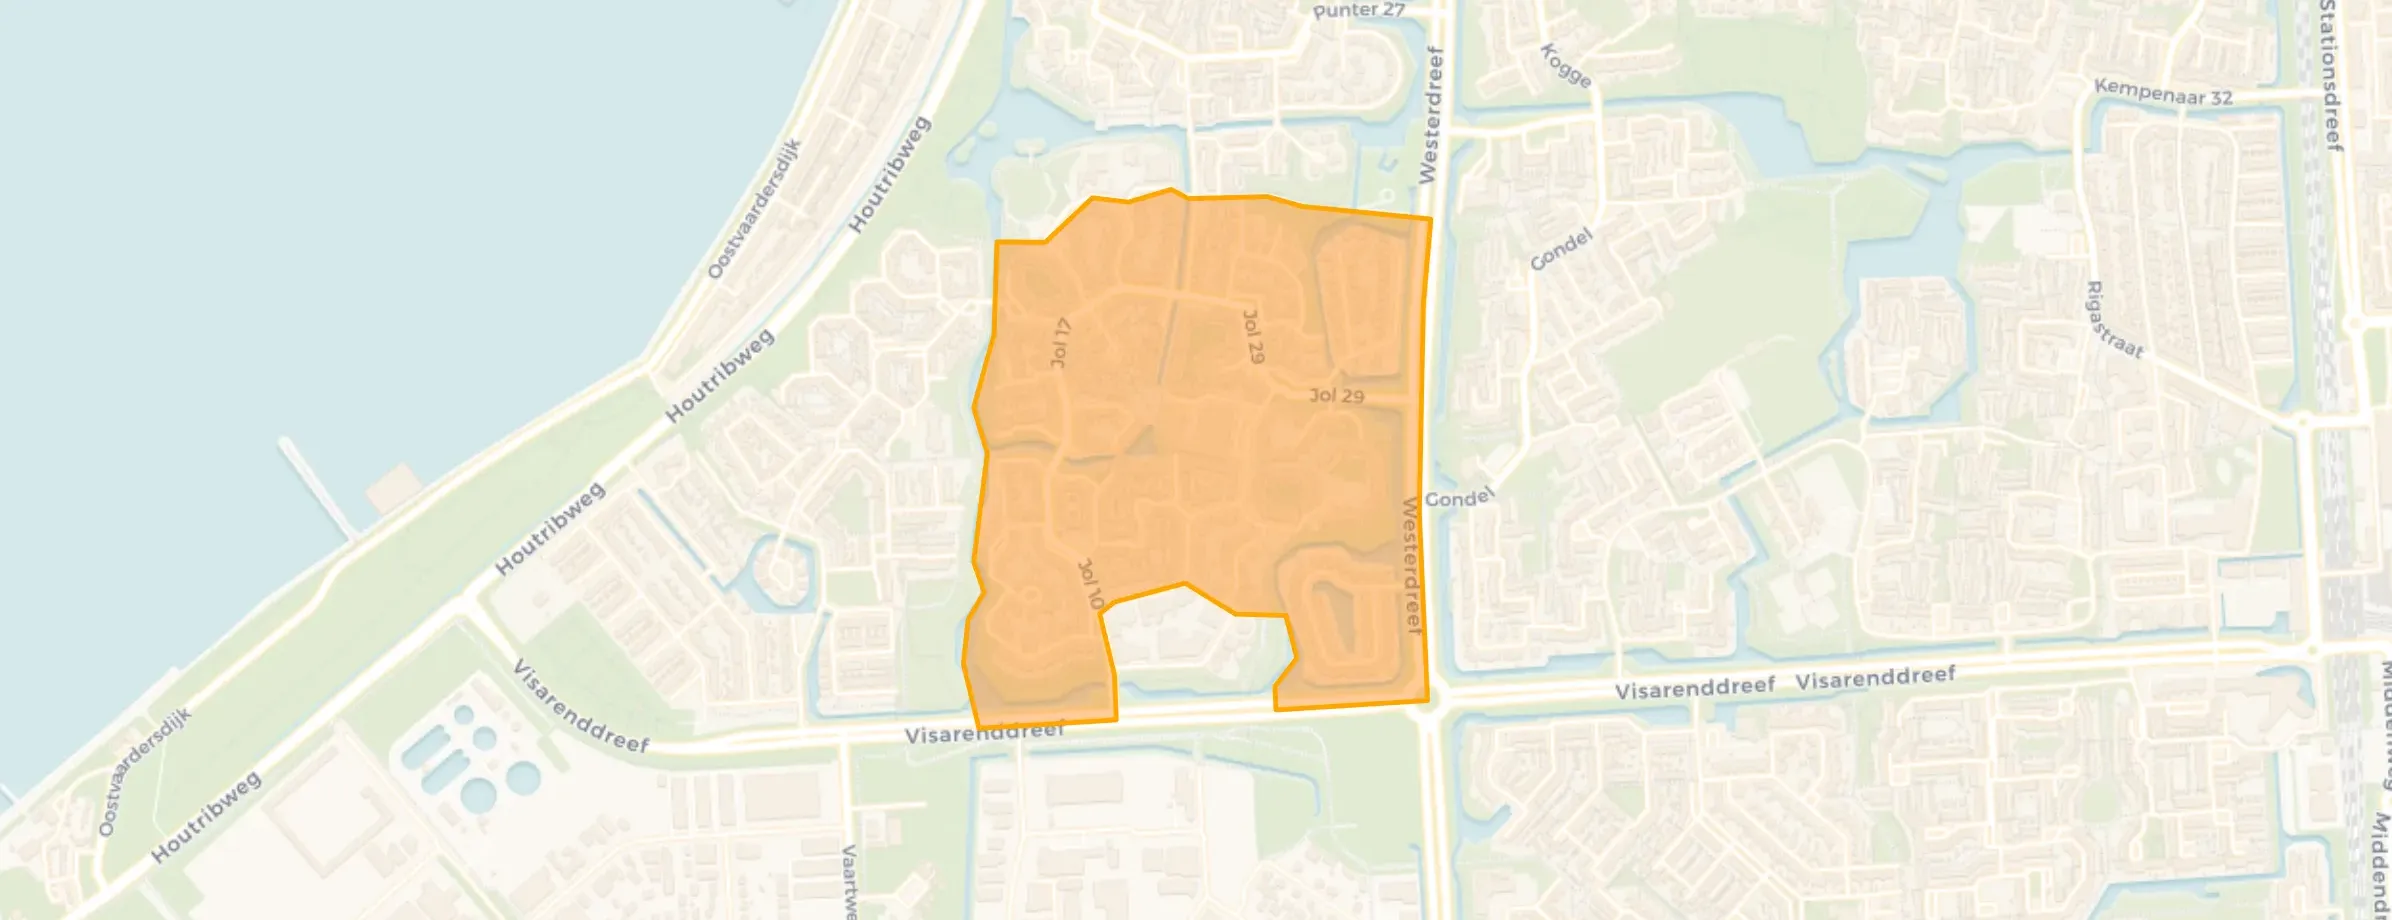
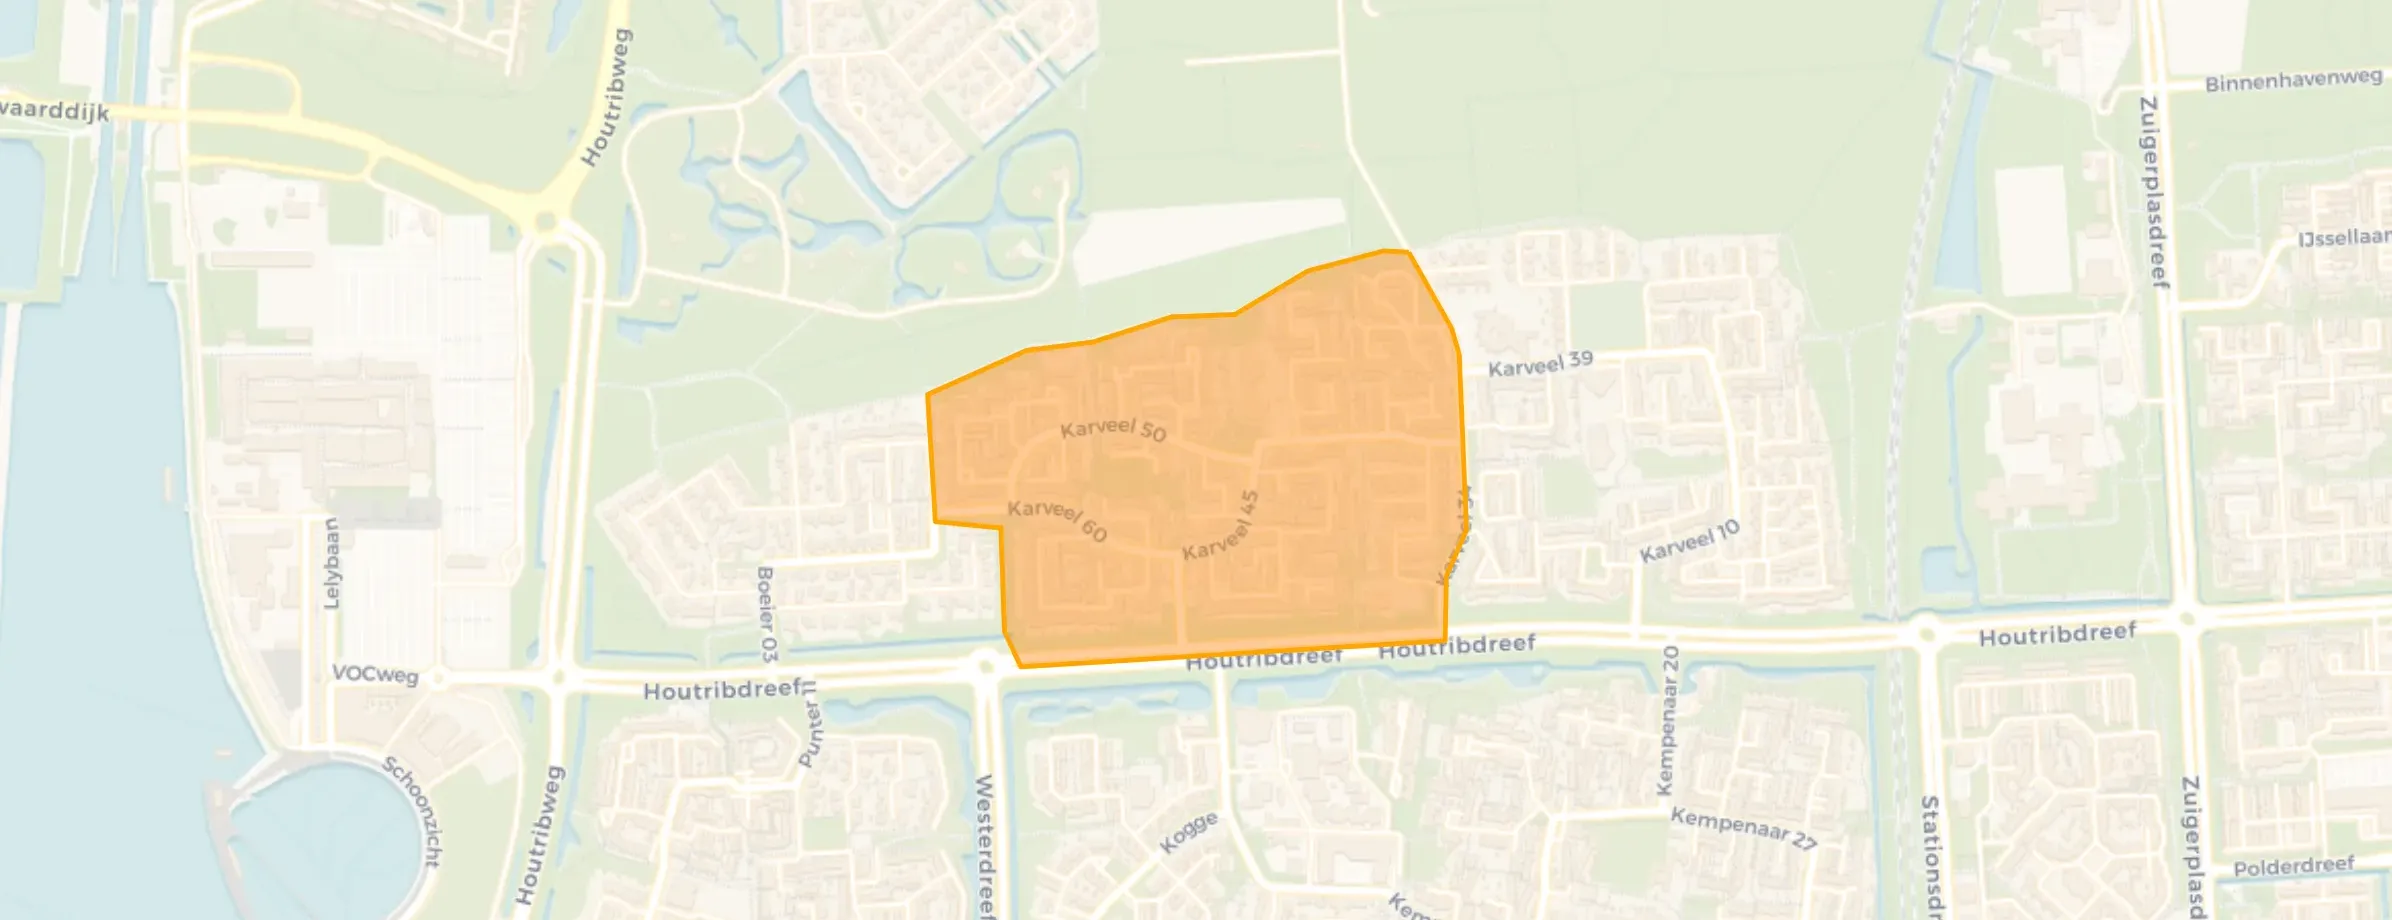
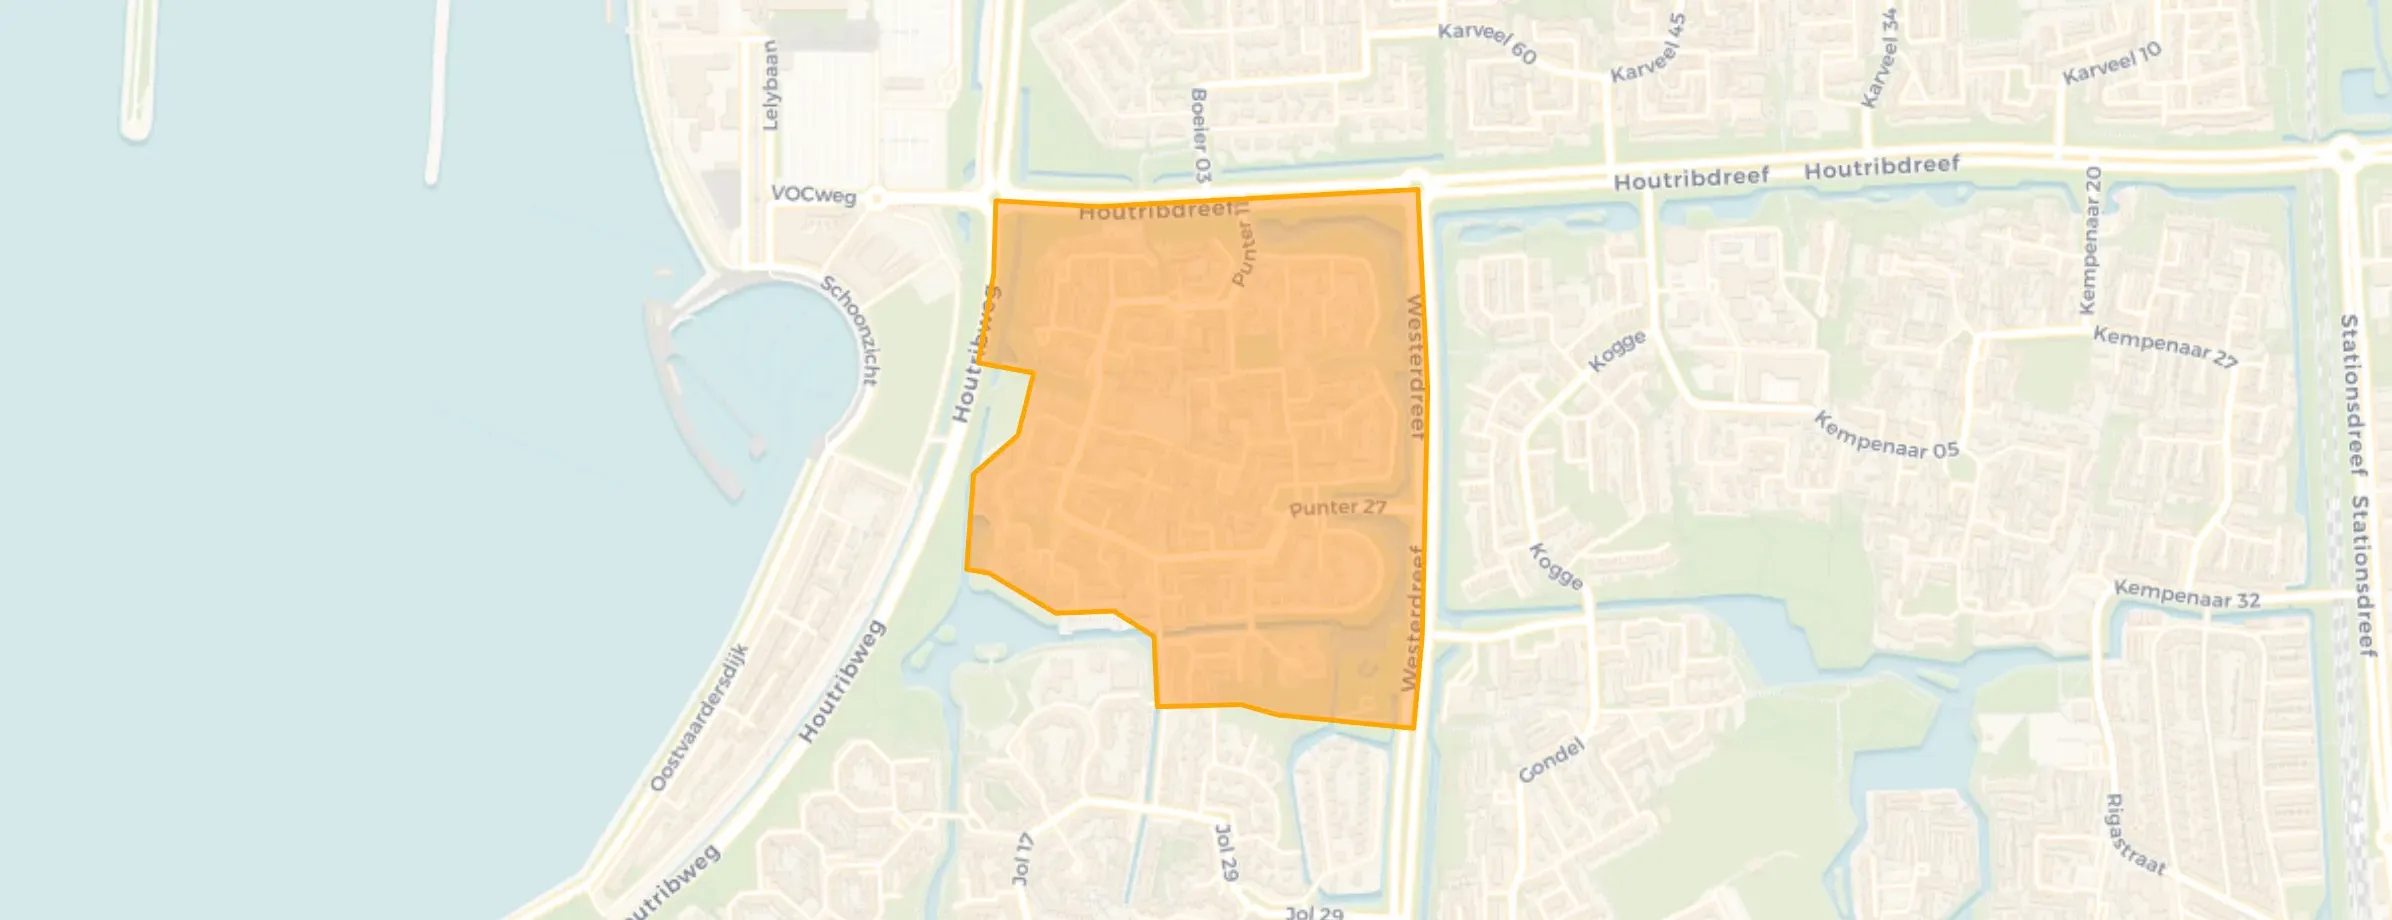
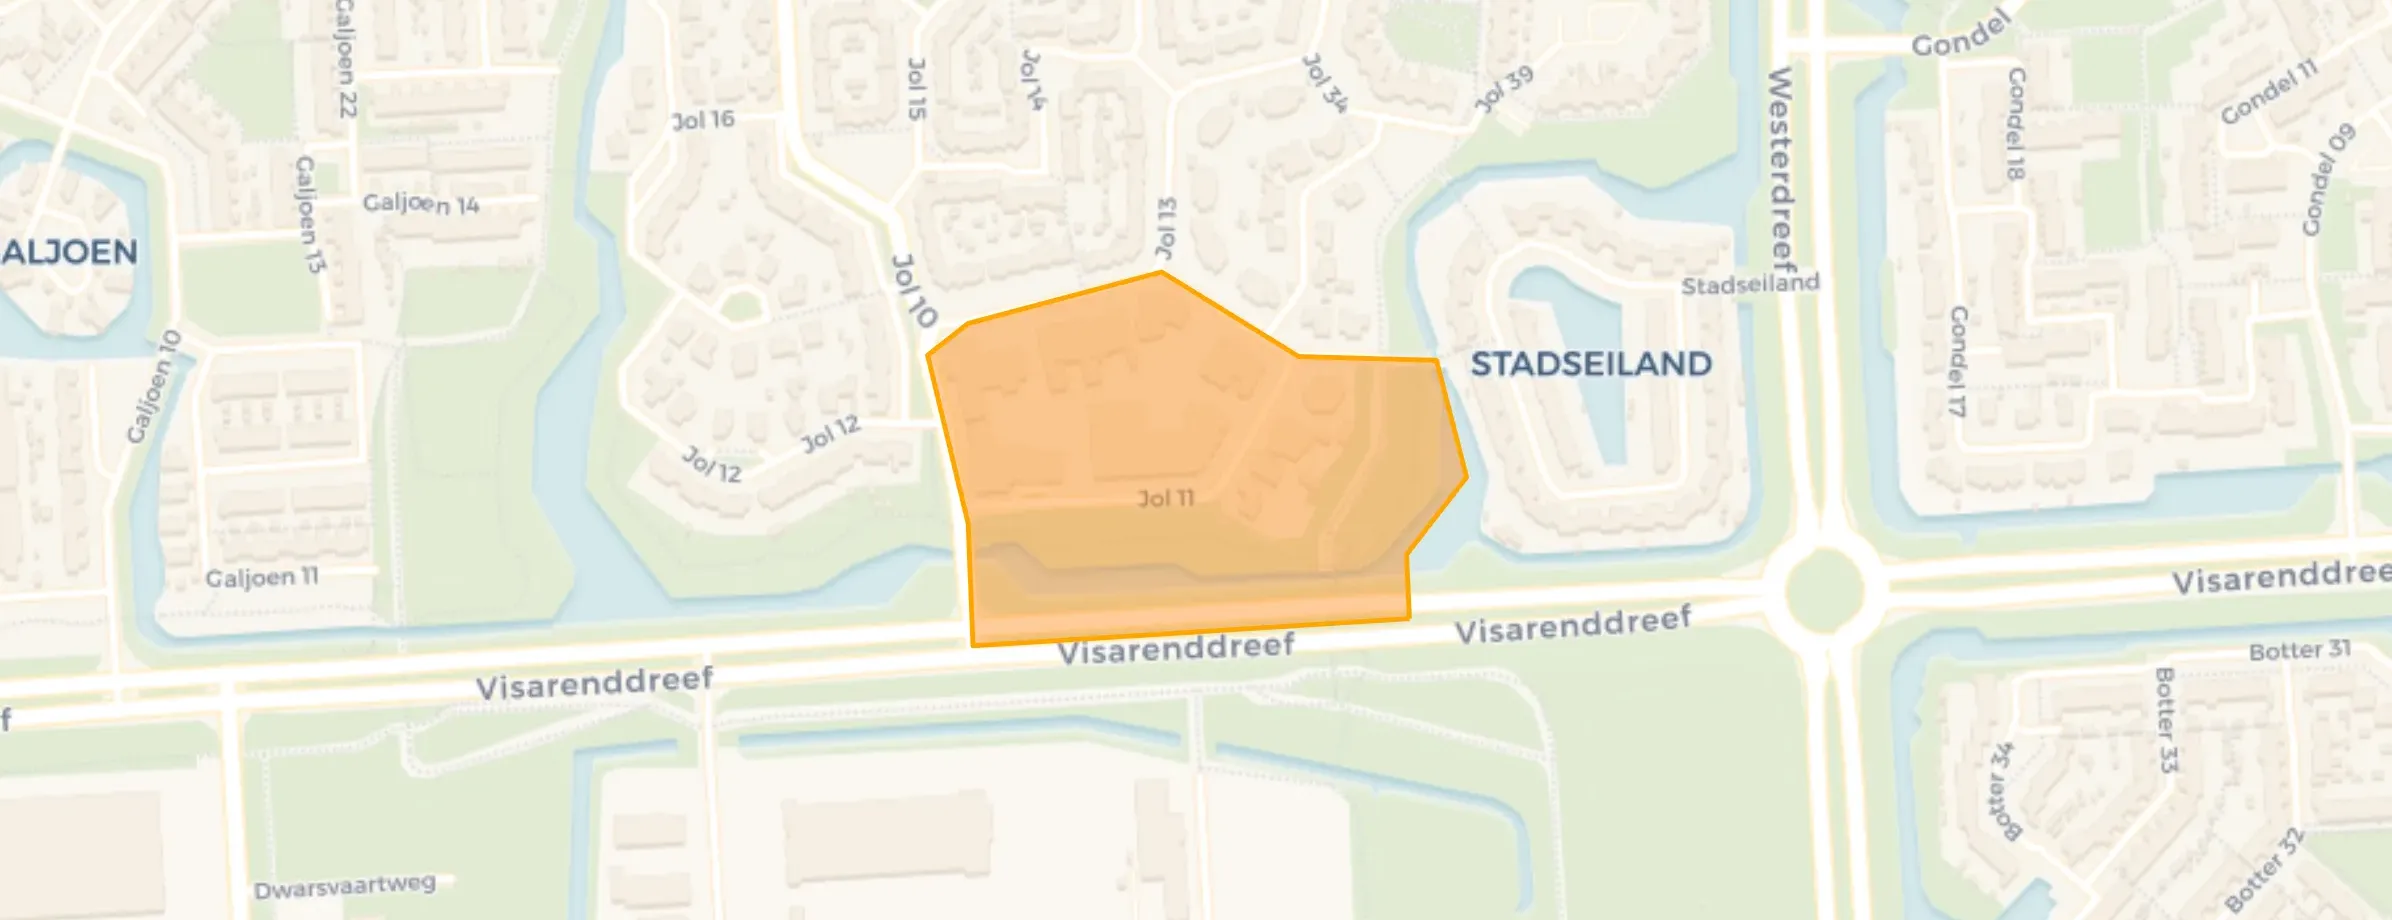
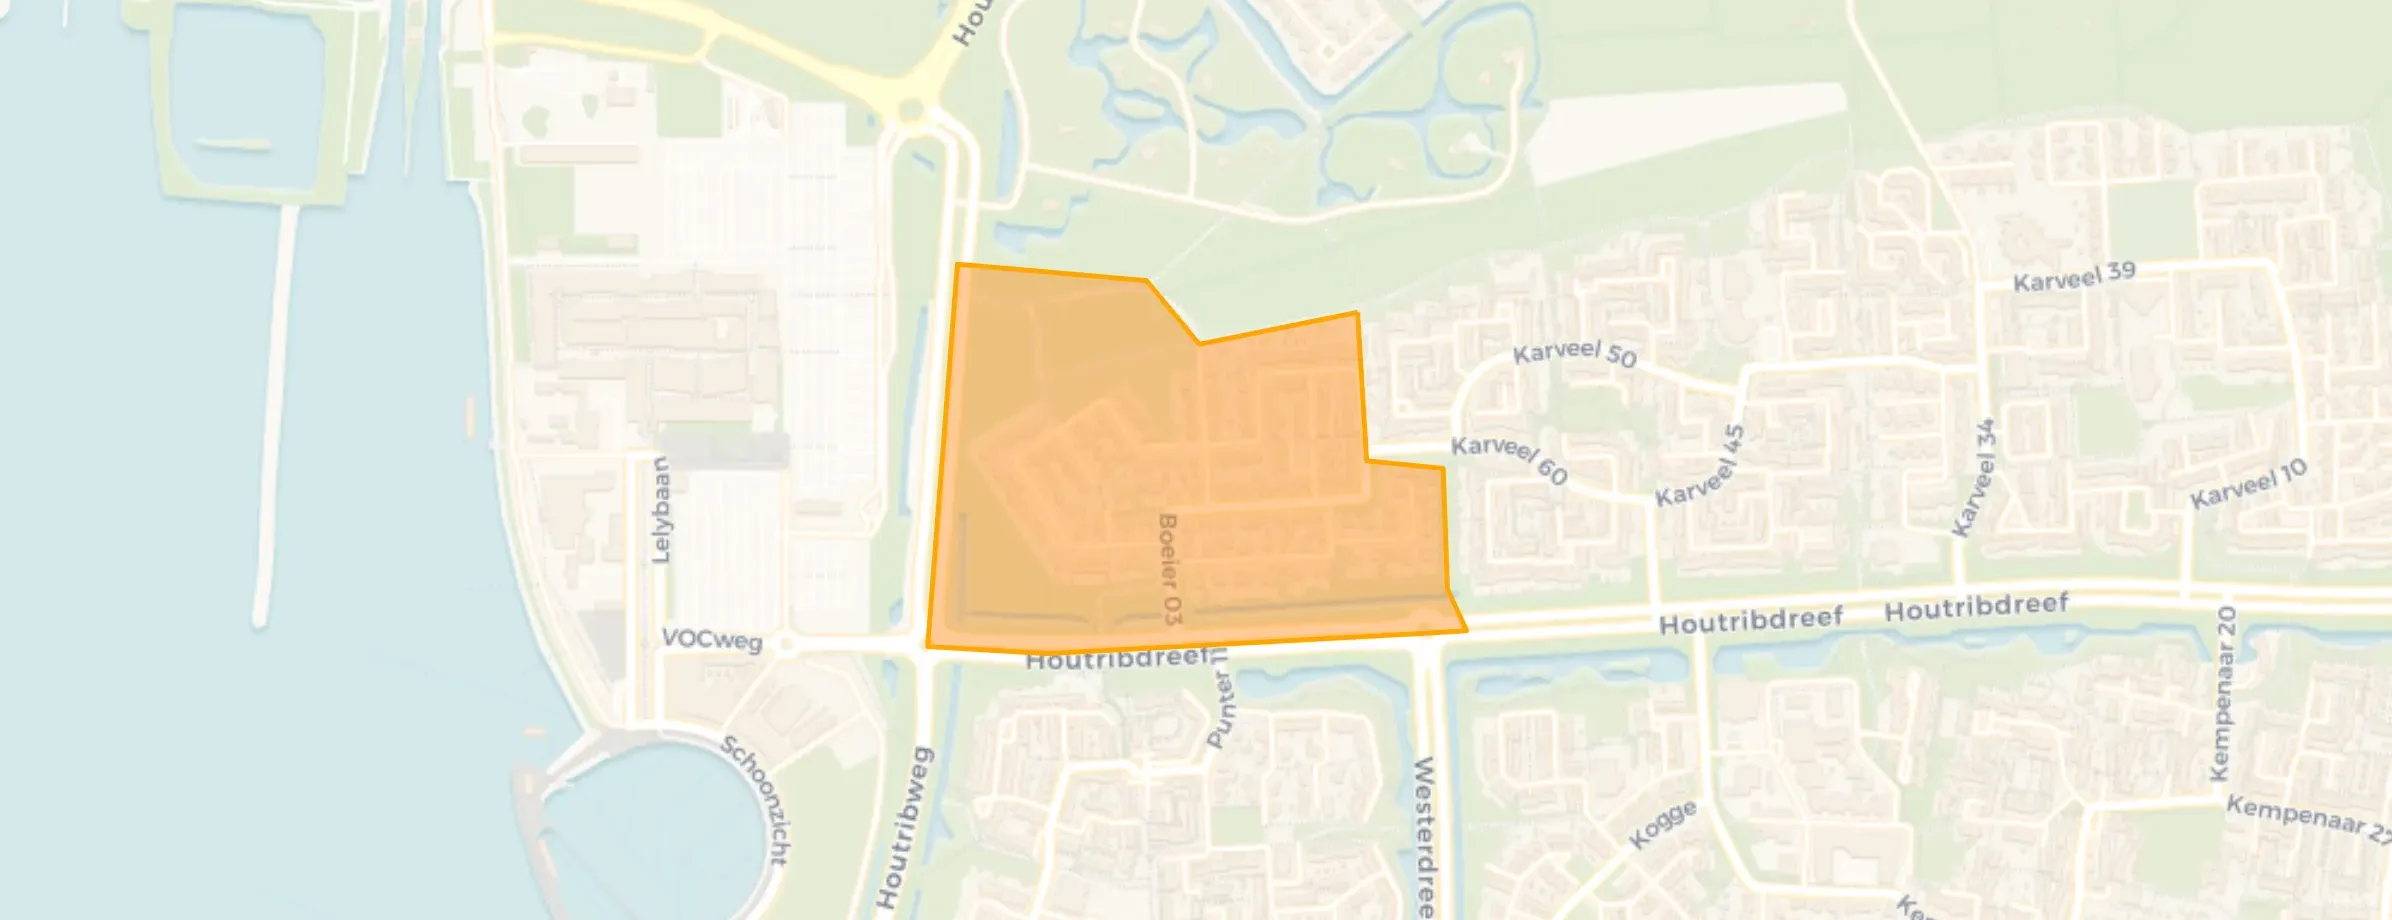
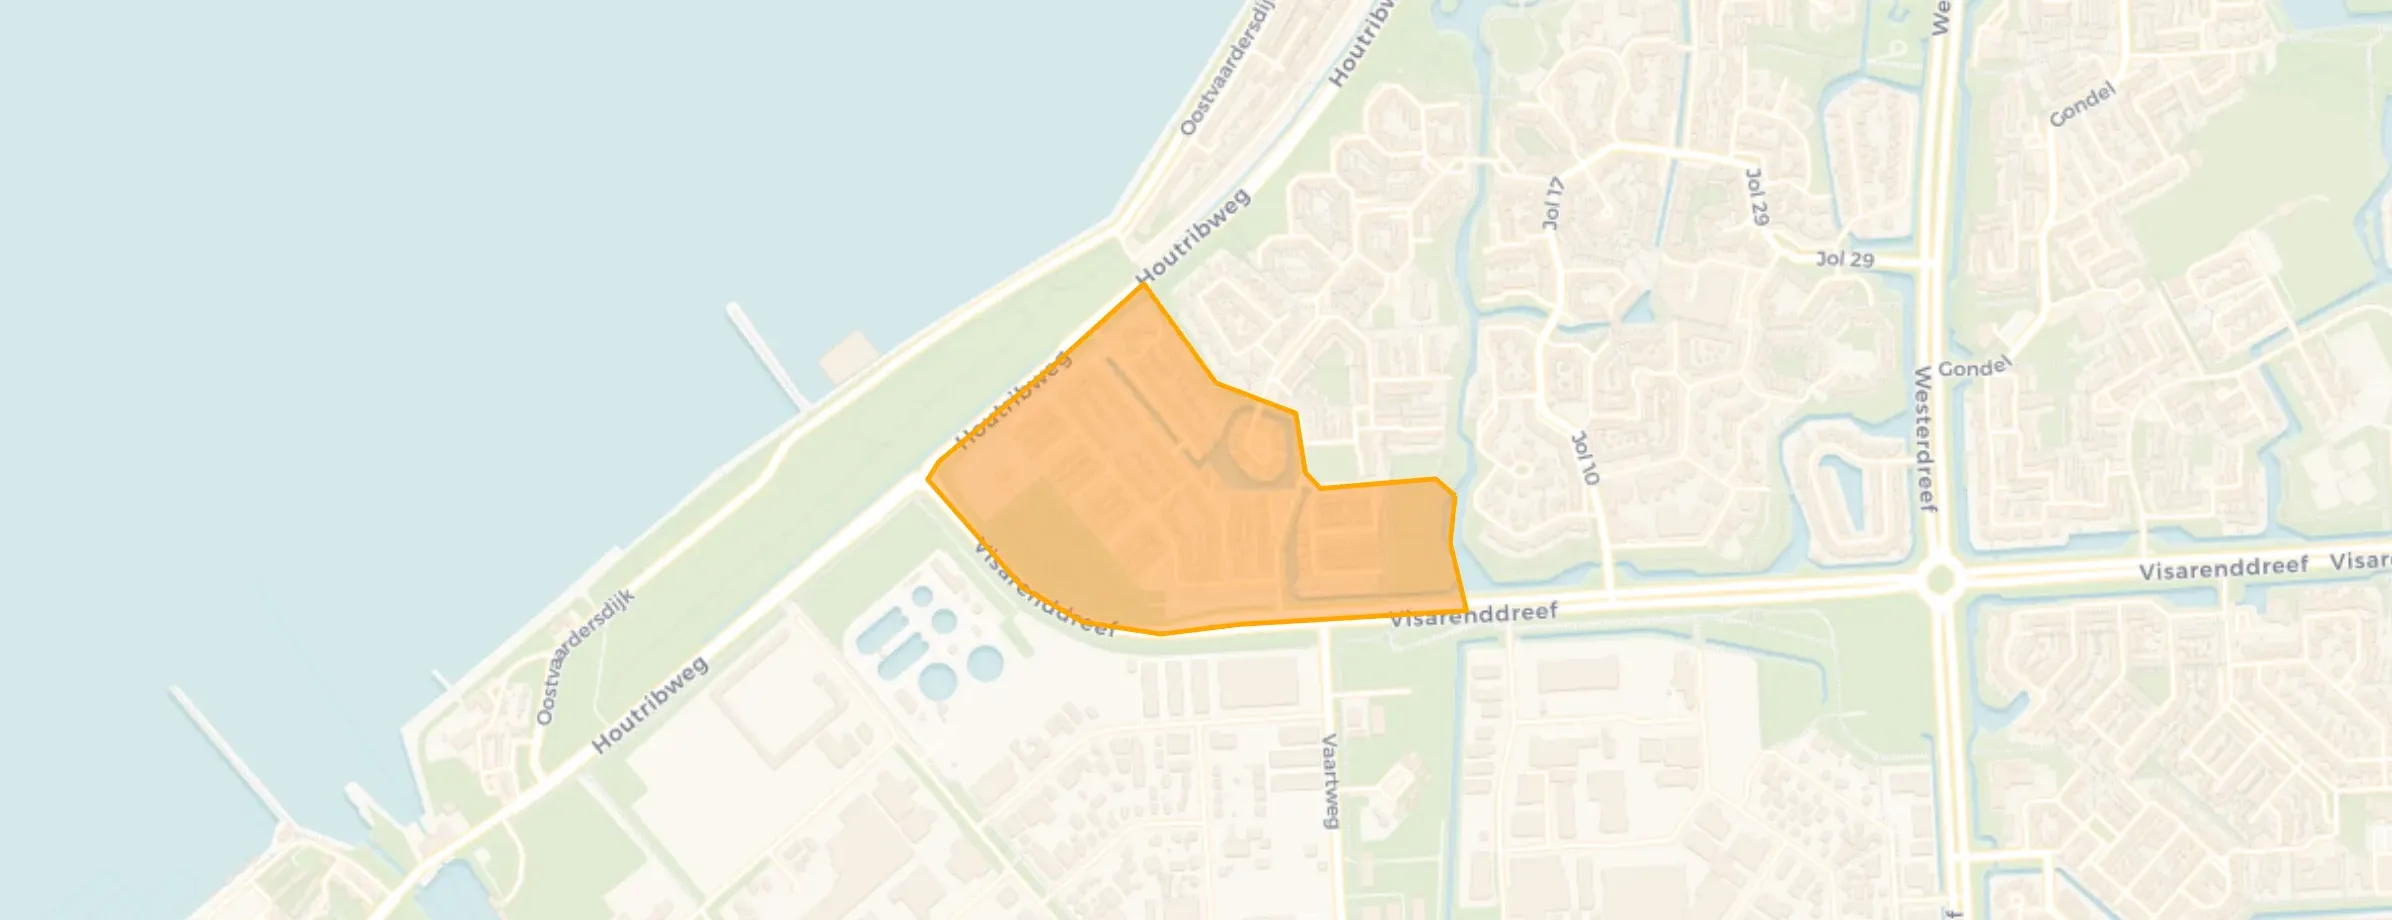
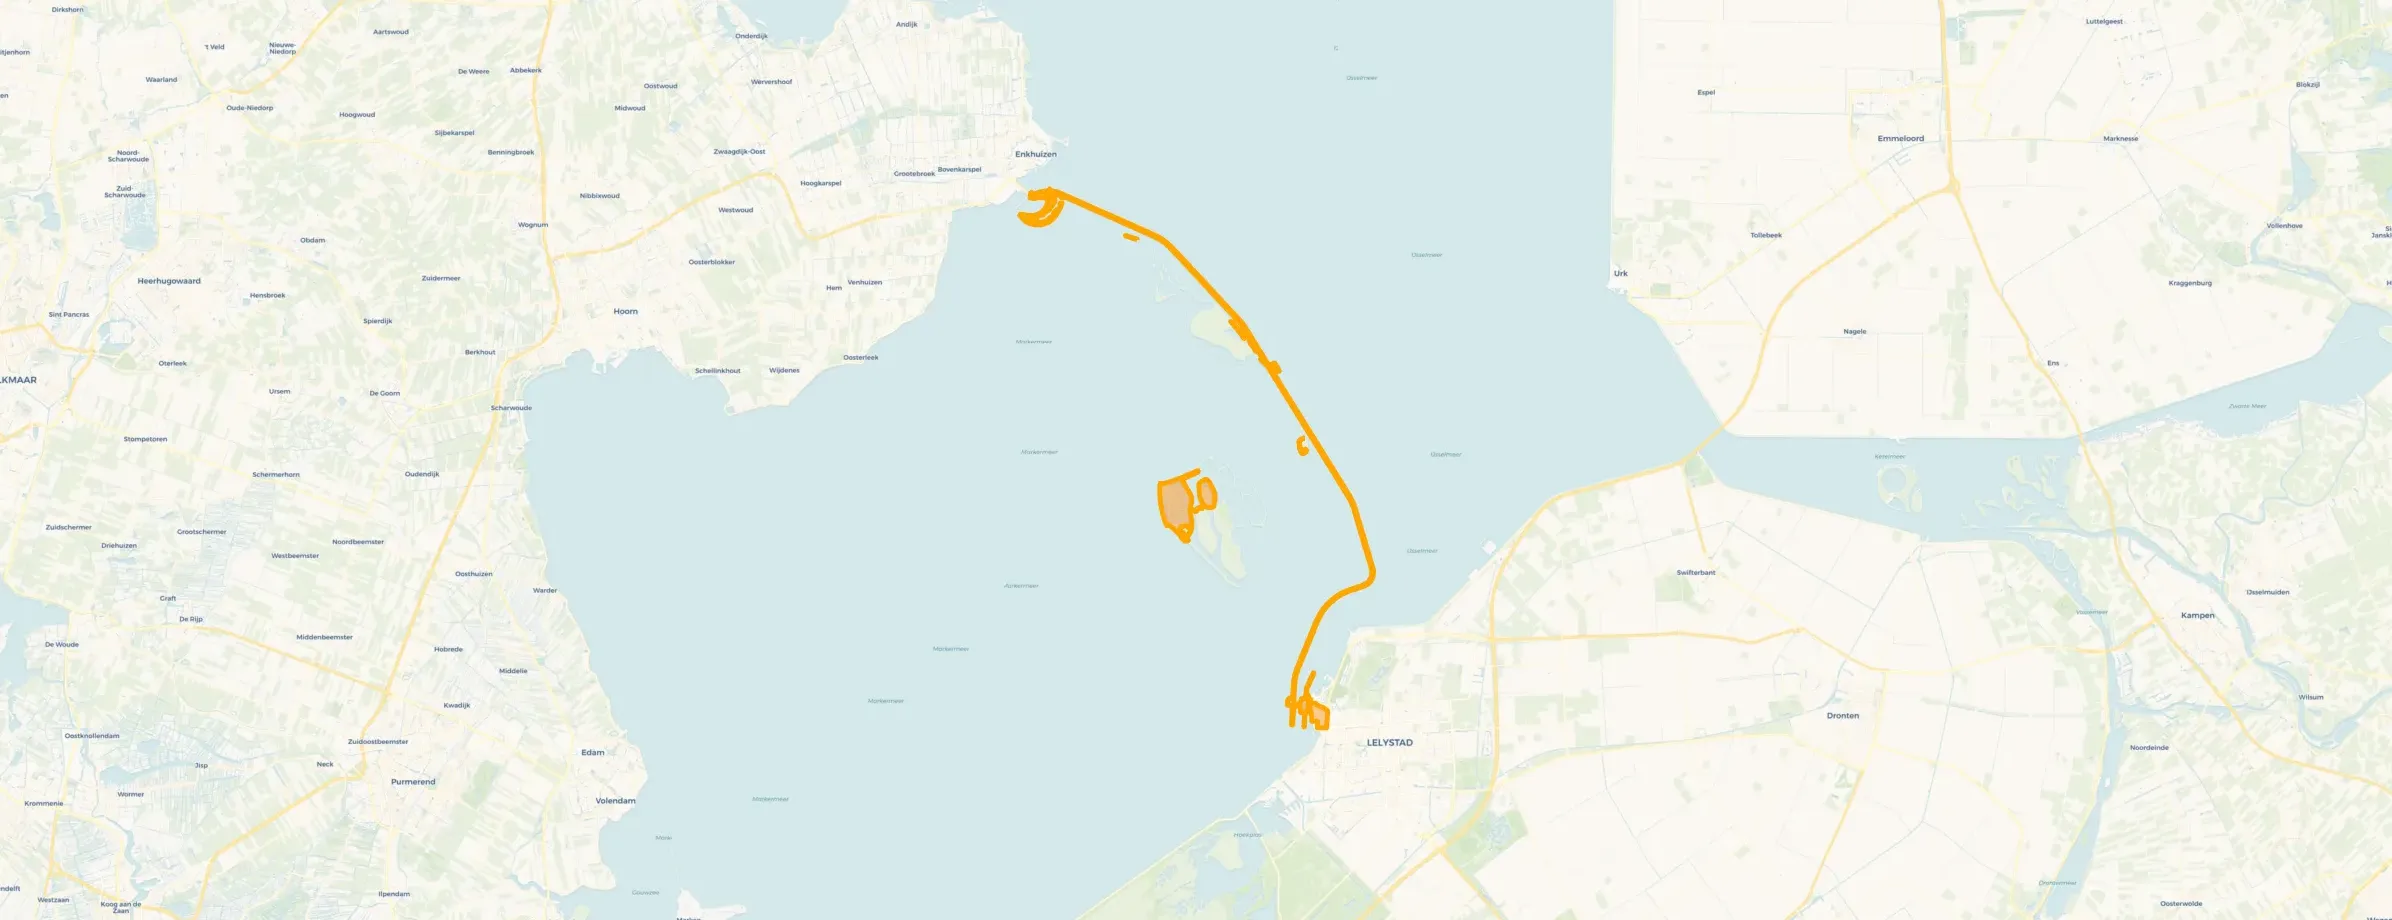
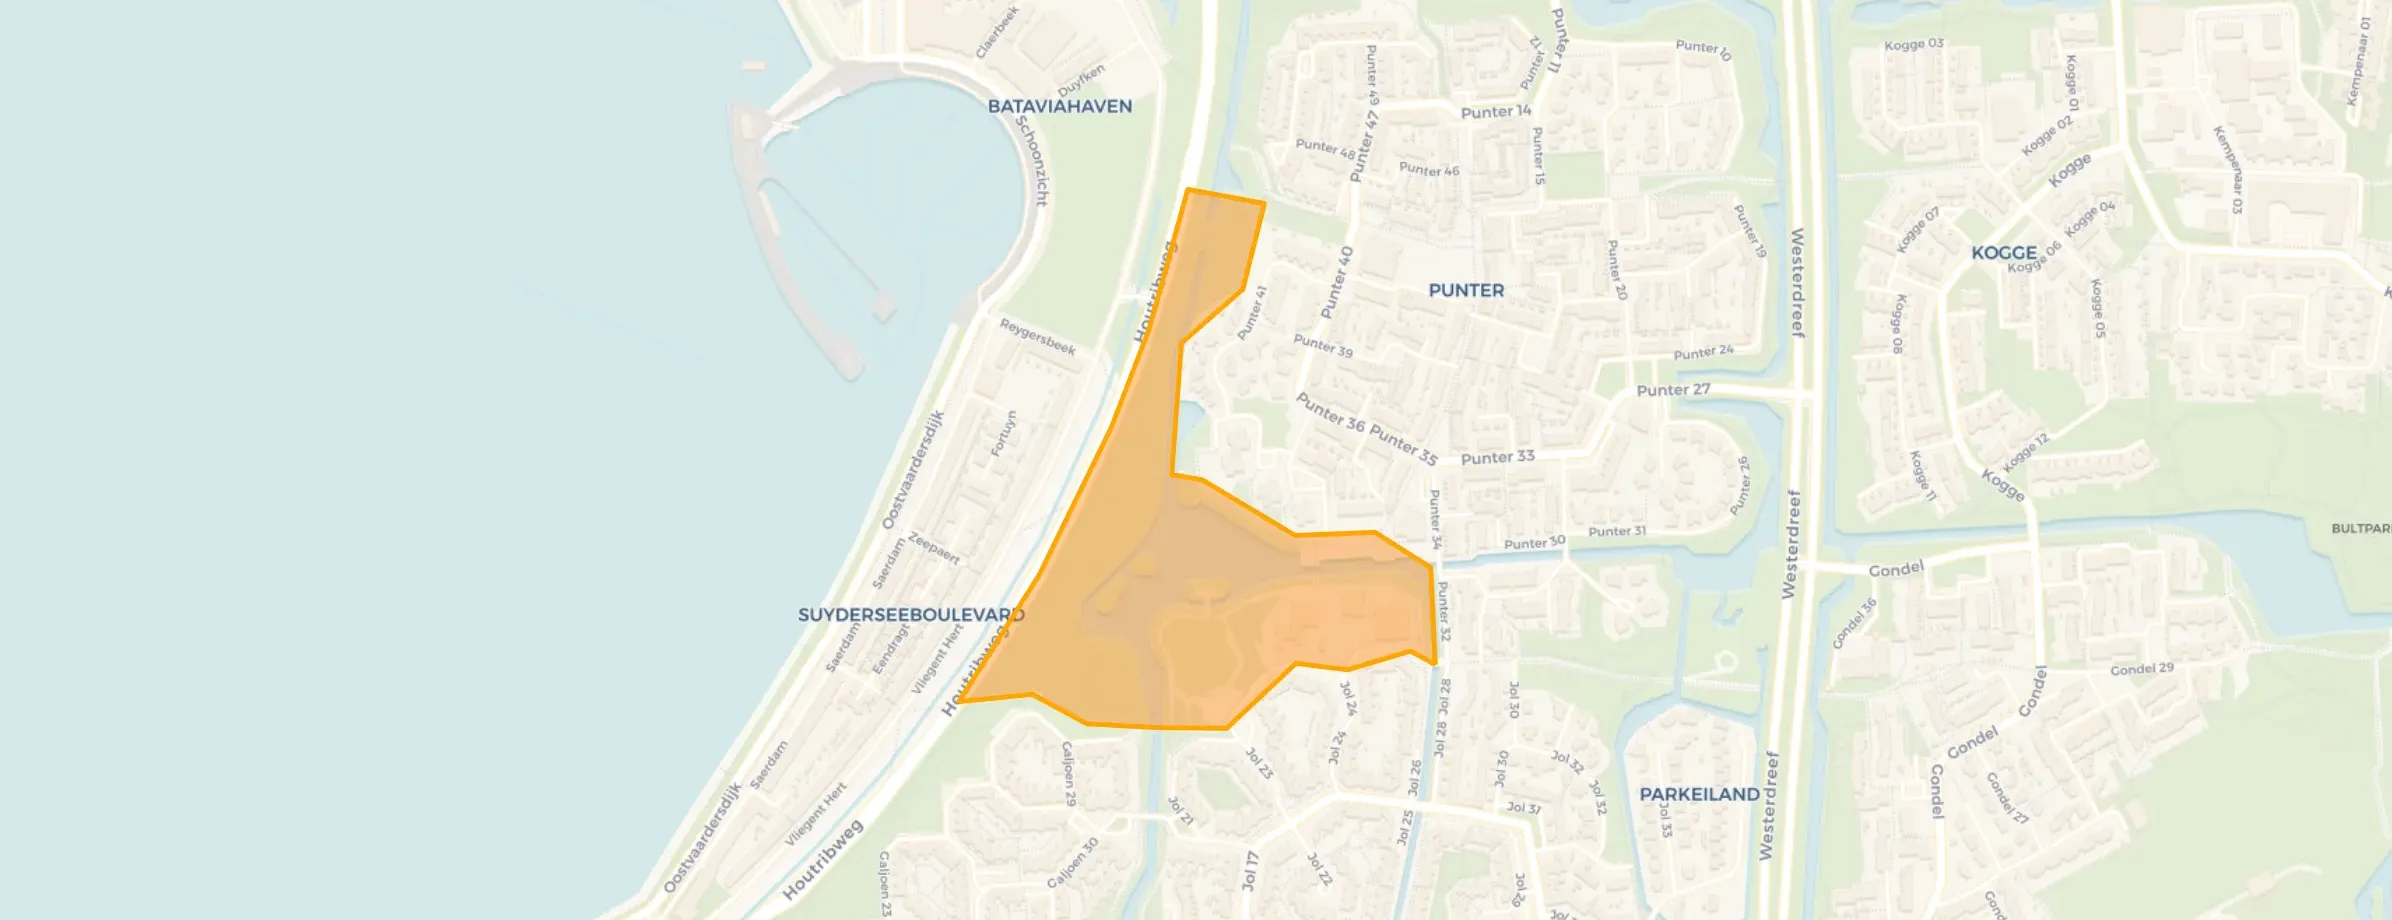
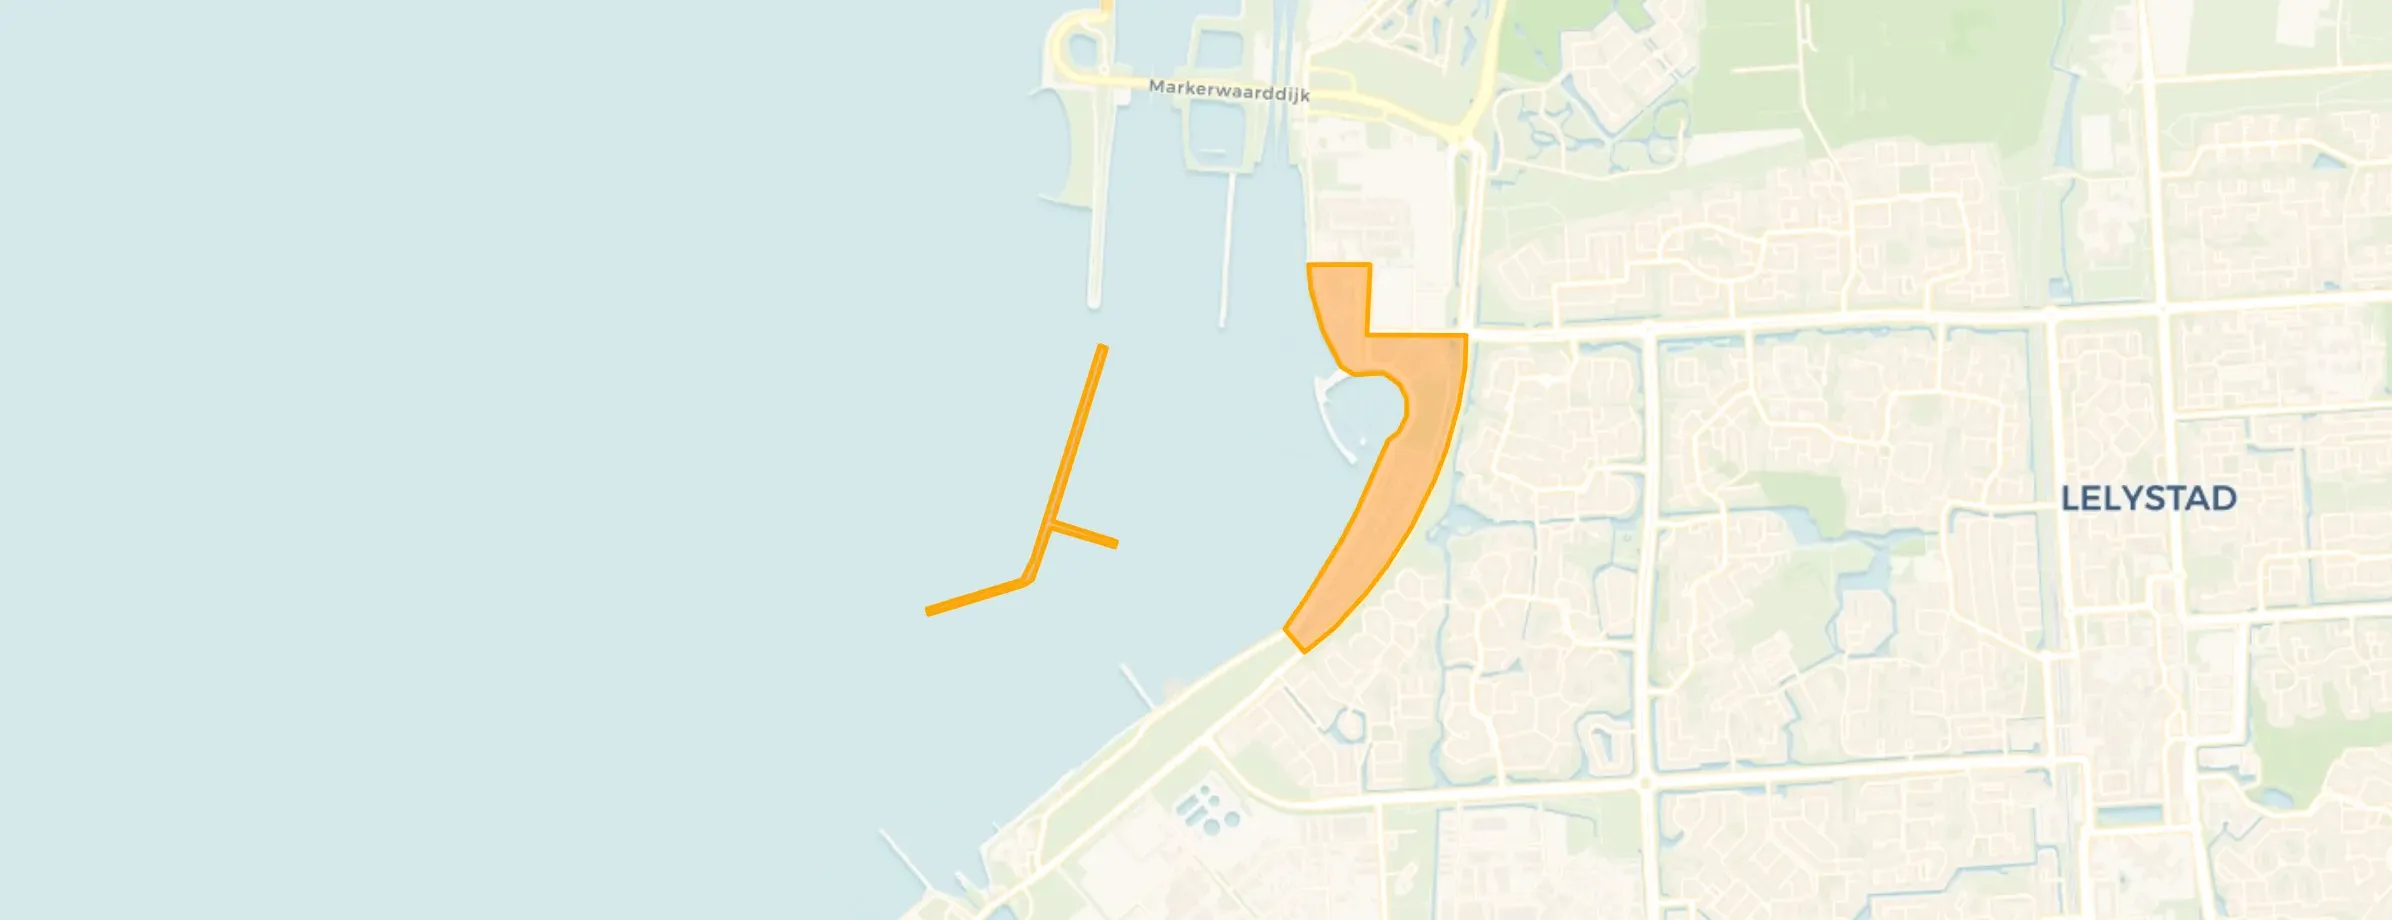
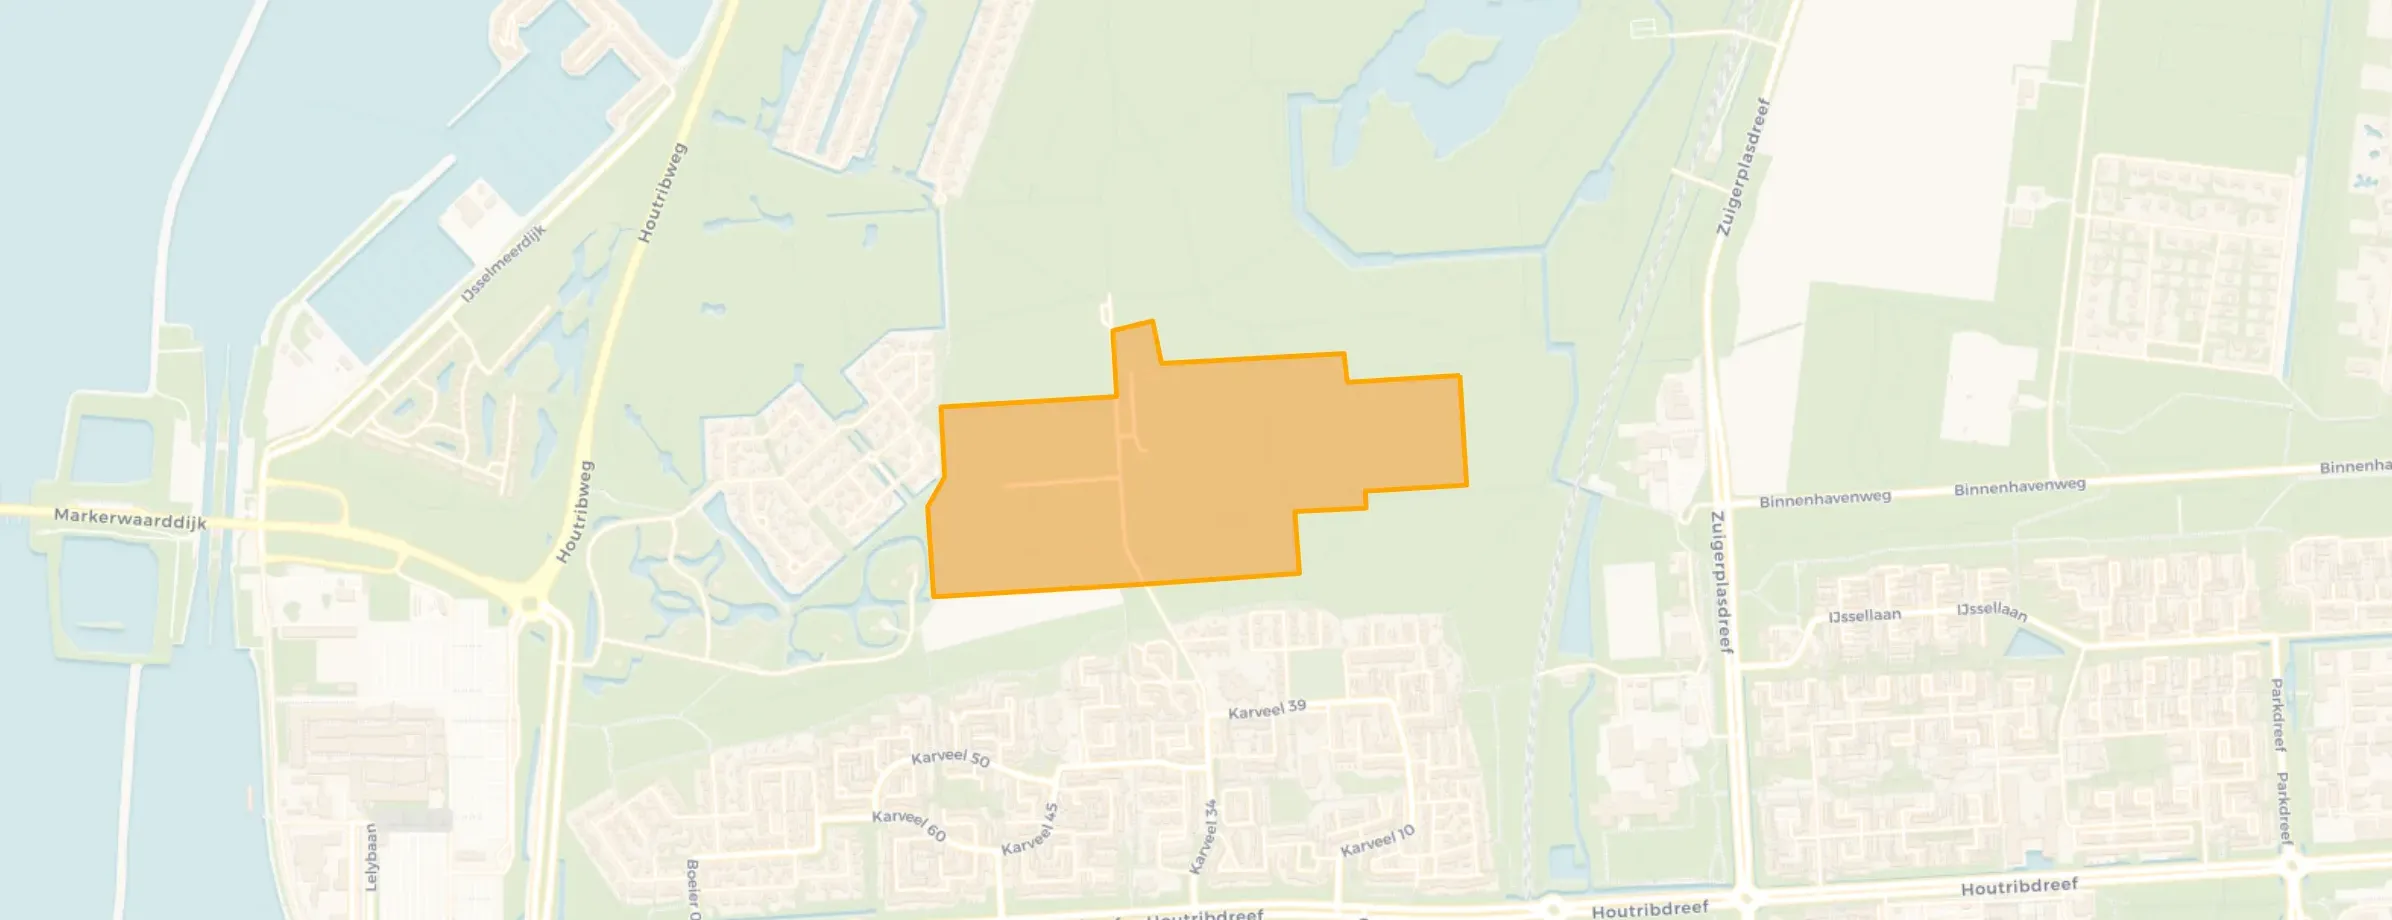
Kustwijk is located in the province of Flevoland, in the municipality of Lelystad. The district has a total area of 1.044 hectares, of which 842 hectares are land and 202 hectares are water. The district is coded as WK099506. The postcode area is 8231AA-8243NG.
Kustwijk has 13.010 residents. Of these, 50,3% are men and 49,7% are women. Most residents are 45 to 65 years (26,9%). The other age groups are 23,9% for '25 to 45 years', 21,4% for '65 years or older', 16,2% for '0 to 15 years' and 11,5% for '15 to 25 years'. Of the residents, 47,4% is unmarried, 40,1% is married, 8,4% is divorced and 4,1% is widowed. 8.845 residents originate from the Netherlands, 1.320 come from Europe and 2.840 come from countries outside Europe.
There are 5.640 households in Kustwijk. 29,3% of these are single-person households, 32,4% households without children and 38,2% households with children. The average household size is 2,3 persons. The national average is 2,1 persons.
In Kustwijk there are 10.500 income recipients. The average income per income recipient is €42.700, which is €500 (1%) higher than the national average of €42.200. Per resident, the average income is €34.900, which is €0 (0%) lower than the national average of €34.900. Most residents of Kustwijk are educated to an intermediate level. 44,4% have an intermediate education (HAVO, VWO or MBO 2-4), 30,5% have a university or higher professional education (HBO/WO) and 25,1% have a lower education (VMBO or MBO 1).
Of the 13.010 residents, around 71% are in paid employment, which amounts to 9.237 people. This is 1% lower than the national average of 72%. The majority of workers are in salaried employment (84%), while 16% are self-employed. In Kustwijk, 26% of residents receive a benefit. The largest group is those receiving a state pension (AOW). 2.510 people receive this benefit.
In Kustwijk there are 5.550 homes with an average assessed value (WOZ) of €389.000. Of these, around 98% are occupied and 2% unoccupied. Most homes are owner-occupied. This amounts to 26% rental homes and 74% owner-occupied homes. Of the homes, 74% privately owned, 18% owned by housing associations and 8% owned by other landlords. The most common construction periods in Kustwijk are 1970-1980 (41%) and 1980-1990 (21%).
There are currently 49 homes for sale in Kustwijk. The most recently listed home is Houtwal 25 by De Boer Makelaardij en Assurantien Flevoland B.V.. Over the past year, 70 homes were sold in Kustwijk. On average, a home was sold within 82 days.
The average asking price for a home for sale in Kustwijk over the past year was €628.471. This is 62% higher than the average assessed value (WOZ) of €389.000. The average asking price per m² of floor area is €3.941.
There are 5 homes for rent in Kustwijk. The most recent home is VOCweg 55, offered by LIV Residential op Pararius. Over the past year, 16 homes were let in Kustwijk. On average, a listing was let within 66 days.
The average rent for a rental home in Kustwijk over the past year was €1.932 per month. Per m² of floor area that is €16 per month.
In Kustwijk there are 3.682 addresses with a registered energy label. The most common labels are A (34%), C (29%) and B (24%). On average, an address in Kustwijk uses 3.020 kWh of electricity per year. This is 18% above the national average of 2.550 kWh. Natural gas consumption, at 920 m³ per year, is 15% above the national average of 800 m³.
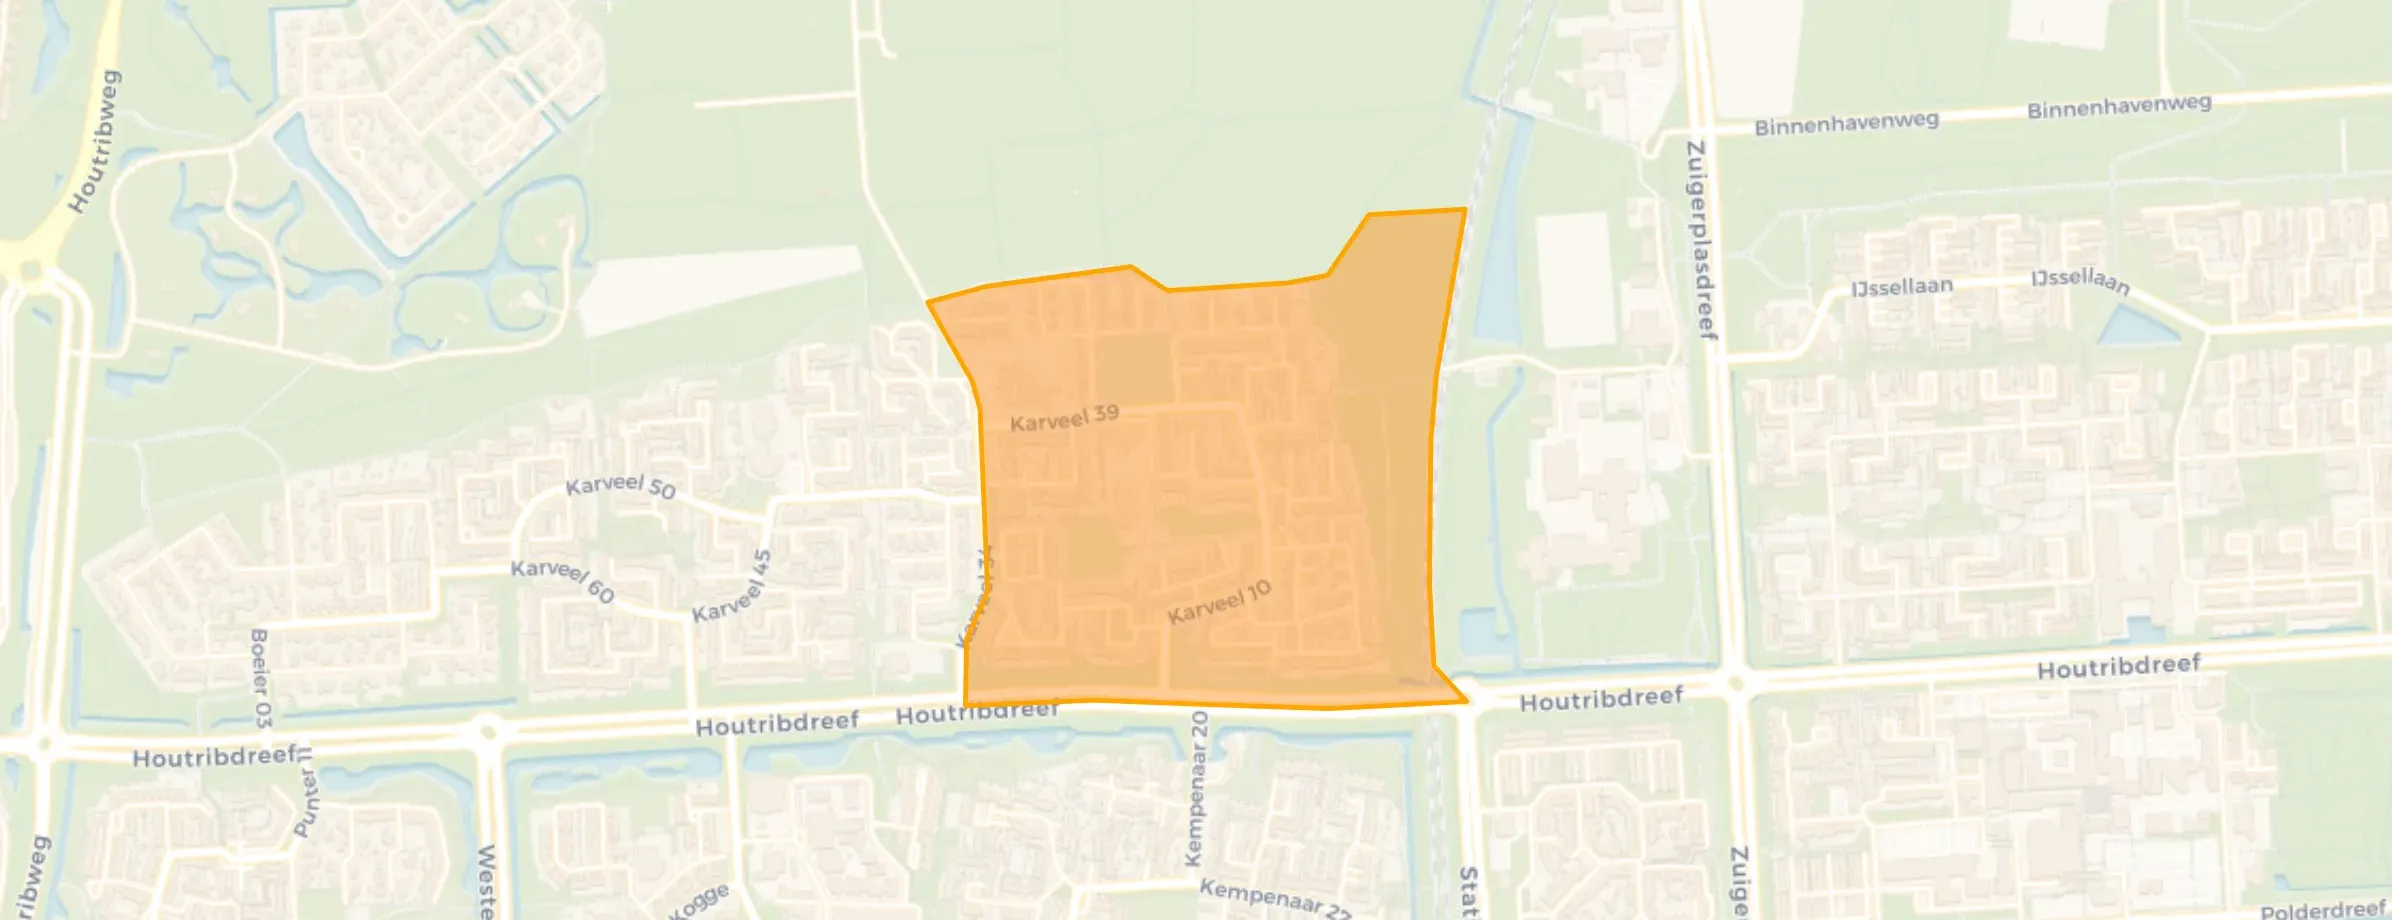
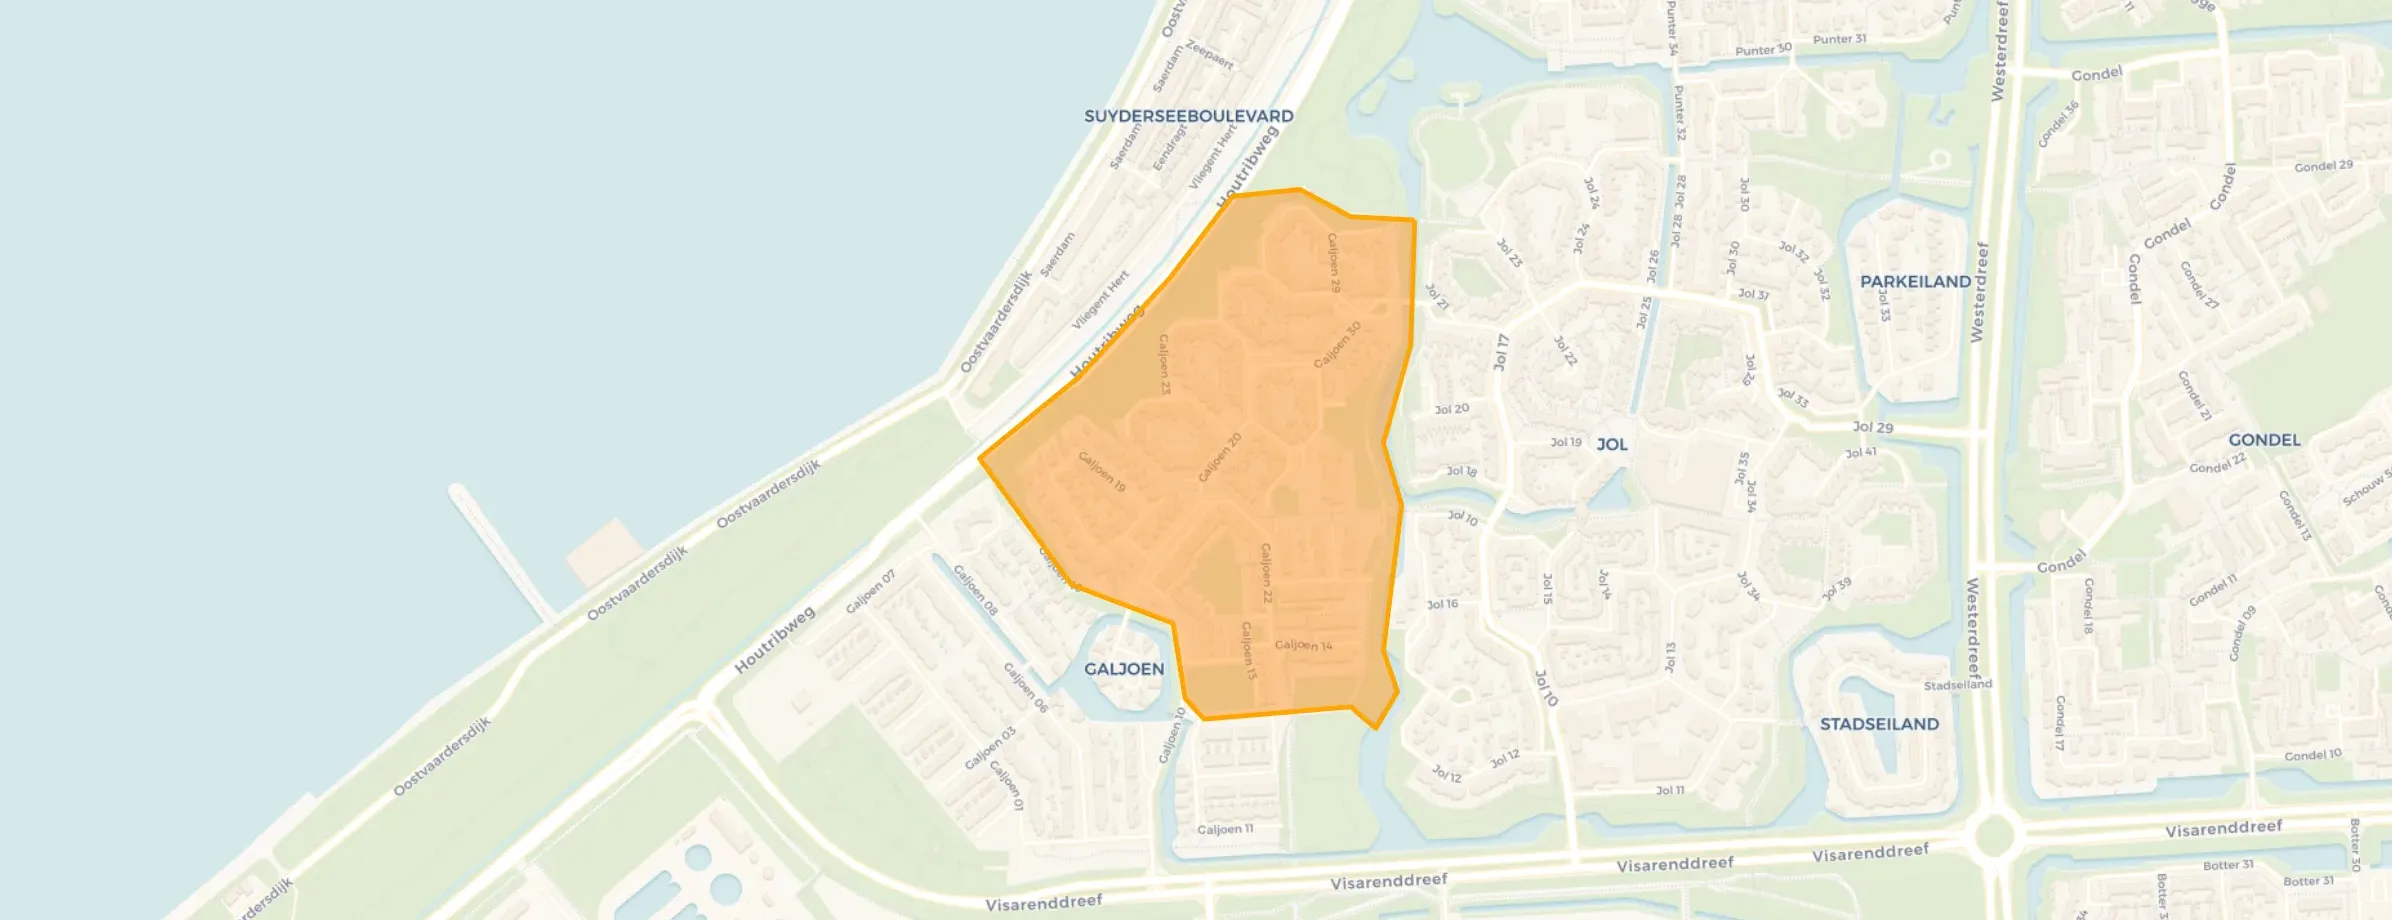
Every man for himself. No sense of community in the neighbourhood.
Auto-translated to English by AILittle solidarity, little social contact
Auto-translated to English by AIEveryone for themselves. People hardly look out for each other.
Auto-translated to English by AIIt is a quiet and good neighbourhood, but there are definitely some points for improvement. Especially the education and schools in the area, but otherwise a top neighbourhood.
Auto-translated to English by AIIt is a good neighbourhood but bad things definitely happen too and there is simply too little good education in the area, no secondary school nearby and the primary school is bad and many more schools in the area are needed
Auto-translated to English by AIDue to the removal of rubbish bins and the presence of a primary school, the amount of litter has increased enormously.
Auto-translated to English by AINothing really special happened. Just that there are nice people living here. And that there aren't really any problems in the evening, so I also get a good night's sleep.
Auto-translated to English by AIFairly cosy, sometimes a bit noisy.
Auto-translated to English by AIThe housing stock is relatively young — 100% dates from after 1990. In addition, the most common type is terraced houses (49%).
Over the past year a home for sale in Kustwijk was listed for an average of €628,471 (€3,941 per m²). That is 21% above the Dutch national average. Last quarter prices fell by 10%.
A rental home in Kustwijk cost an average of €1,932 per month (€16 per m²).
Residents give Kustwijk a 7.2 out of 10 based on 12 reviews. Especially nature and greenery (8.5) scores well; amenities (6.3) receives the lowest rating.
Wijk Kustwijk has 13,010 residents. Many families: 38% of the households have children.
The housing supply in Kustwijk is remarkably efficient: 95% has an A, A+ or B label. The average natural gas consumption per household is 920 m³ per year.
From Kustwijk you can on average reach a supermarket at 1.7 km, a GP at 2.0 km, a railway station at 3.5 km, a primary school at 1.3 km (as the crow flies, source: CBS).
Right now you will find 49 homes for sale and 5 homes for rent in Kustwijk. A home for sale here is listed for an average of 82 days — relatively long for the current market.