Municipality in Flevoland
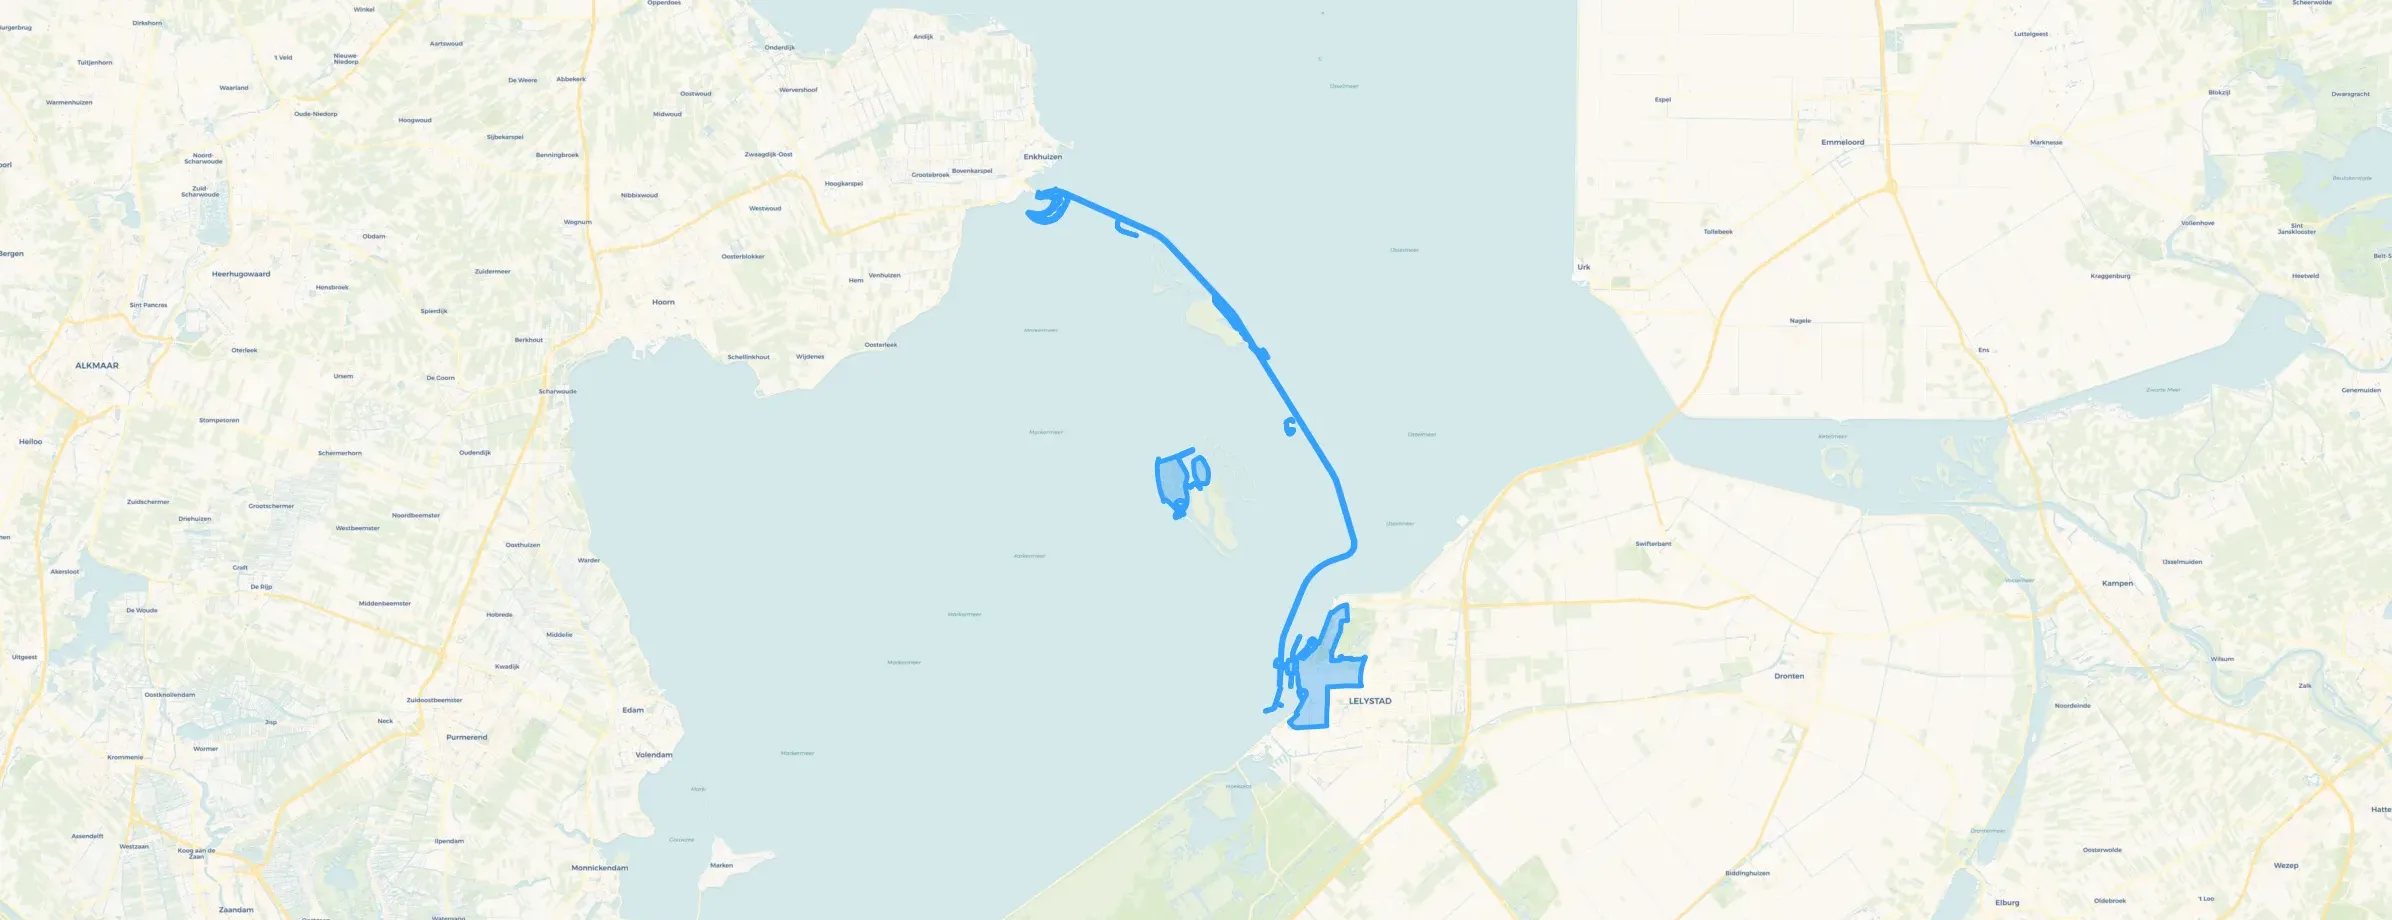
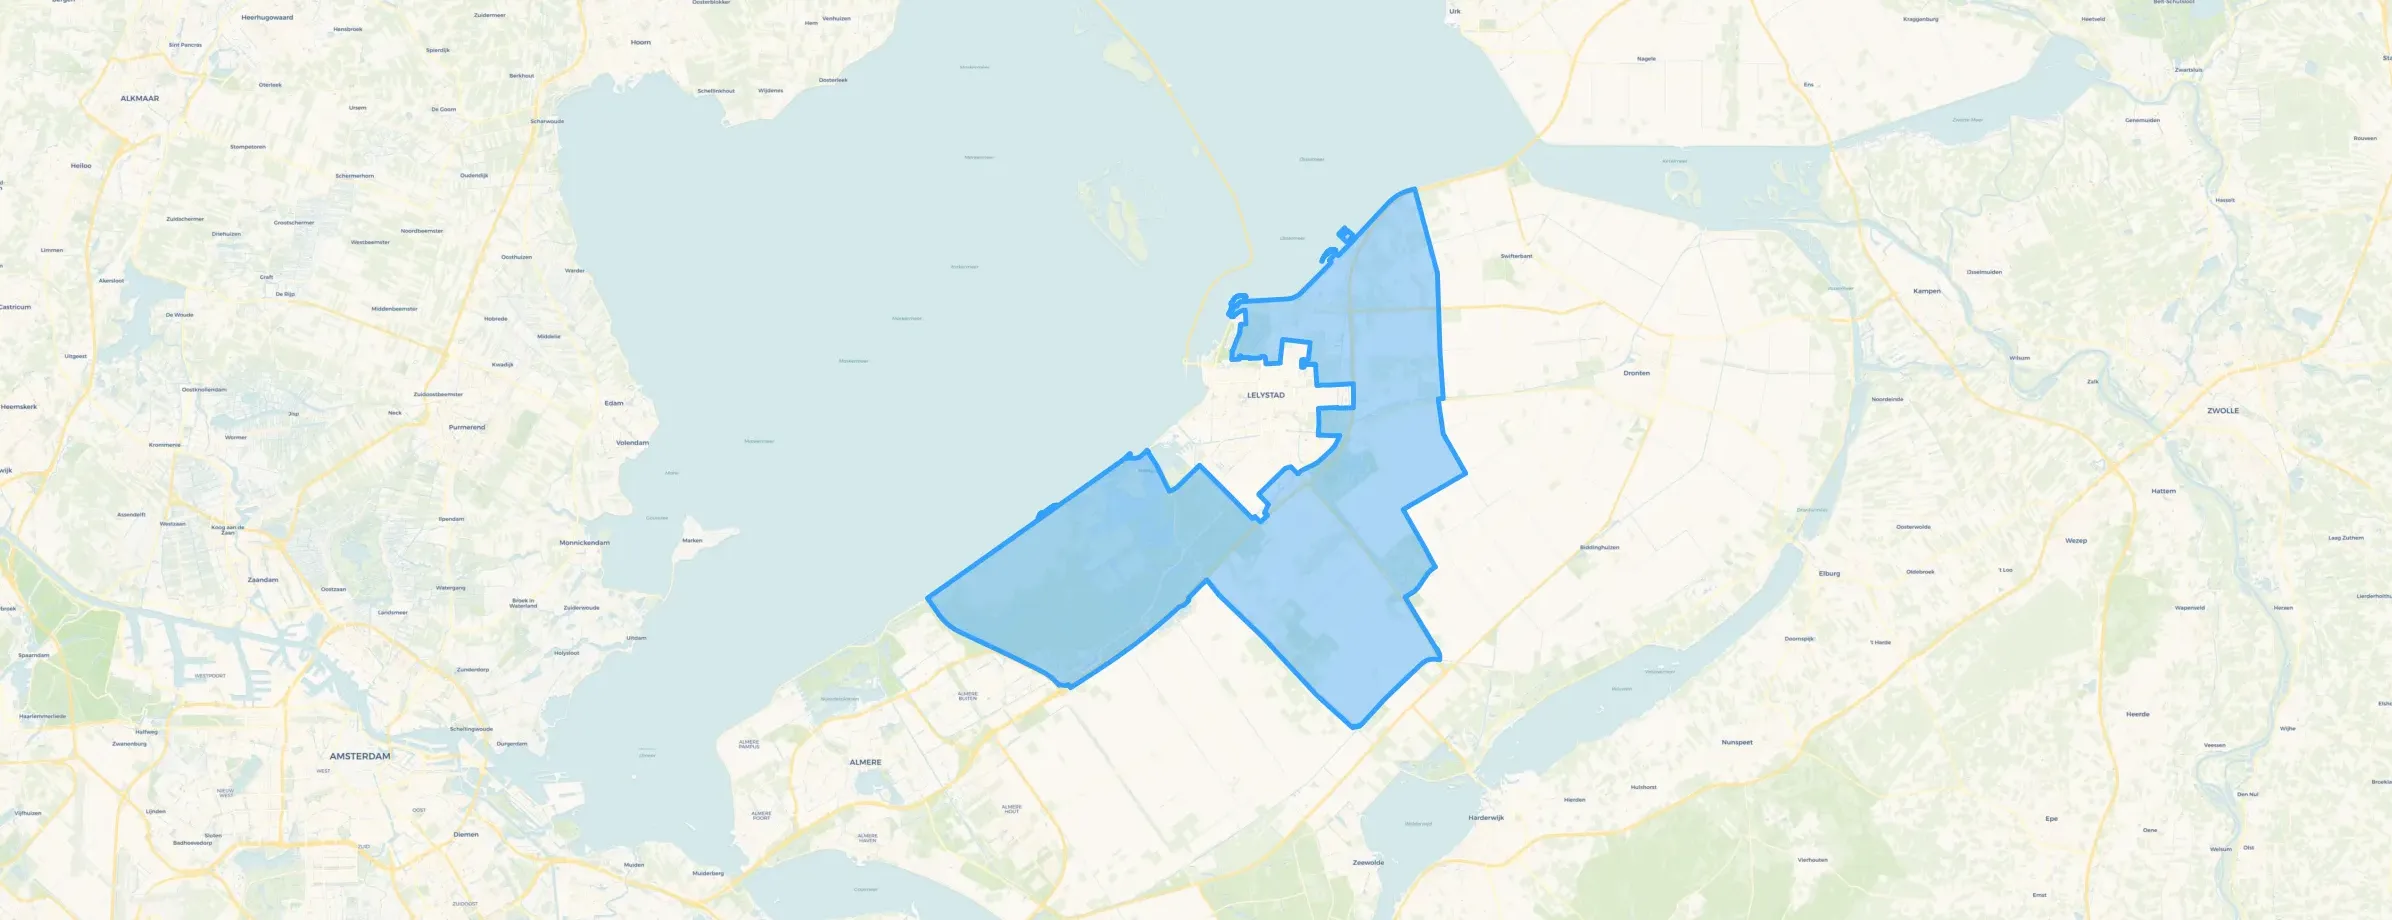
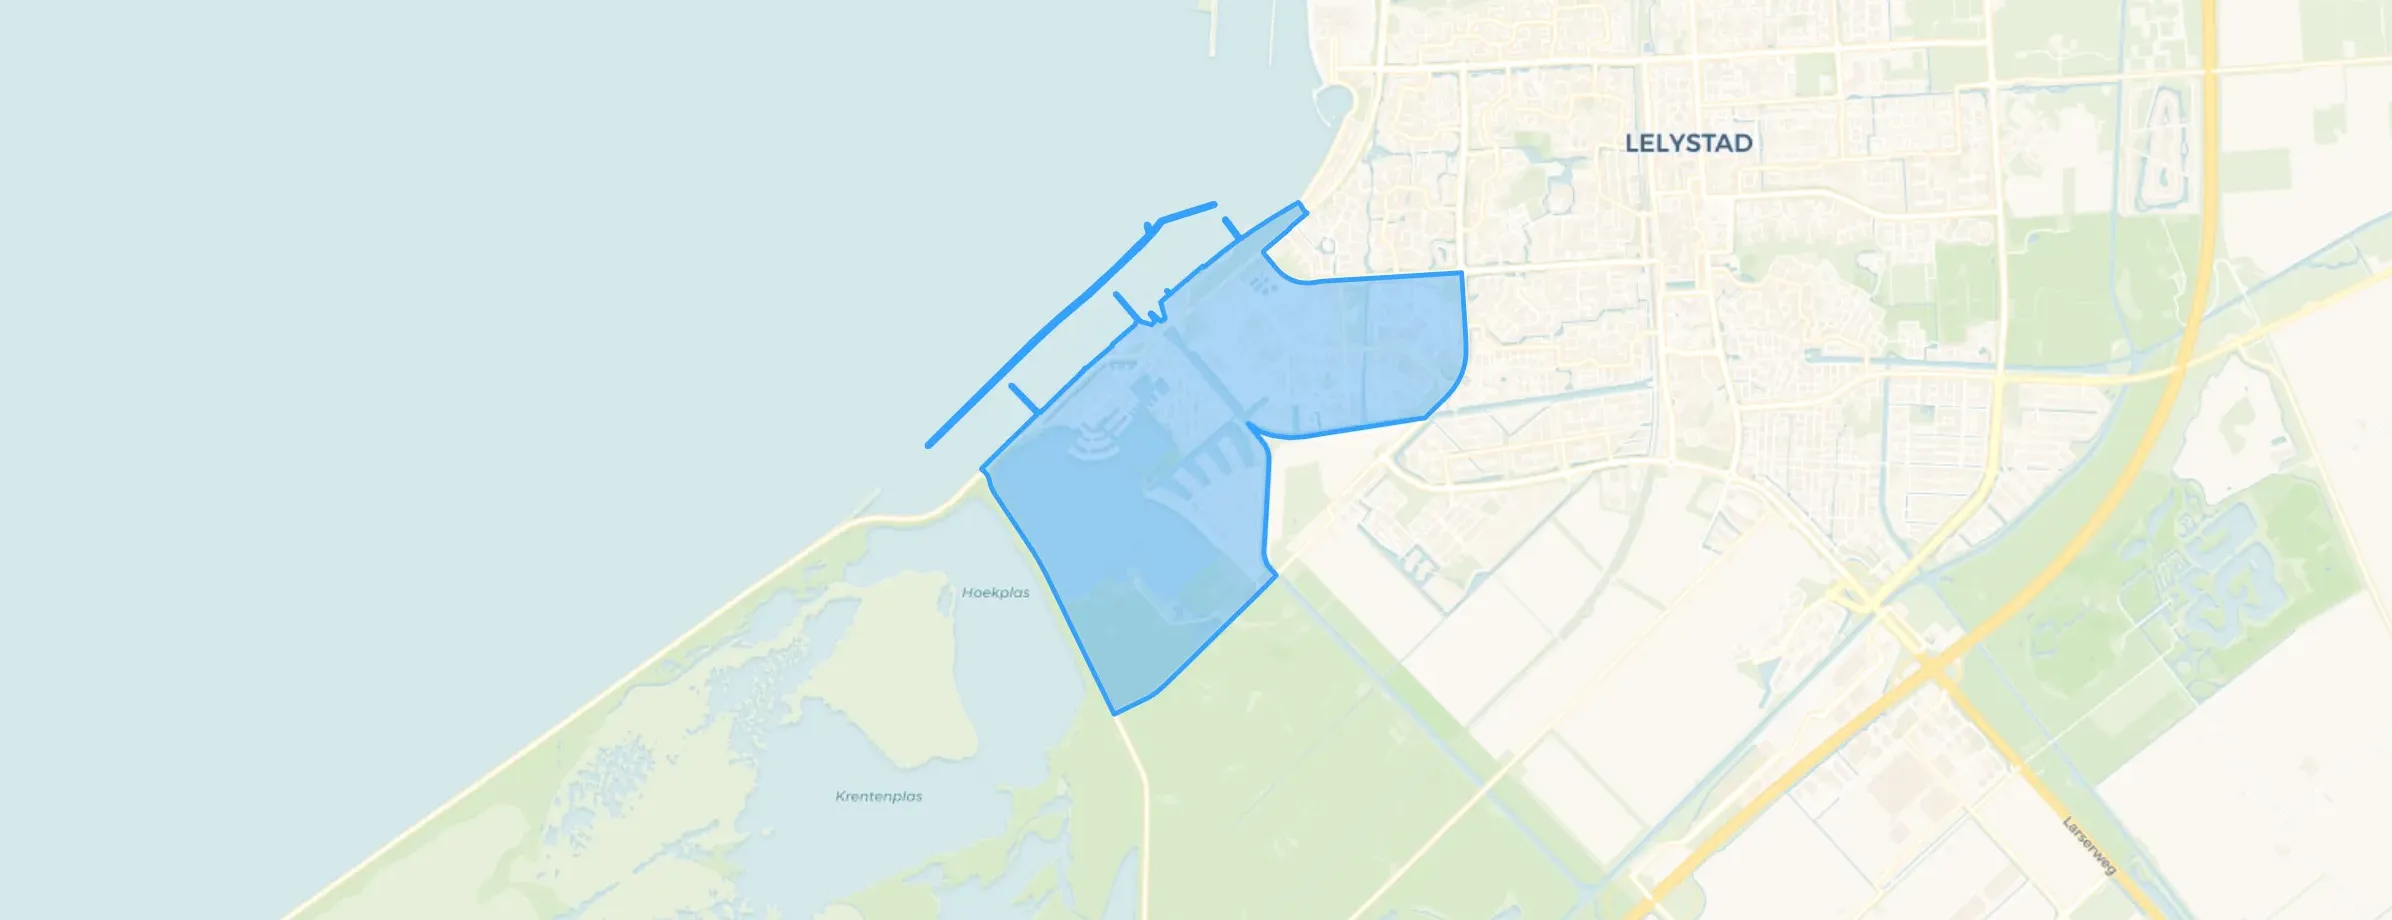
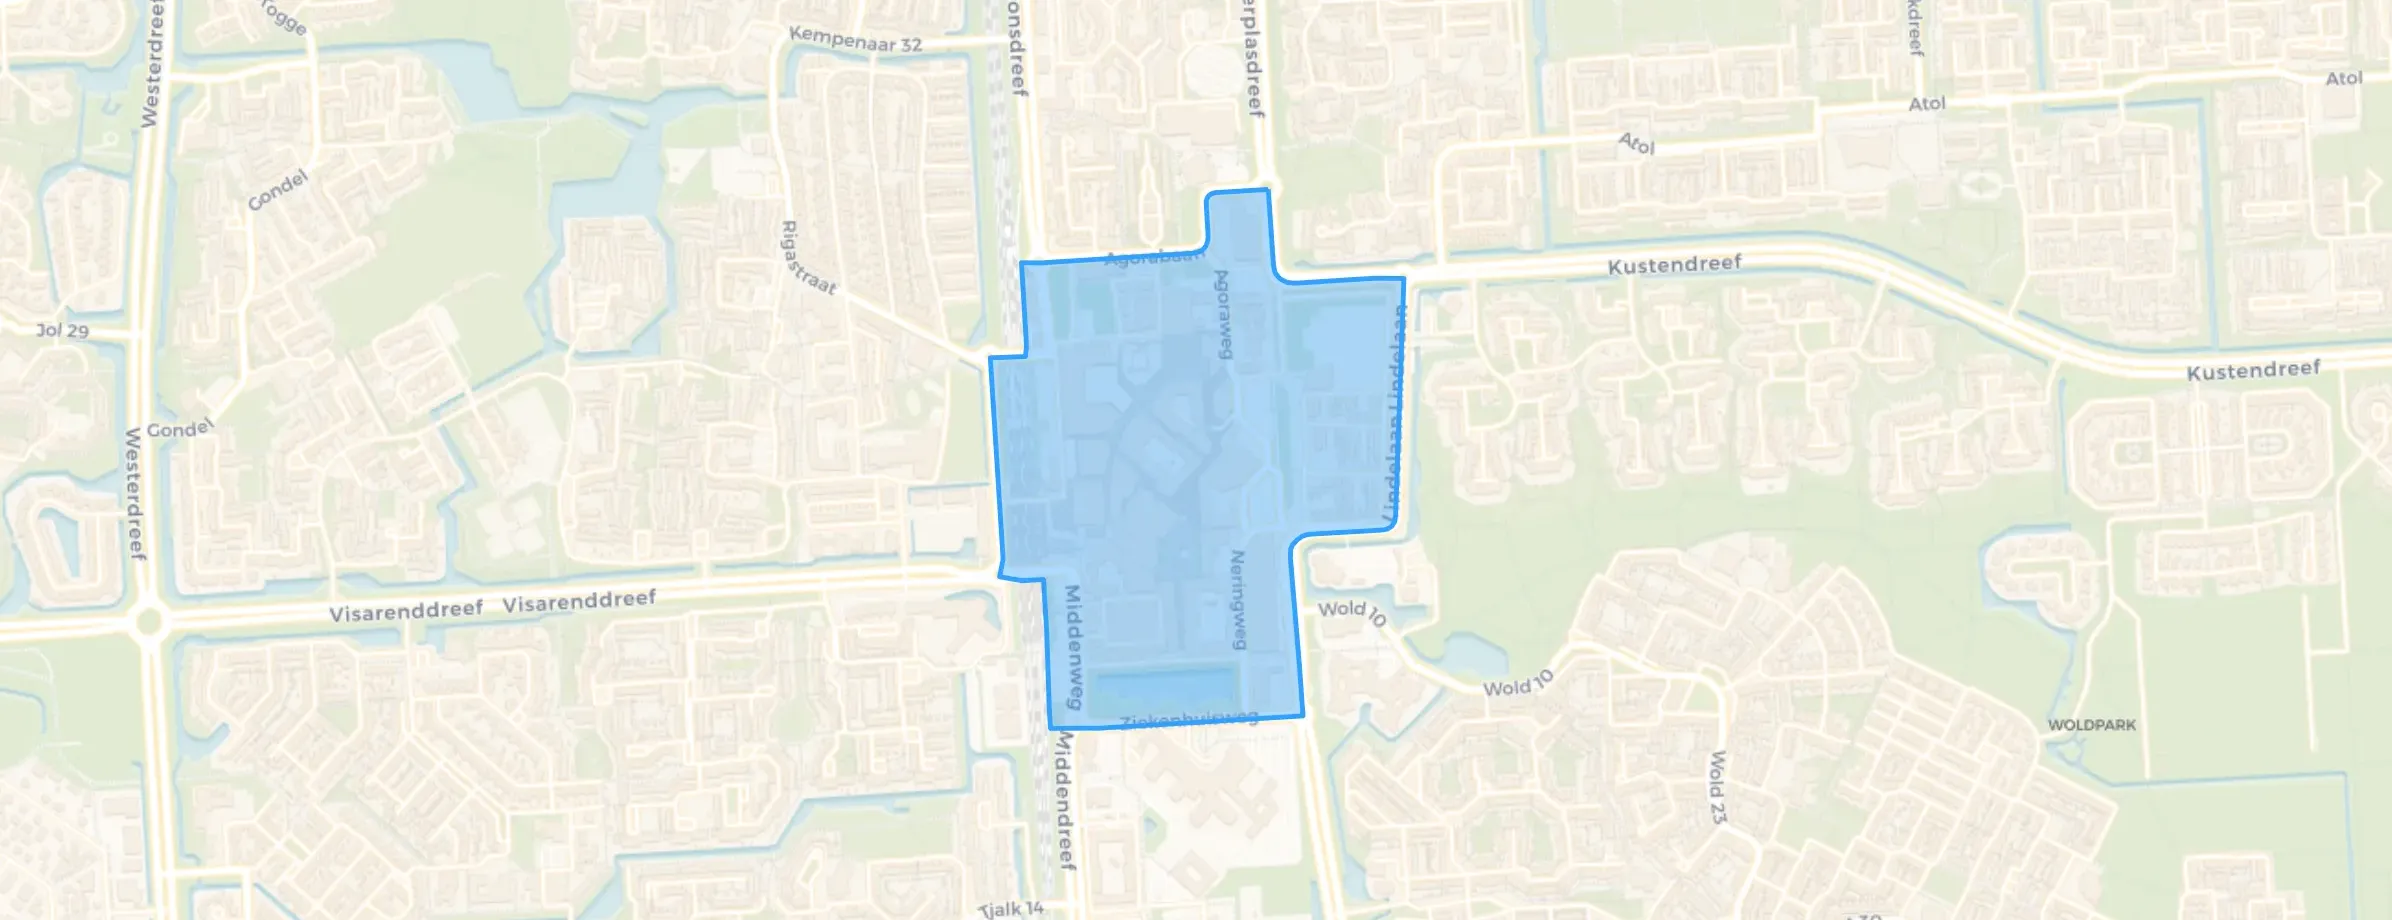
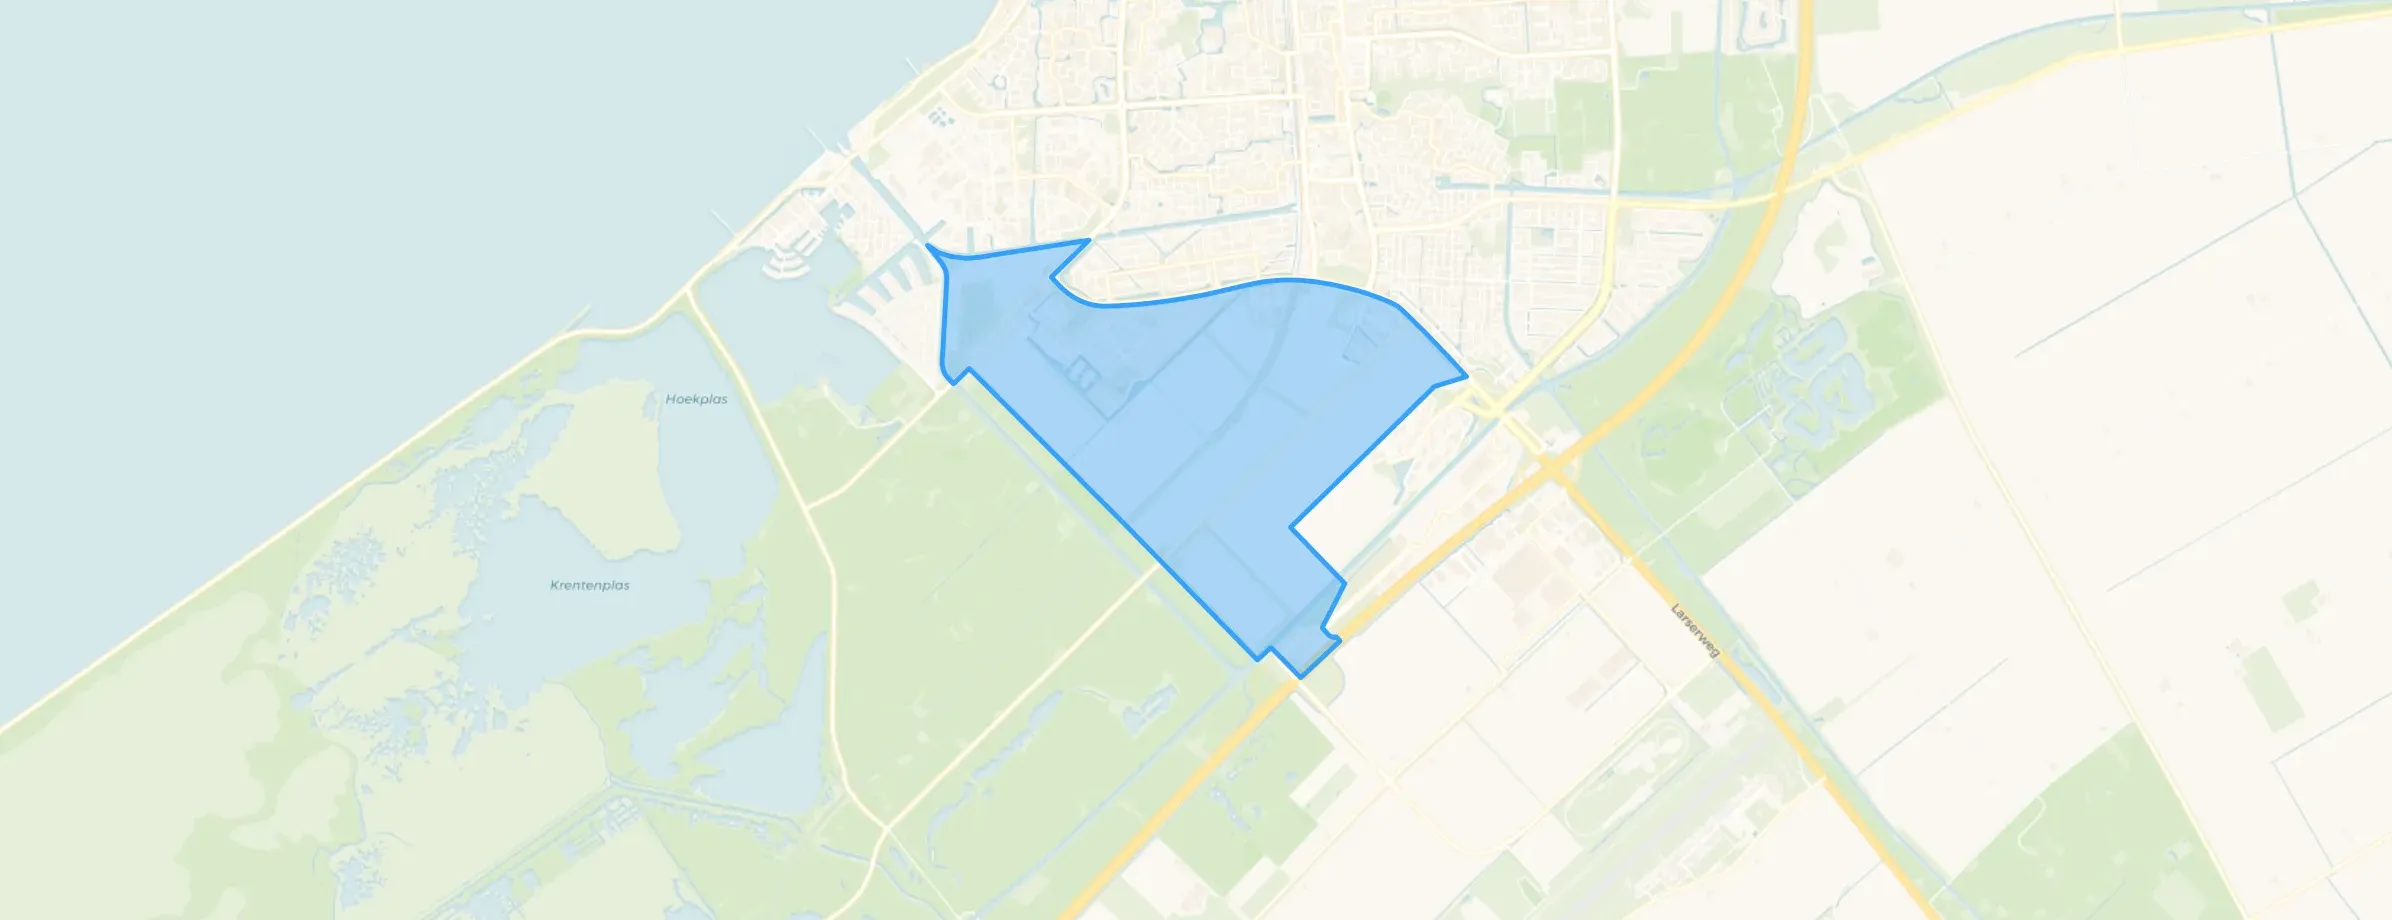
Lelystad is located in the province of Flevoland The municipality has a total area of 76.545 hectares, of which 22.900 hectares are land and 53.645 hectares are water. The municipality is coded as GM0995. The postcode area is 8211AA-8245LZ.
Lelystad has 84.080 residents. Of these, 50,3% are men and 49,7% are women. Most residents are 25 to 45 years (26,8%). The other age groups are 25,6% for '45 to 65 years', 18,2% for '65 years or older', 17,2% for '0 to 15 years' and 12,2% for '15 to 25 years'. Of the residents, 51,2% is unmarried, 35,7% is married, 9,1% is divorced and 3,9% is widowed. 51.309 residents originate from the Netherlands, 8.836 come from Europe and 23.935 come from countries outside Europe.
There are 37.057 households in Lelystad. 35,5% of these are single-person households, 27,0% households without children and 37,5% households with children. The average household size is 2,2 persons.
In Lelystad there are 64.000 income recipients. The average income per income recipient is €34.700, which is €1.100 (3%) lower than the national average of €35.800. Per resident, the average income is €27.800, which is €1.400 (5%) lower than the national average of €29.200. Most residents of Lelystad are educated to an intermediate level. 44,9% have an intermediate education (HAVO, VWO or MBO 2-4), 30,5% have a lower education (VMBO or MBO 1) and 24,6% have a university or higher professional education (HBO/WO).
Of the 84.080 residents, around 62% are in paid employment, which amounts to 52.130 people. This is 3% lower than the national average of 65%. The majority of workers are in salaried employment (86%), while 14% are self-employed. In Lelystad, 25% of residents receive a benefit. The largest group is those receiving a state pension (AOW). 13.560 people receive this benefit.
In Lelystad there are 35.058 homes with an average assessed value (WOZ) of €326.000. Of these, around 97% are occupied and 3% unoccupied. Most homes are owner-occupied. This amounts to 38% rental homes and 62% owner-occupied homes. Of the homes, 62% privately owned, 28% owned by housing associations and 10% owned by other landlords. The most common construction periods in Lelystad are 1970-1980 (34%) and 1980-1990 (24%).
There are currently no homes for sale in Lelystad. The most recently listed home is Parnassialaan 7 by Buisman Makelaars op Funda. No homes were sold in Lelystad over the past year.
There are currently no homes for rent in Lelystad. The most recent home is Ringdijk 191, offered by ViaDaan op Pararius. No homes were let in Lelystad over the past year.
No recent rental data available for Lelystad.
In Lelystad there are 37.136 addresses with a registered energy label. The most common labels are C (41%), A (27%) and B (22%). On average, an address in Lelystad uses 2.850 kWh of electricity per year. This is 1% above the national average of 2.810 kWh. With an annual consumption of 850 m³ per address, natural gas consumption is 34% below the national average of 1.280 m³.
Due to poor power supply, we want to move quickly.
Auto-translated to English by AIA lot of nuisance because owner-occupied and social rented homes are mixed in the neighbourhood. High unemployment, low-skilled people, subletting, noise pollution, loud music, shouting, firework nuisance, and drug nuisance from young people driving around in expensive cars at the strangest times, and dealing youngsters on fatbikes. In addition, all roads and pavements in the neighbourhood are rotten or sunken, and many houses look neglected or completely rotten on the outside.
Auto-translated to English by AIEvery man for himself. No sense of community in the neighbourhood.
Auto-translated to English by AIIncrease in unsafety; expensive cars are speeding and revving at the strangest times, causing noise pollution for the living environment. These are mainly young boys with a cultural background who think the whole neighbourhood belongs to them and that they can make quick money this way. Additionally, the roads, paving, and lighting are very poor. And I see an increase in my area of a group of young people who are at risk of sliding into criminality. They drive back and forth in the neighbourhoods on fatbikes that they could not possibly have obtained honestly. Also, a lot of waste and litter in the neighbourhood.
Auto-translated to English by AI- Good, involved neighbourhood, everyone knows each other. - The bus runs every half hour to the station. From 0530 to 2359. Which is very convenient for those who want to go to the city or beyond. The station is less than 10 minutes from the Schoener. - Houses are reasonably old, so there is a lot of draught and mice in winter. Mould is also something that remains a big problem.
Auto-translated to English by AINice quiet neighbourhood, only decent friendly people live here, good fun contacts with the neighbours, and they also keep a good eye on strange events in the area.
Auto-translated to English by AILittle solidarity, little social contact
Auto-translated to English by AIQuiet neighbourhood. Children can play outside safely. The location is very good, animal park/nature nearby. Shops easily accessible.
Auto-translated to English by AI
The housing stock is relatively young — 70% dates from after 1990. In addition, the most common type is terraced houses (47%).
Over the past year a home for sale in Lelystad was listed for an average of €487,815 (€3,432 per m²). Last quarter prices rose by 21%.
A rental home in Lelystad cost an average of €1,710 per month (€16 per m²).
Residents give Lelystad a 7.0 out of 10 based on 35 reviews. Nature and greenery stands out with a 7.9; cleanliness lags behind with a 6.5.
Gemeente Lelystad has 84,080 residents. Many families: 38% of the households have children.
The housing supply in Lelystad is remarkably efficient: 79% has an A, A+ or B label. The average natural gas consumption per household is 850 m³ per year.
From Lelystad you can on average reach a supermarket at 1.1 km, a GP at 1.2 km, a railway station at 3.0 km, a primary school at 0.9 km (as the crow flies, source: CBS).
Right now you will find 291 homes for sale and 39 homes for rent in Lelystad.

Buurtje.nl uses cookies to make the site work and to improve it. In doing so, we process data such as your IP address and the pages you visit.
We use this data for three purposes: running the website (functional), measuring visits so we can improve Buurtje.nl (analytics), and — if you allow it — tailoring ads to your interests (marketing).
How we handle your data is described in our privacy policy. You can change your preferences at any time via 'Cookie preferences' at the bottom of every page.
Choose per category which cookies we may place. Read more in our privacy policy.