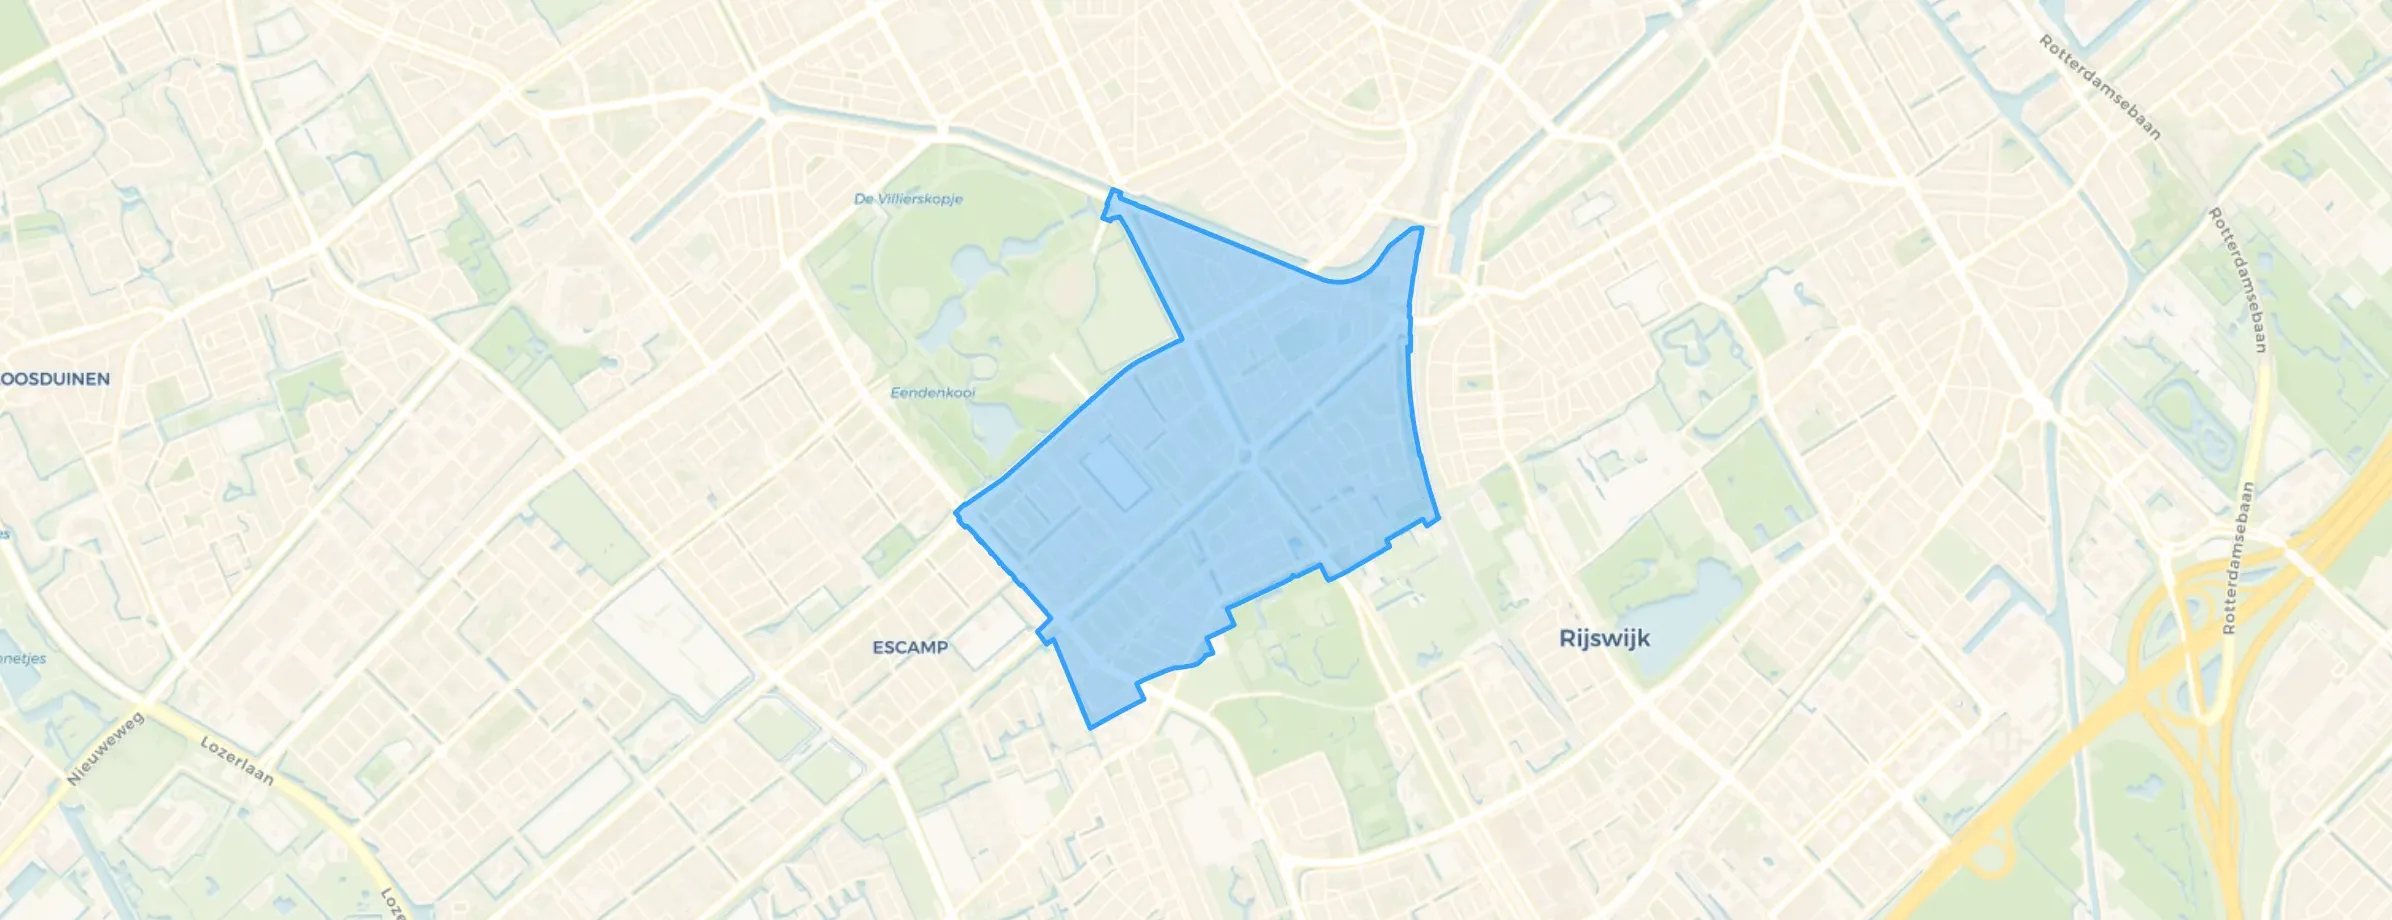
District in Den Haag
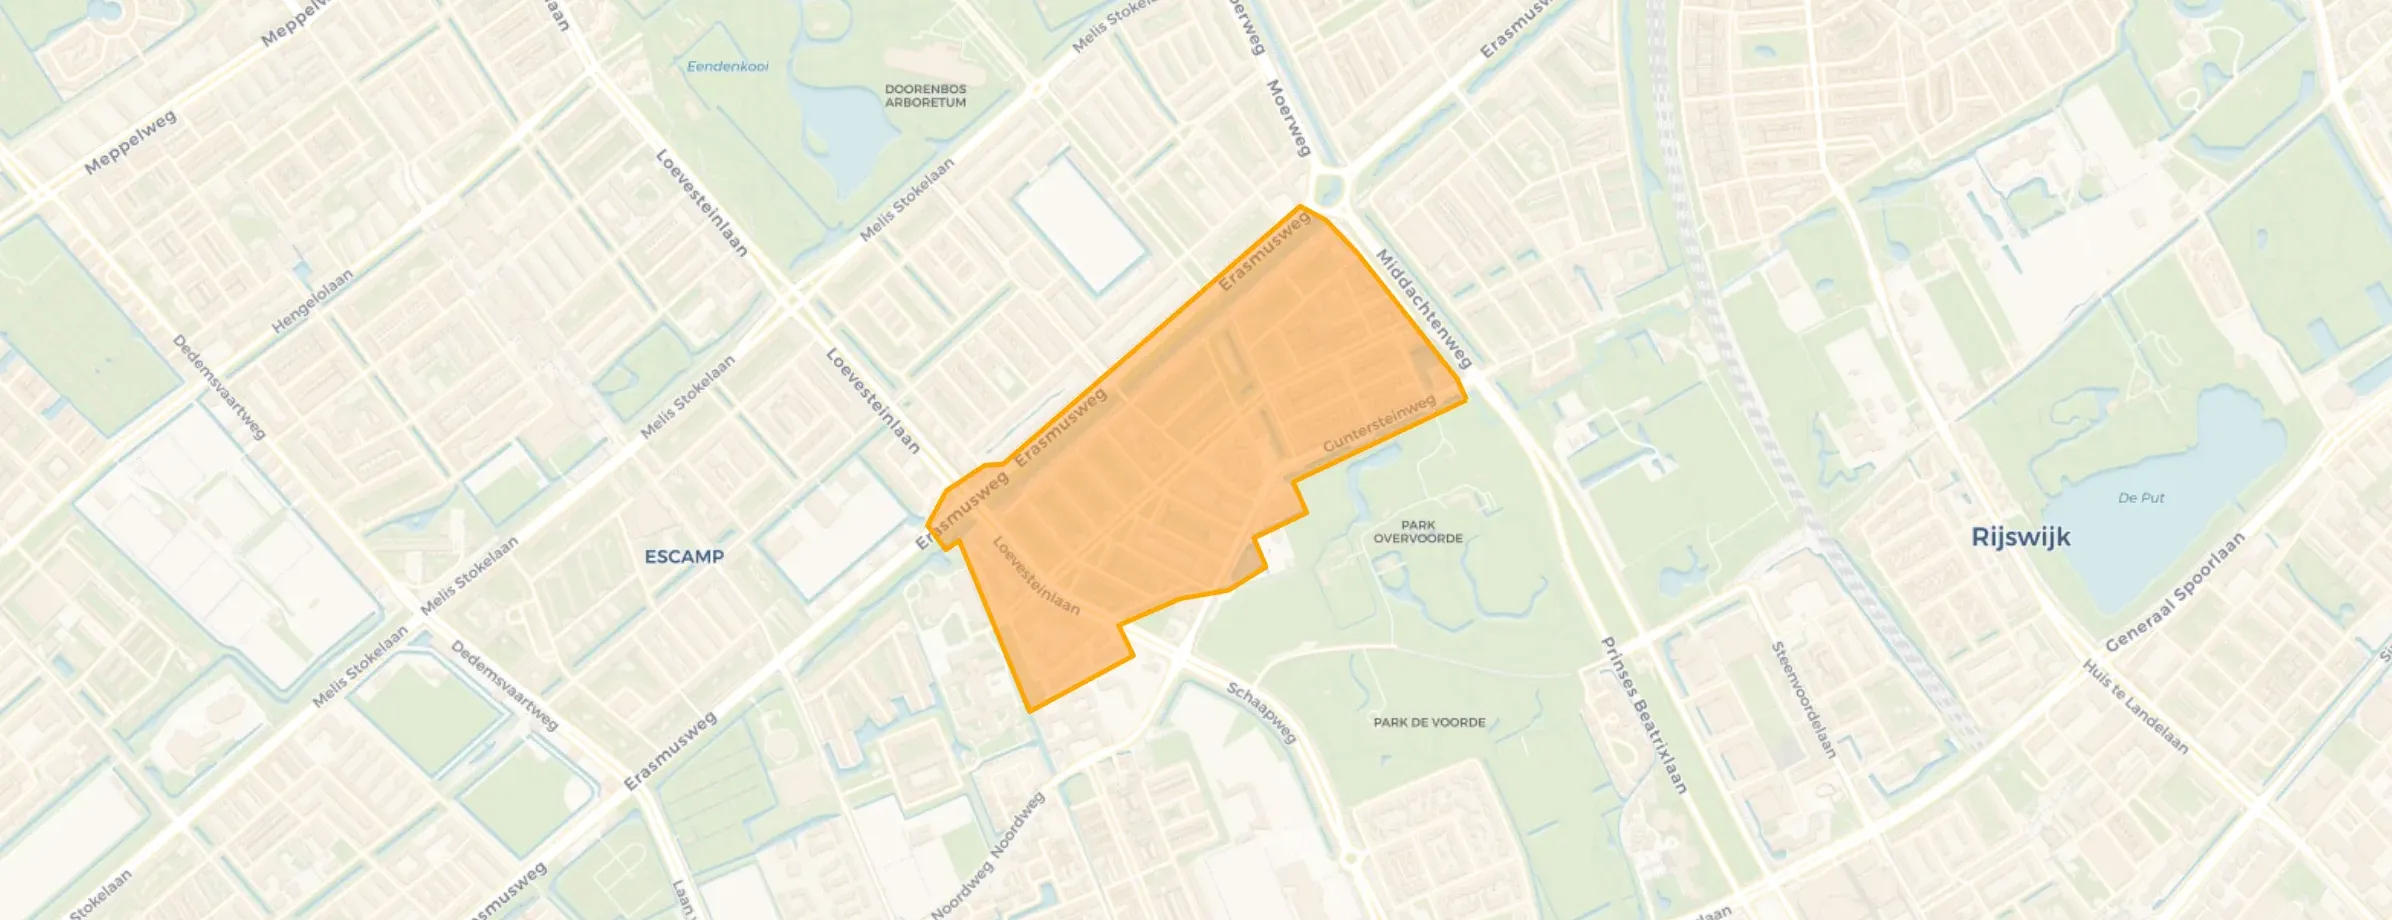
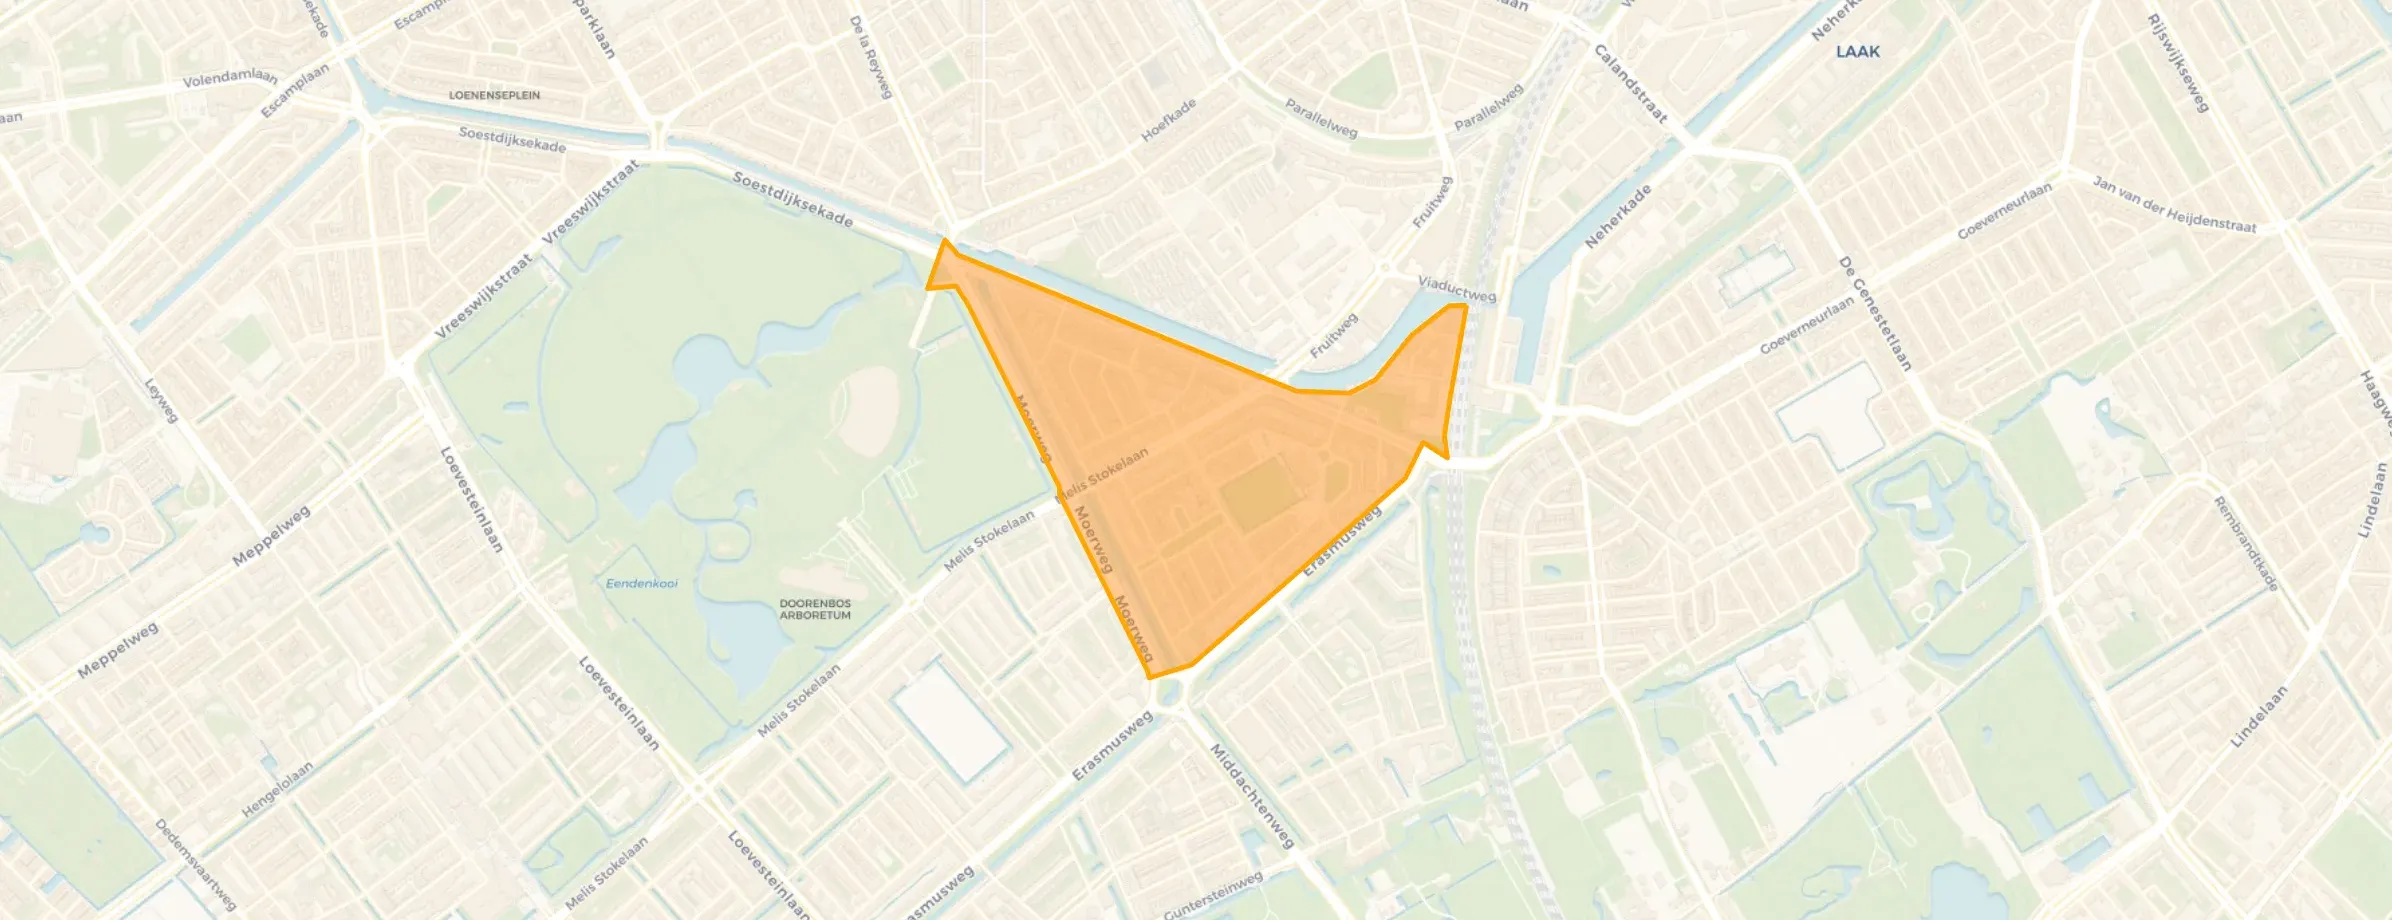
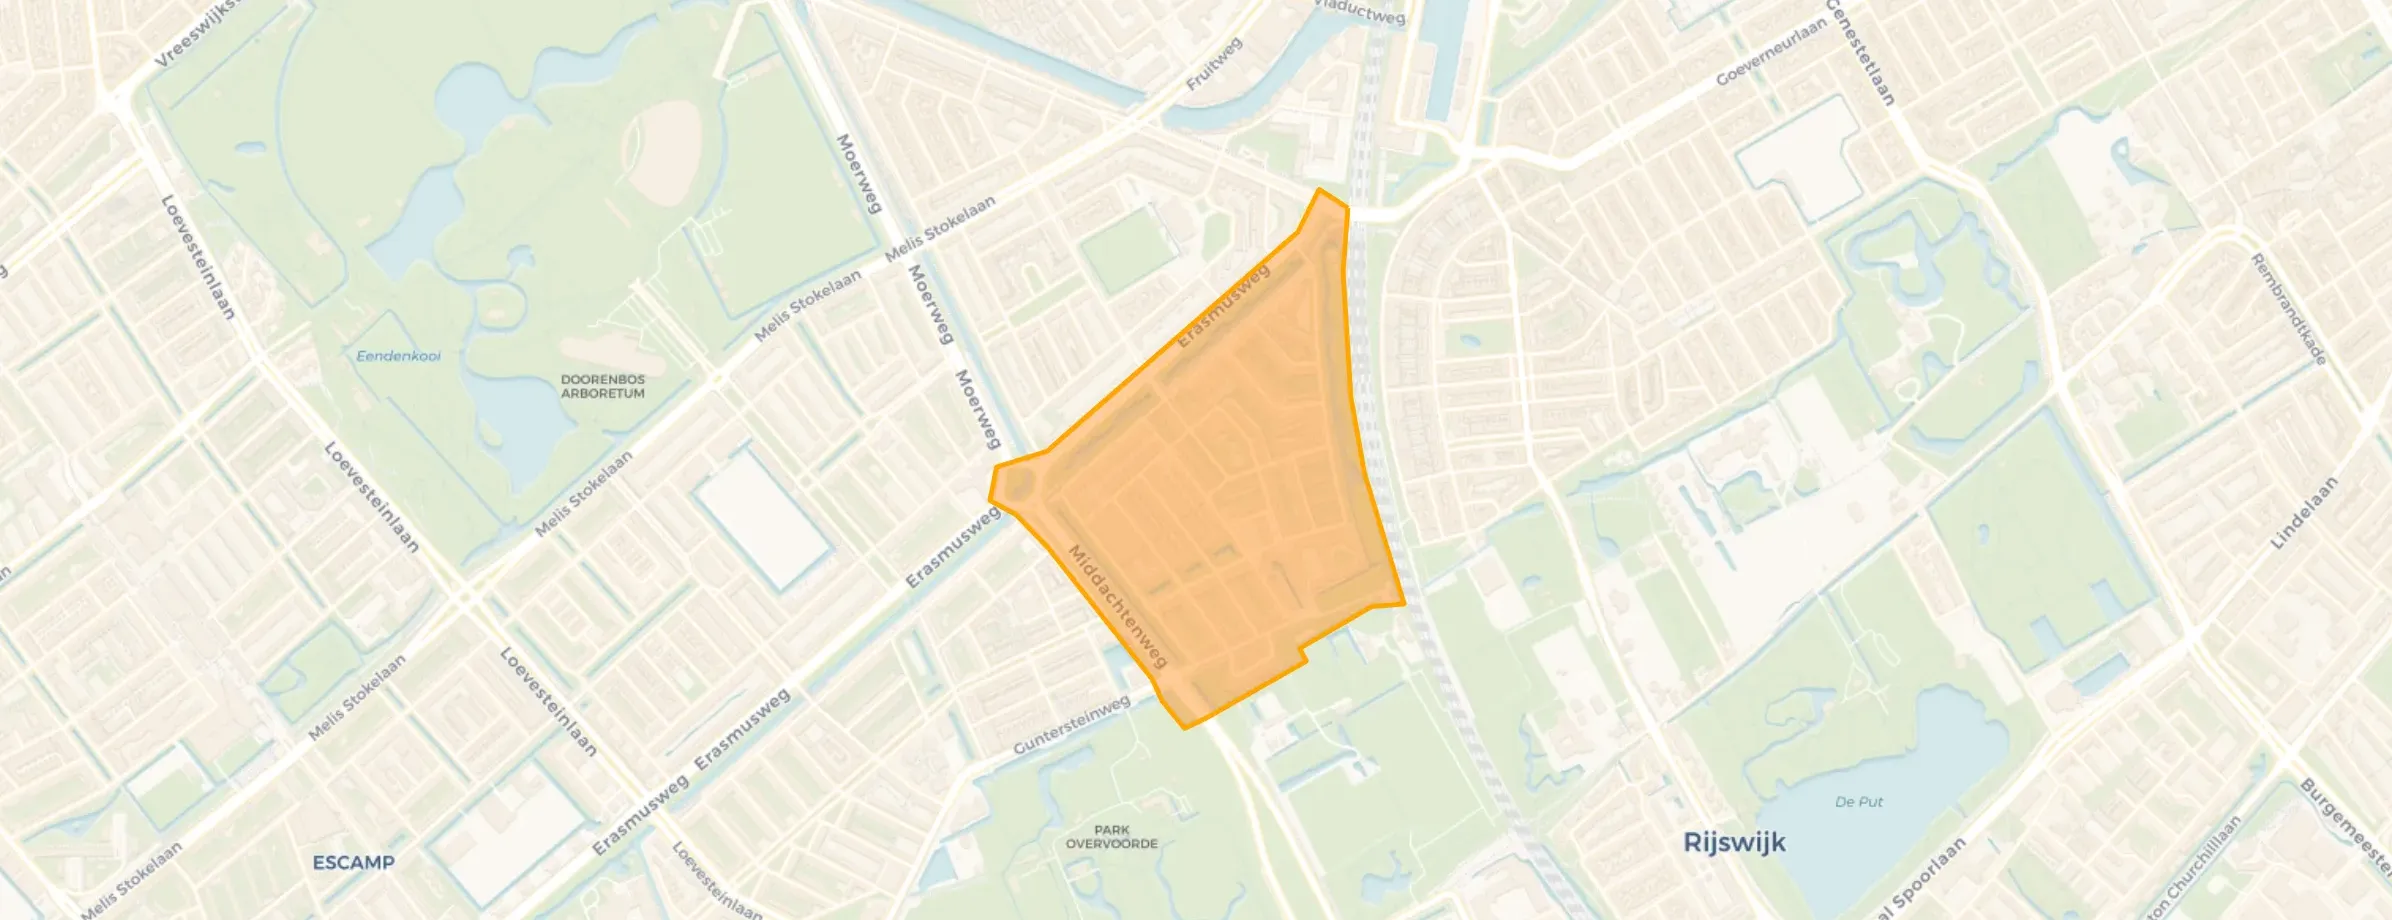
Moerwijk is located in the province of Zuid-Holland, in the municipality of Den Haag The district has a total area of 180 hectares, of which 178 hectares are land and 2 hectares are water. The district is coded as WK051836. The postcode area is 2531AA-2541EA.
Moerwijk has 21.640 residents. Of these, 52,7% are men and 47,3% are women. Most residents are 25 to 45 years (32,1%). The other age groups are 24,7% for '45 to 65 years', 18,8% for '0 to 15 years', 12,7% for '15 to 25 years' and 11,6% for '65 years or older'. Of the residents, 62,2% is unmarried, 23,6% is married, 11,6% is divorced and 2,5% is widowed. 4.165 residents originate from the Netherlands, 3.265 come from Europe and 14.215 come from countries outside Europe.
There are 11.120 households in Moerwijk. 54,4% of these are single-person households, 15,2% households without children and 30,4% households with children. The average household size is 1,9 persons. The national average is 2,1 persons.
In Moerwijk there are 16.200 income recipients. The average income per income recipient is €30.400, which is €11.800 (28%) lower than the national average of €42.200. Per resident, the average income is €23.500, which is €11.400 (33%) lower than the national average of €34.900. Most residents of Moerwijk are educated to a lower level. 48,8% have a lower education (VMBO or MBO 1), 34,7% have an intermediate education (HAVO, VWO or MBO 2-4) and 16,5% have a university or higher professional education (HBO/WO).
Of the 21.640 residents, around 58% are in paid employment, which amounts to 12.551 people. This is 14% lower than the national average of 72%. The majority of workers are in salaried employment (75%), while 25% are self-employed. In Moerwijk, 28% of residents receive a benefit. The largest group is those receiving a social assistance benefit. 2.320 people receive this benefit.
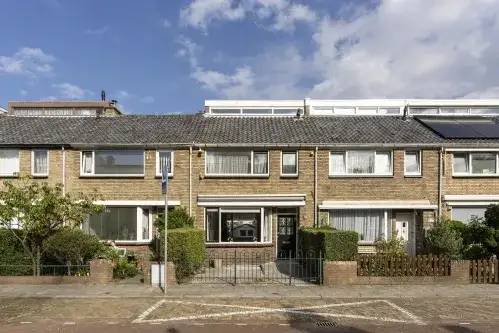
In Moerwijk there are 10.585 homes with an average assessed value (WOZ) of €230.000. Of these, around 95% are occupied and 5% unoccupied. Most homes are rental properties. This amounts to 83% rental homes and 17% owner-occupied homes. Of the homes, 17% privately owned, 66% owned by housing associations and 17% owned by other landlords. The most common construction periods in Moerwijk are 1950-1970 (61%) and 1925-1950 (17%).
There are currently no homes for sale in Moerwijk. The most recently listed home is Schoonhetenstraat 117 by Olsthoorn NVM Makelaars op Funda. No homes were sold in Moerwijk over the past year.
There are currently no homes for rent in Moerwijk. The most recent home is Van Maerlantlaan 36, offered by www.woonnet-haaglanden.nl. No homes were let in Moerwijk over the past year.
No recent rental data available for Moerwijk.
In Moerwijk there are 9.631 addresses with a registered energy label. The most common labels are A (27%), C (18%) and B (14%). On average, an address in Moerwijk uses 1.770 kWh of electricity per year. This is 31% below the national average of 2.550 kWh. With an annual consumption of 660 m³ per address, natural gas consumption is 18% below the national average of 800 m³.
The neighbourhood is quite dirty. Many alcoholics and drug addicts are visible on the street, which is why I wouldn't call it safe, especially after dark. Not to mention the constant firecracker noise. The apartments are adequate, and renovations are ongoing.
Auto-translated to English by AIAll rotten experiences threats not feeling safe too much subletting to illegal cars daily car windows smashed too much aggression feral cats attacking poor hygiene throwing everything in the garden on the street next to the rubbish bin seems like every day bulky waste in the neighbourhood it's like a ghetto.
Auto-translated to English by AII am being threatened and shouted at, I have already contacted the housing association and the police, it makes no difference and nothing is done about it.
Auto-translated to English by AIis not so good
Auto-translated to English by AII've lived here for 9 years, the only serious incident I've experienced is that once there was a shooting with a weapon in the back garden behind me, but otherwise it's a cosy neighbourhood.
Auto-translated to English by AIHhh
Auto-translated to English by AIMany threats, not safe, and residents don't follow the rules, rude and aggressive, and household waste is everywhere, especially in the gardens. A lot of trouble with pests.
Auto-translated to English by AIIt's bad, many are threatened, police, housing association and municipality don't really cooperate, they don't prioritise protecting and helping residents.
Auto-translated to English by AIThe housing stock is mainly post-war — 51% was built between 1945 and 1990. In addition, the most common type is flats (91%).
Over the past year a home for sale in Moerwijk was listed for an average of €317,062 (€4,024 per m²). That is 40% below the Dutch national average. Last quarter prices fell by 6%.
Residents give Moerwijk a 6.3 out of 10 based on 11 reviews. Especially nature and greenery (8.8) scores well; housing (5.7) receives the lowest rating.
Wijk Moerwijk has 21,640 residents. The largest age group is 25 to 45 years (32%). Notably, 54% of the households are single-person households.
From Moerwijk you can on average reach a supermarket at 0.6 km, a GP at 0.7 km, a railway station at 1.9 km, a primary school at 0.5 km (as the crow flies, source: CBS).
Right now you will find 47 homes for sale and 14 homes for rent in Moerwijk.