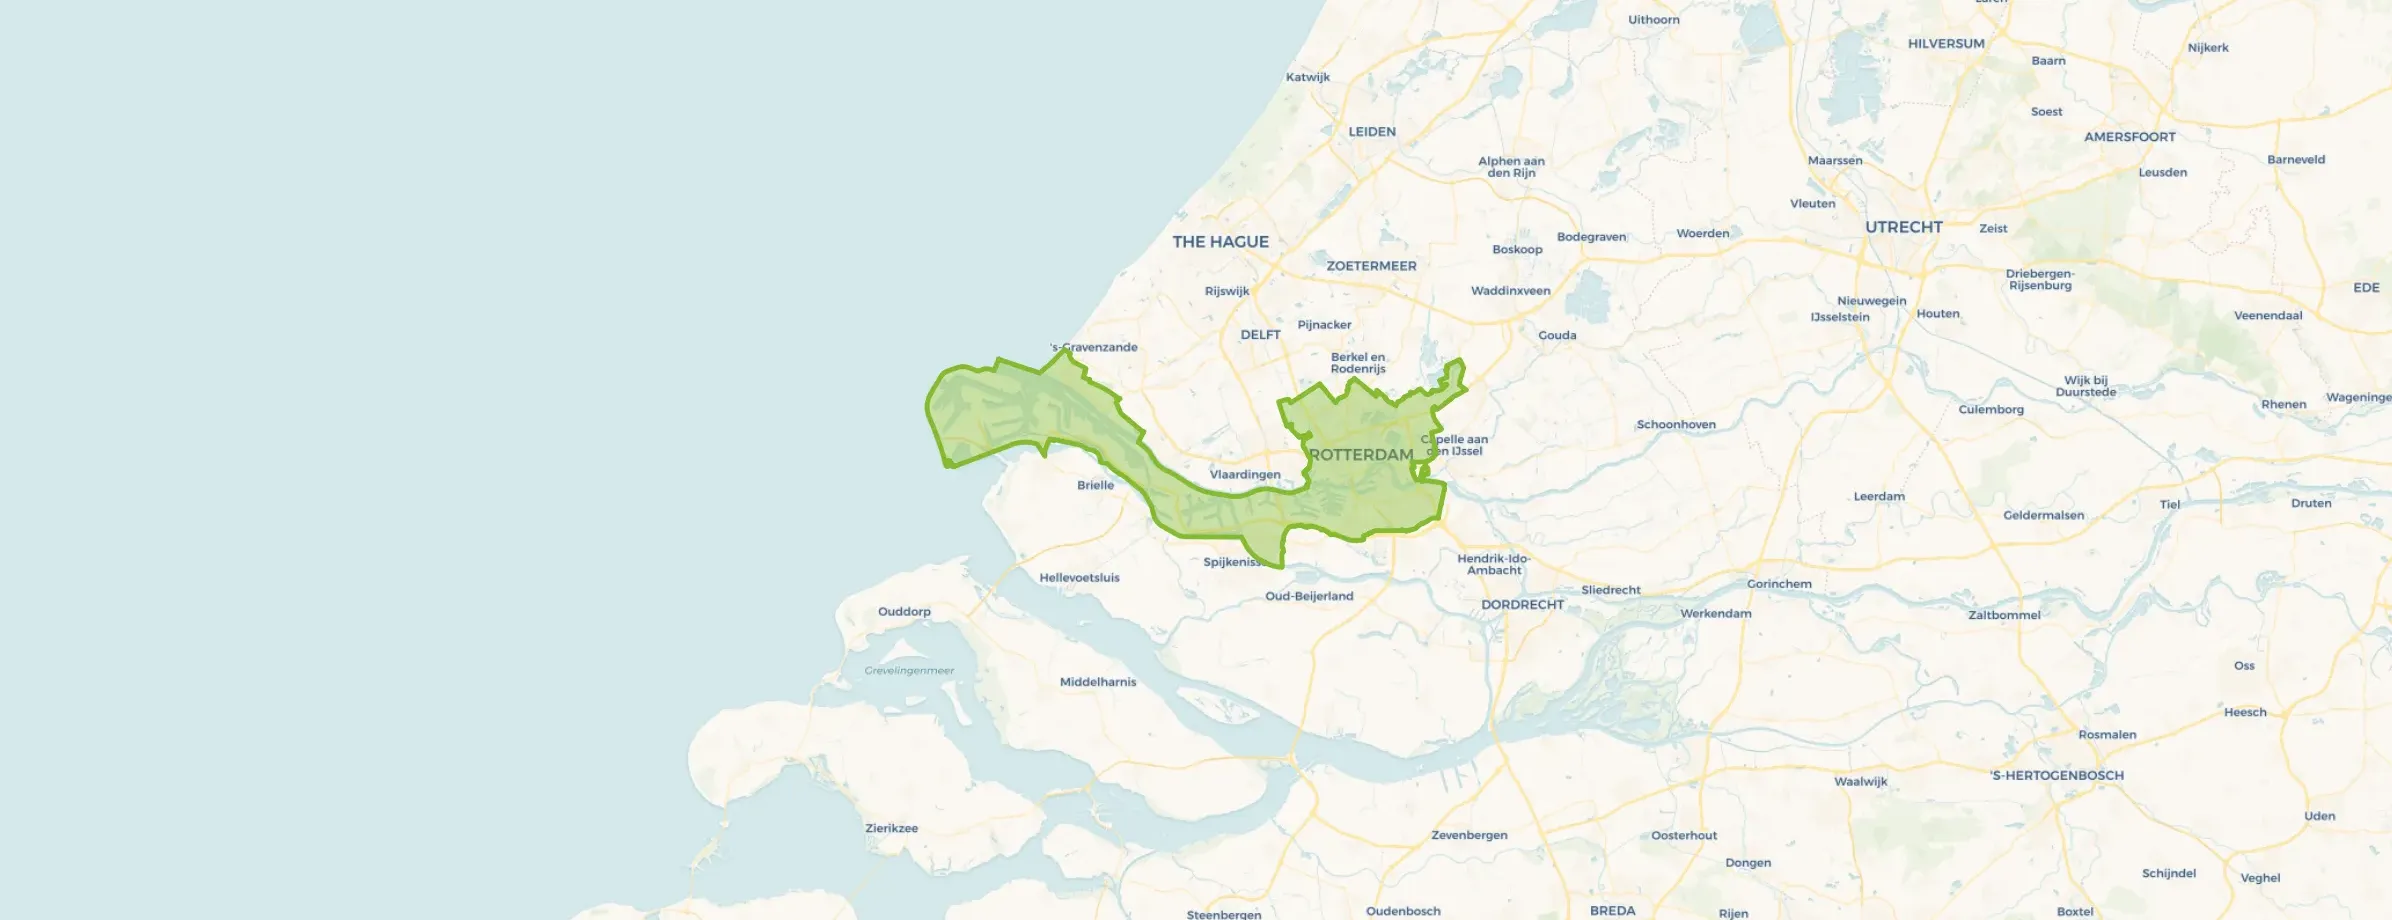
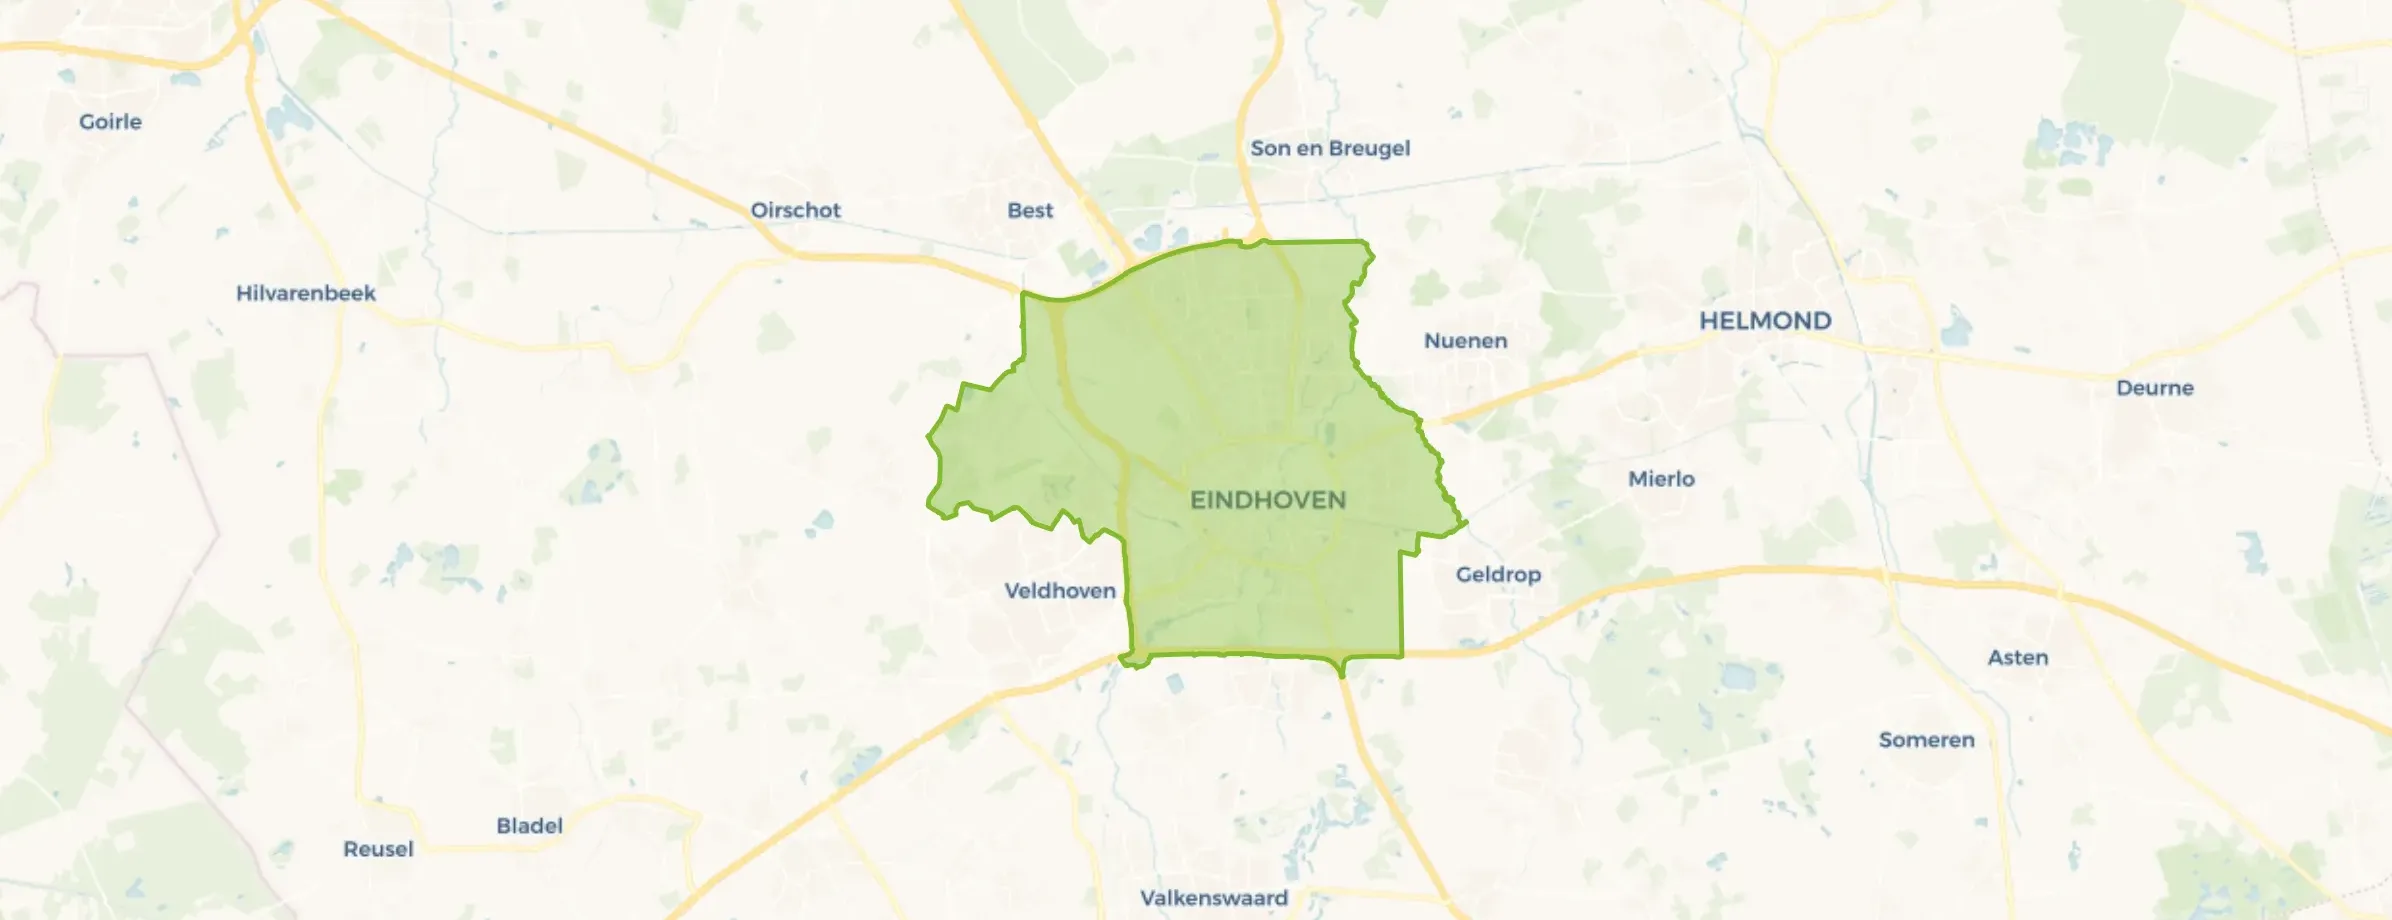
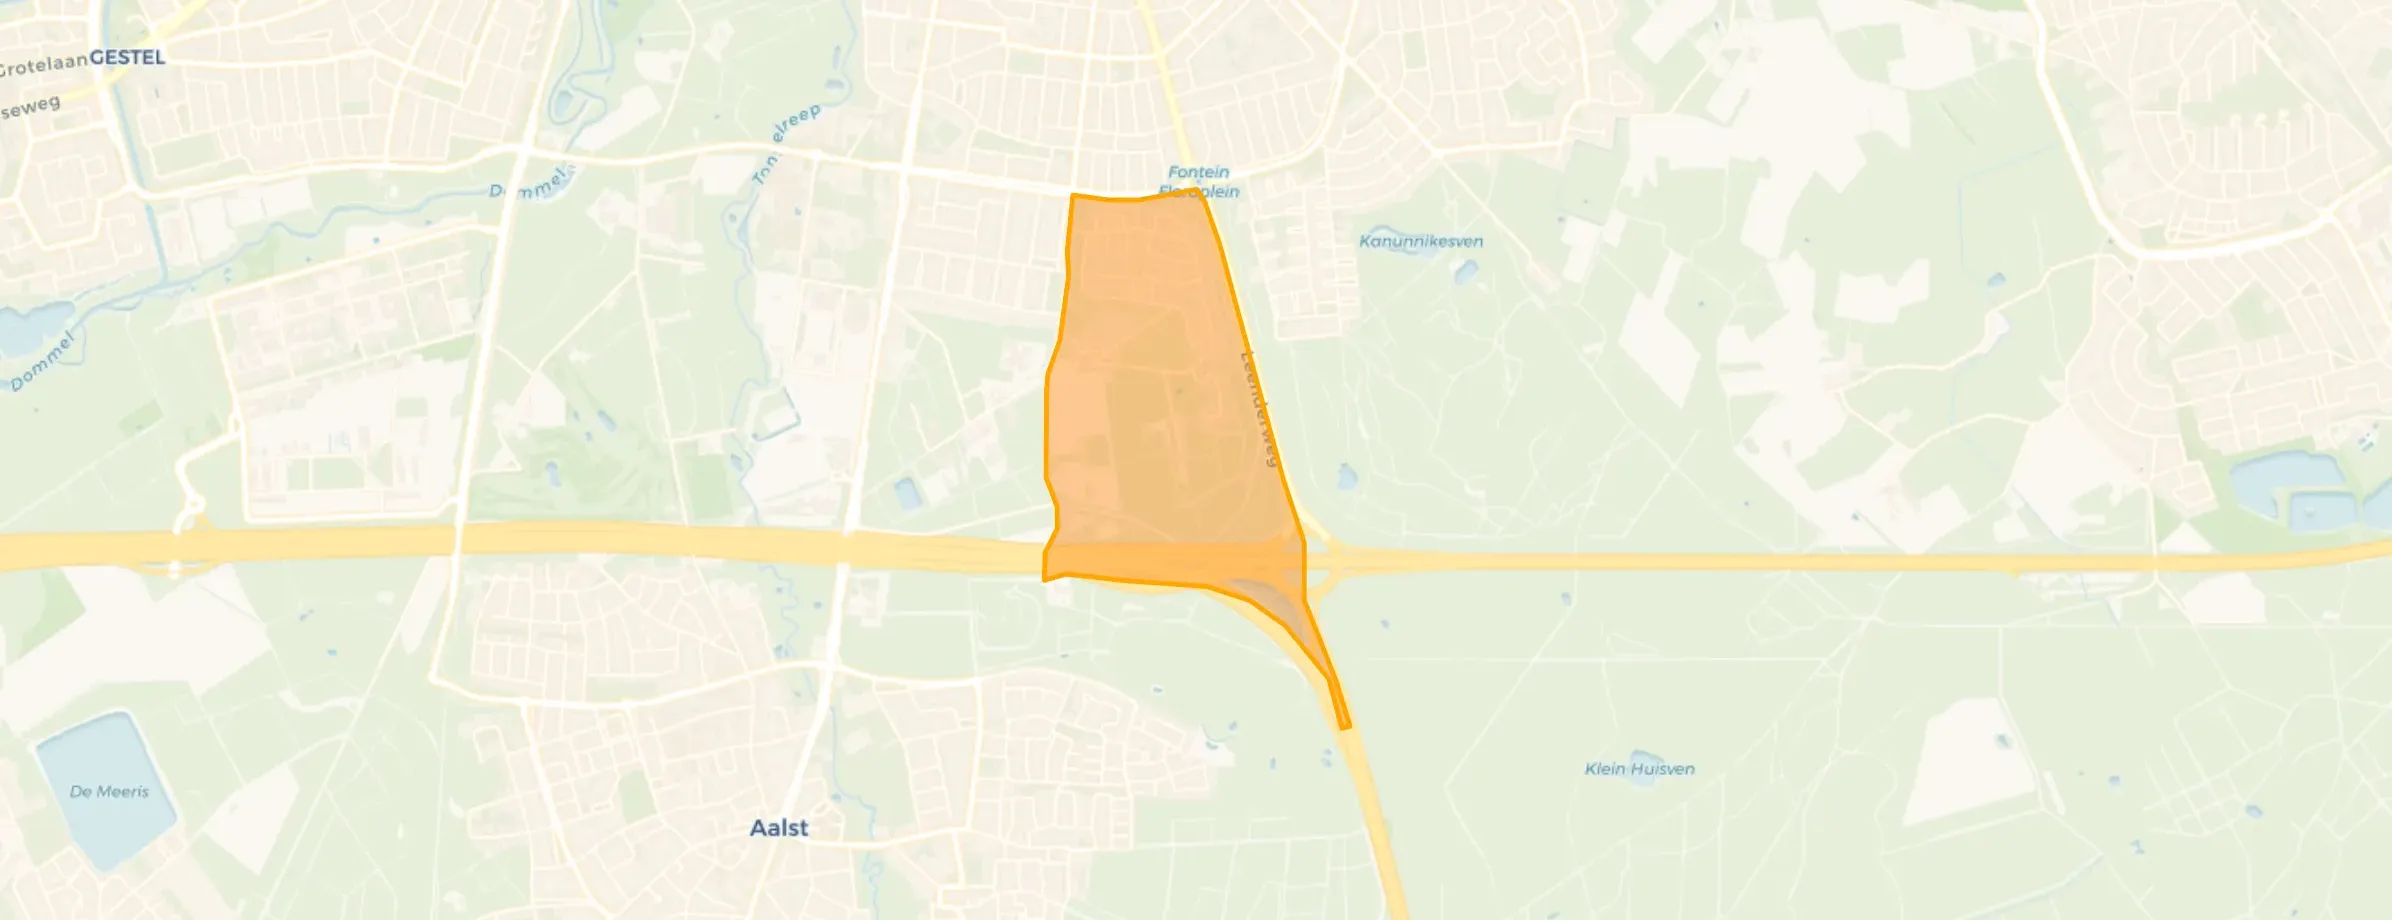
Kortonjo is located in the province of Noord-Brabant, in the municipality of Eindhoven. The district has a total area of 322 hectares, of which 319 hectares are land and 3 hectares are water. The district is coded as WK077222. The postcode area is 5644AA-5644TV.
Kortonjo has 8.930 residents. Of these, 49,8% are men and 50,2% are women. Most residents are 45 to 65 years (26,0%). The other age groups are 24,9% for '25 to 45 years', 19,4% for '65 years or older', 15,1% for '15 to 25 years' and 14,7% for '0 to 15 years'. Of the residents, 57,1% is unmarried, 30,1% is married, 7,6% is divorced and 5,2% is widowed. 6.265 residents originate from the Netherlands, 1.130 come from Europe and 1.535 come from countries outside Europe.
There are 4.345 households in Kortonjo. 46,4% of these are single-person households, 23,5% households without children and 30,1% households with children. The average household size is 2,0 persons. The national average is 2,1 persons.
In Kortonjo there are 7.100 income recipients. The average income per income recipient is €48.900, which is €6.700 (16%) higher than the national average of €42.200. Per resident, the average income is €40.400, which is €5.500 (16%) higher than the national average of €34.900. Most residents of Kortonjo are highly educated. 50,3% have a university or higher professional education (HBO/WO), 30,1% have an intermediate education (HAVO, VWO or MBO 2-4) and 19,6% have a lower education (VMBO or MBO 1).
Of the 8.930 residents, around 73% are in paid employment, which amounts to 6.519 people. This is 1% higher than the national average of 72%. The majority of workers are in salaried employment (81%), while 19% are self-employed. In Kortonjo, 24% of residents receive a benefit. The largest group is those receiving a state pension (AOW). 1.550 people receive this benefit.
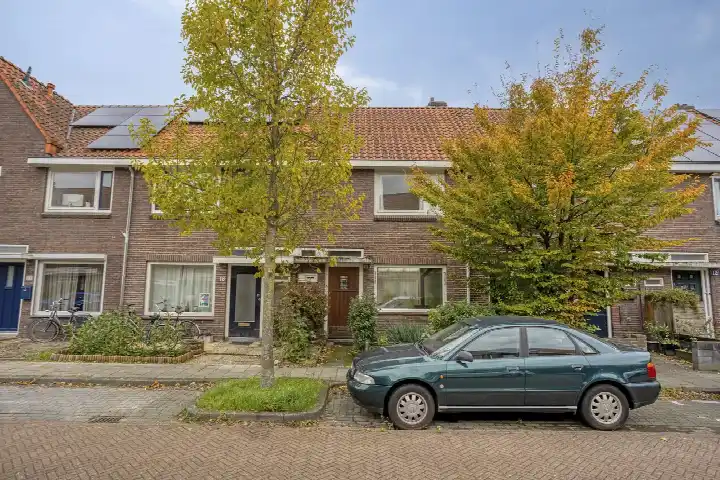
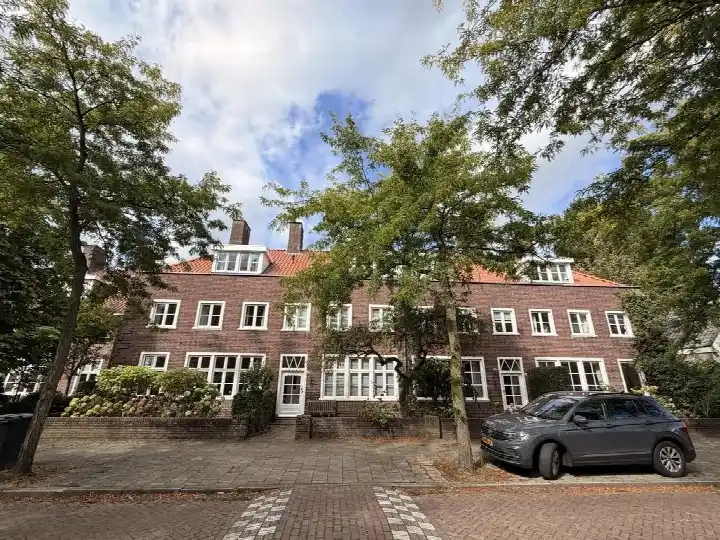
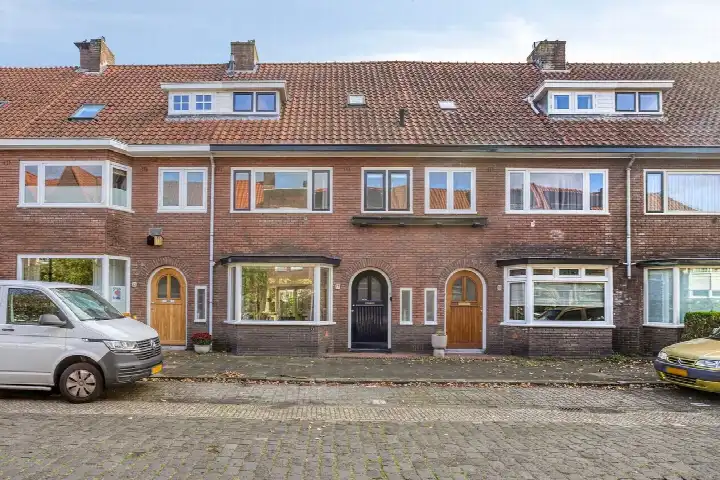
In Kortonjo there are 4.132 homes with an average assessed value (WOZ) of €489.000. Of these, around 95% are occupied and 5% unoccupied. Most homes are owner-occupied. This amounts to 40% rental homes and 60% owner-occupied homes. Of the homes, 60% privately owned, 27% owned by housing associations and 13% owned by other landlords. The most common construction periods in Kortonjo are 1925-1950 (41%) and 1950-1970 (23%).
There are currently 56 homes for sale in Kortonjo. The most recently listed home is Roostenlaan 122 by Zicht Op Wonen op Funda. Over the past year, 153 homes were sold in Kortonjo. On average, a home was sold within 47 days.
The average asking price for a home for sale in Kortonjo over the past year was €574.235. This is 17% higher than the average assessed value (WOZ) of €489.000. The average asking price per m² of floor area is €5.198.
There are 7 homes for rent in Kortonjo. The most recent home is Leostraat 55, offered by iQ Makelaars Eindhoven op Vastgoed Nederland. Over the past year, 6 homes were let in Kortonjo. On average, a listing was let within 25 days.
The average rent for a rental home in Kortonjo over the past year was €1.426 per month. Per m² of floor area that is €17 per month.
In Kortonjo there are 2.780 addresses with a registered energy label. The most common labels are A (24%), C (19%) and B (14%). On average, an address in Kortonjo uses 2.530 kWh of electricity per year. This is 1% below the national average of 2.550 kWh. Natural gas consumption, at 1.010 m³ per year, is 26% above the national average of 800 m³.
Nice quiet neighbourhood, all amenities nearby.
Auto-translated to English by AIL
Auto-translated to English by AIIt's a nice, safe neighbourhood where you can raise children, have peace and quiet, and easily do activities. It's also very accessible to the city centre.
Auto-translated to English by AIquiet neighbourhood
Auto-translated to English by AIThe neighbours are generally okay, but we have a lot of trouble with mess (rubbish everywhere, and by the bins and surroundings there's almost every day so much junk) and we also suffer from very cheeky screaming, swearing and mess-making, thing-destroying kids. Lately we also have a lot of trouble with junkies, tramps and other scum in the playground!!. Otherwise it's okay, right??
Auto-translated to English by AIThe most common type is terraced houses (45%).
Over the past year a home for sale in Kortonjo was listed for an average of €574,235 (€5,198 per m²). That is 10% above the Dutch national average.
Residents give Kortonjo a 7.7 out of 10 based on 5 reviews. Nature and greenery stands out with a 9.0; education lags behind with a 6.0.
A considerable share of the supply in Kortonjo is less efficient: 26% has an E, F or G label. The average natural gas consumption per household is 1,010 m³ per year.
From Kortonjo you can on average reach a supermarket at 0.6 km, a GP at 0.8 km, a railway station at 3.6 km, a primary school at 0.5 km (as the crow flies, source: CBS).
Right now you will find 56 homes for sale and 7 homes for rent in Kortonjo.