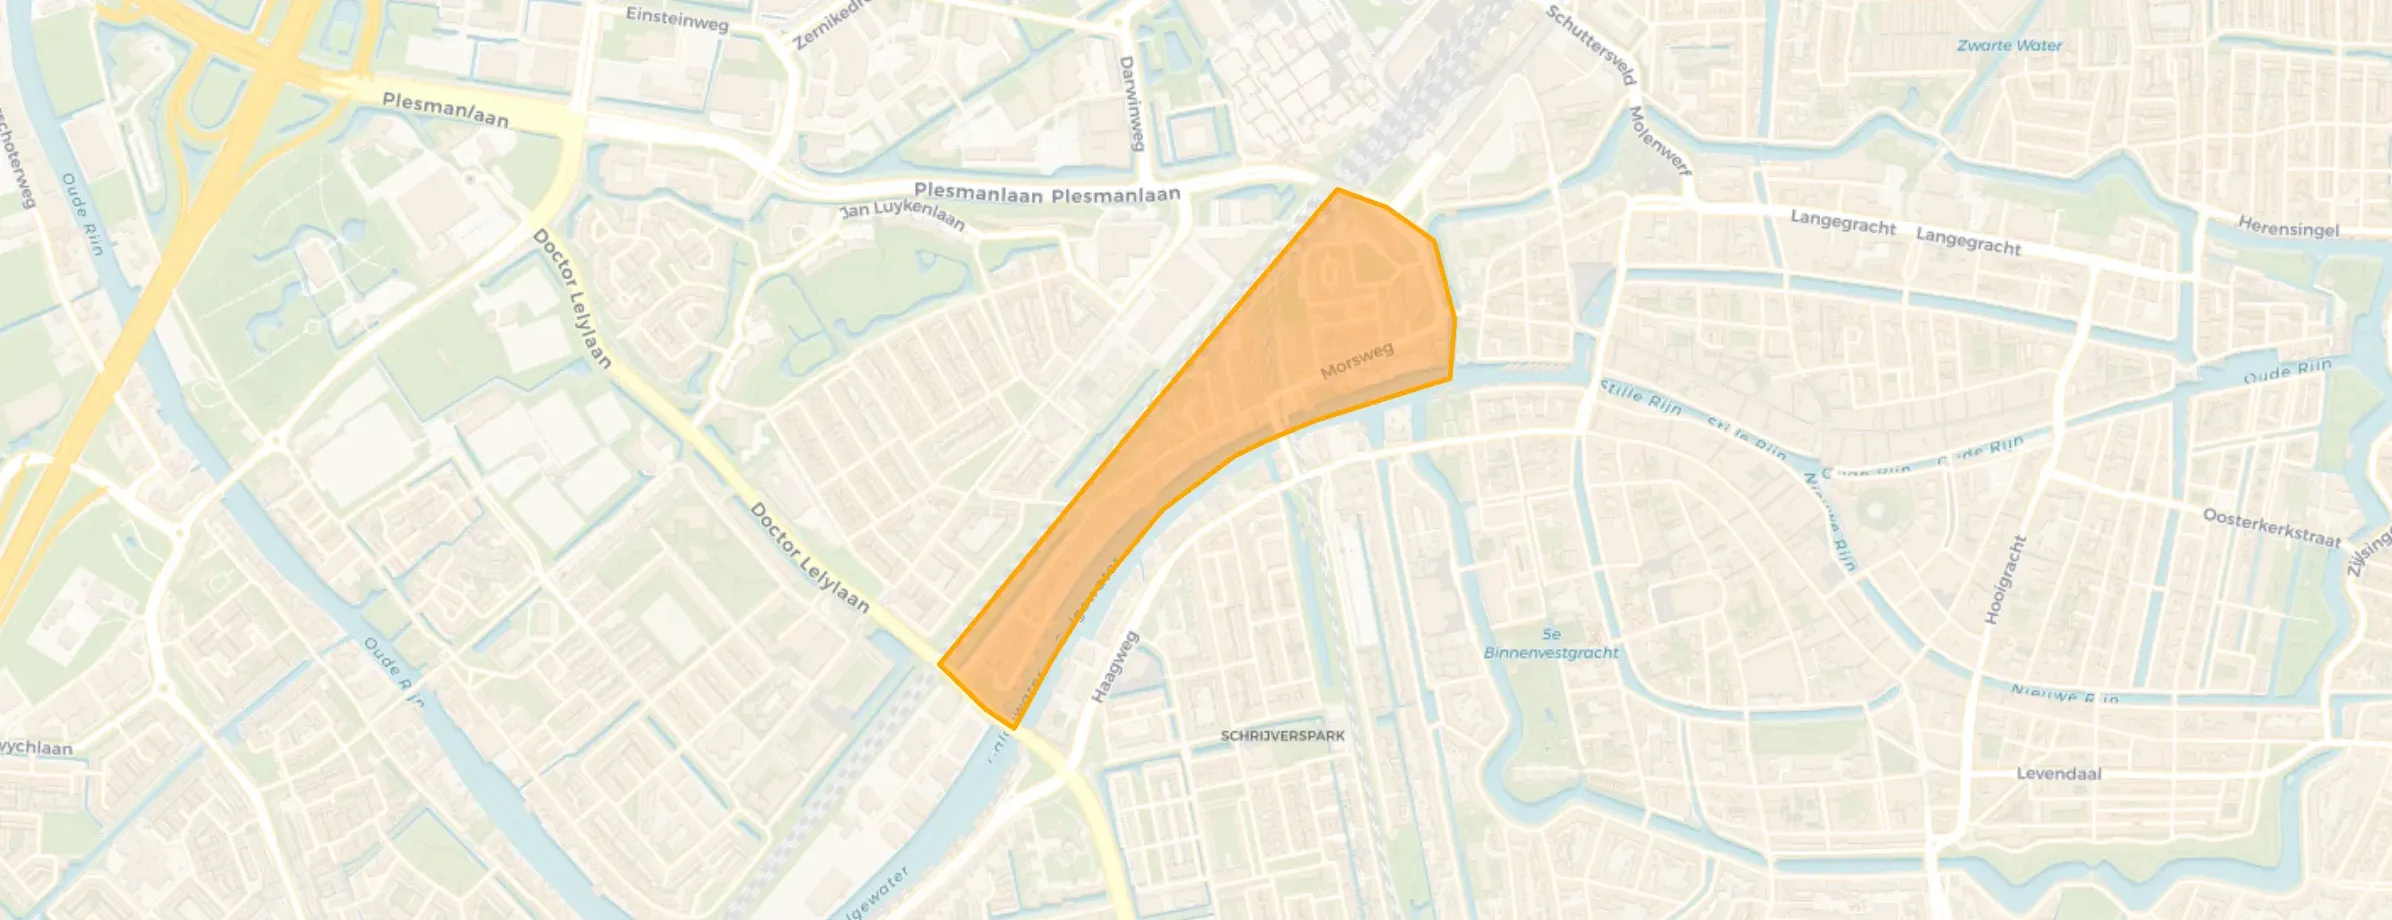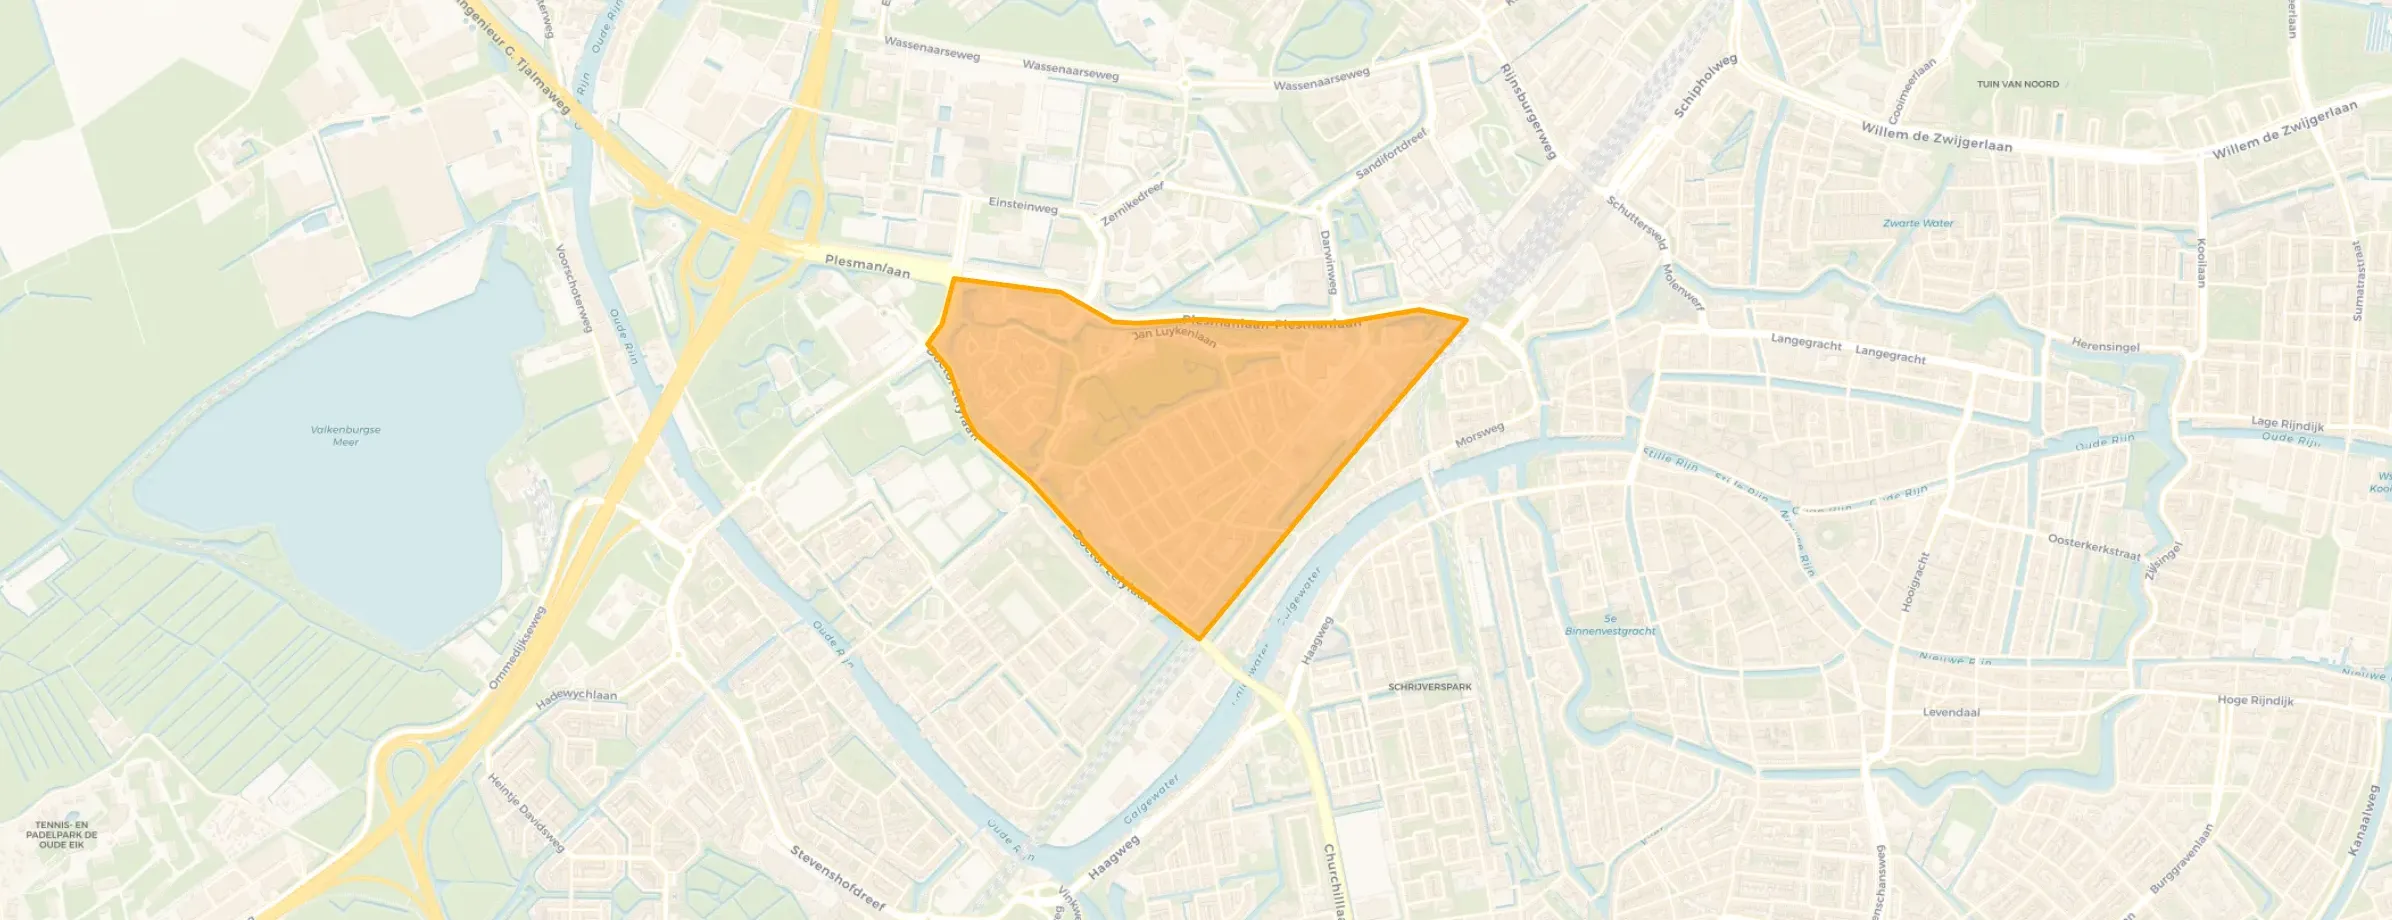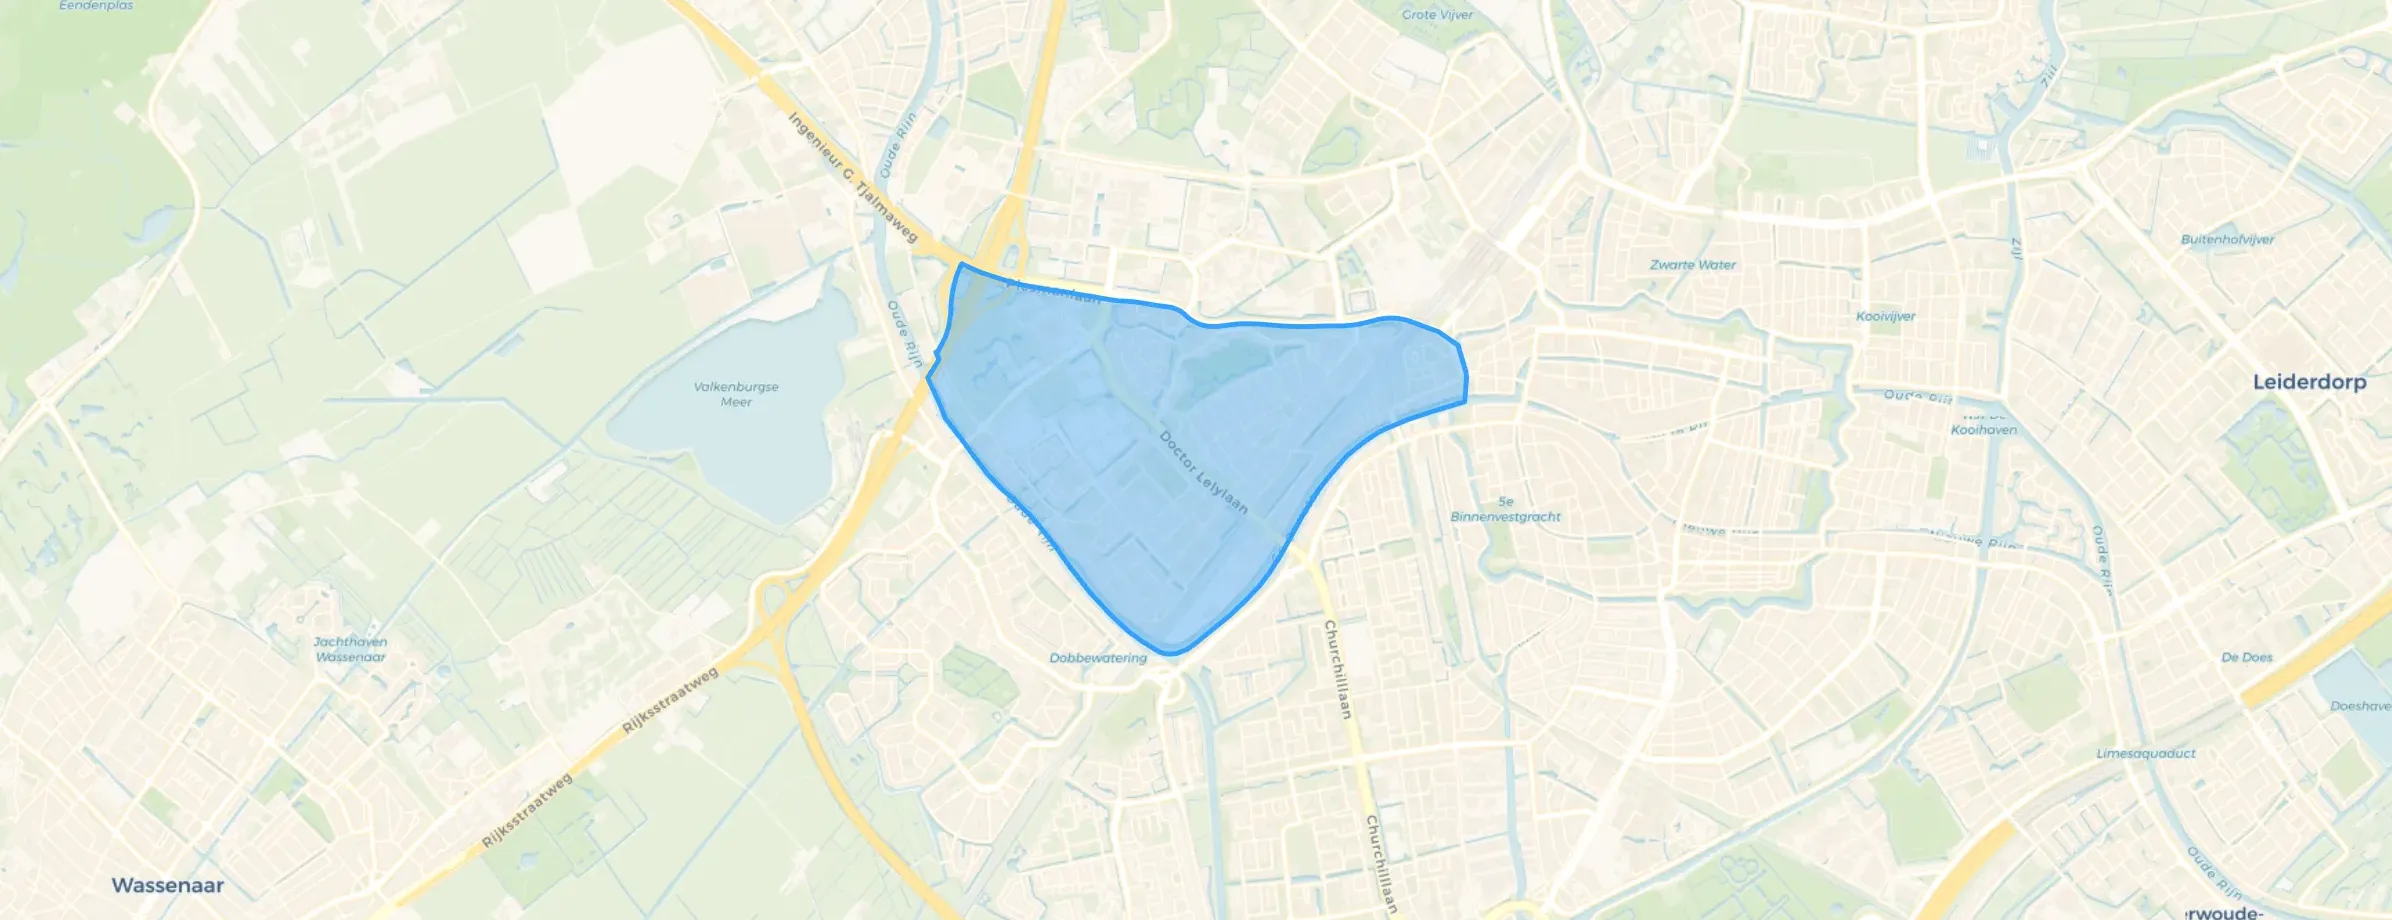
District in Leiden
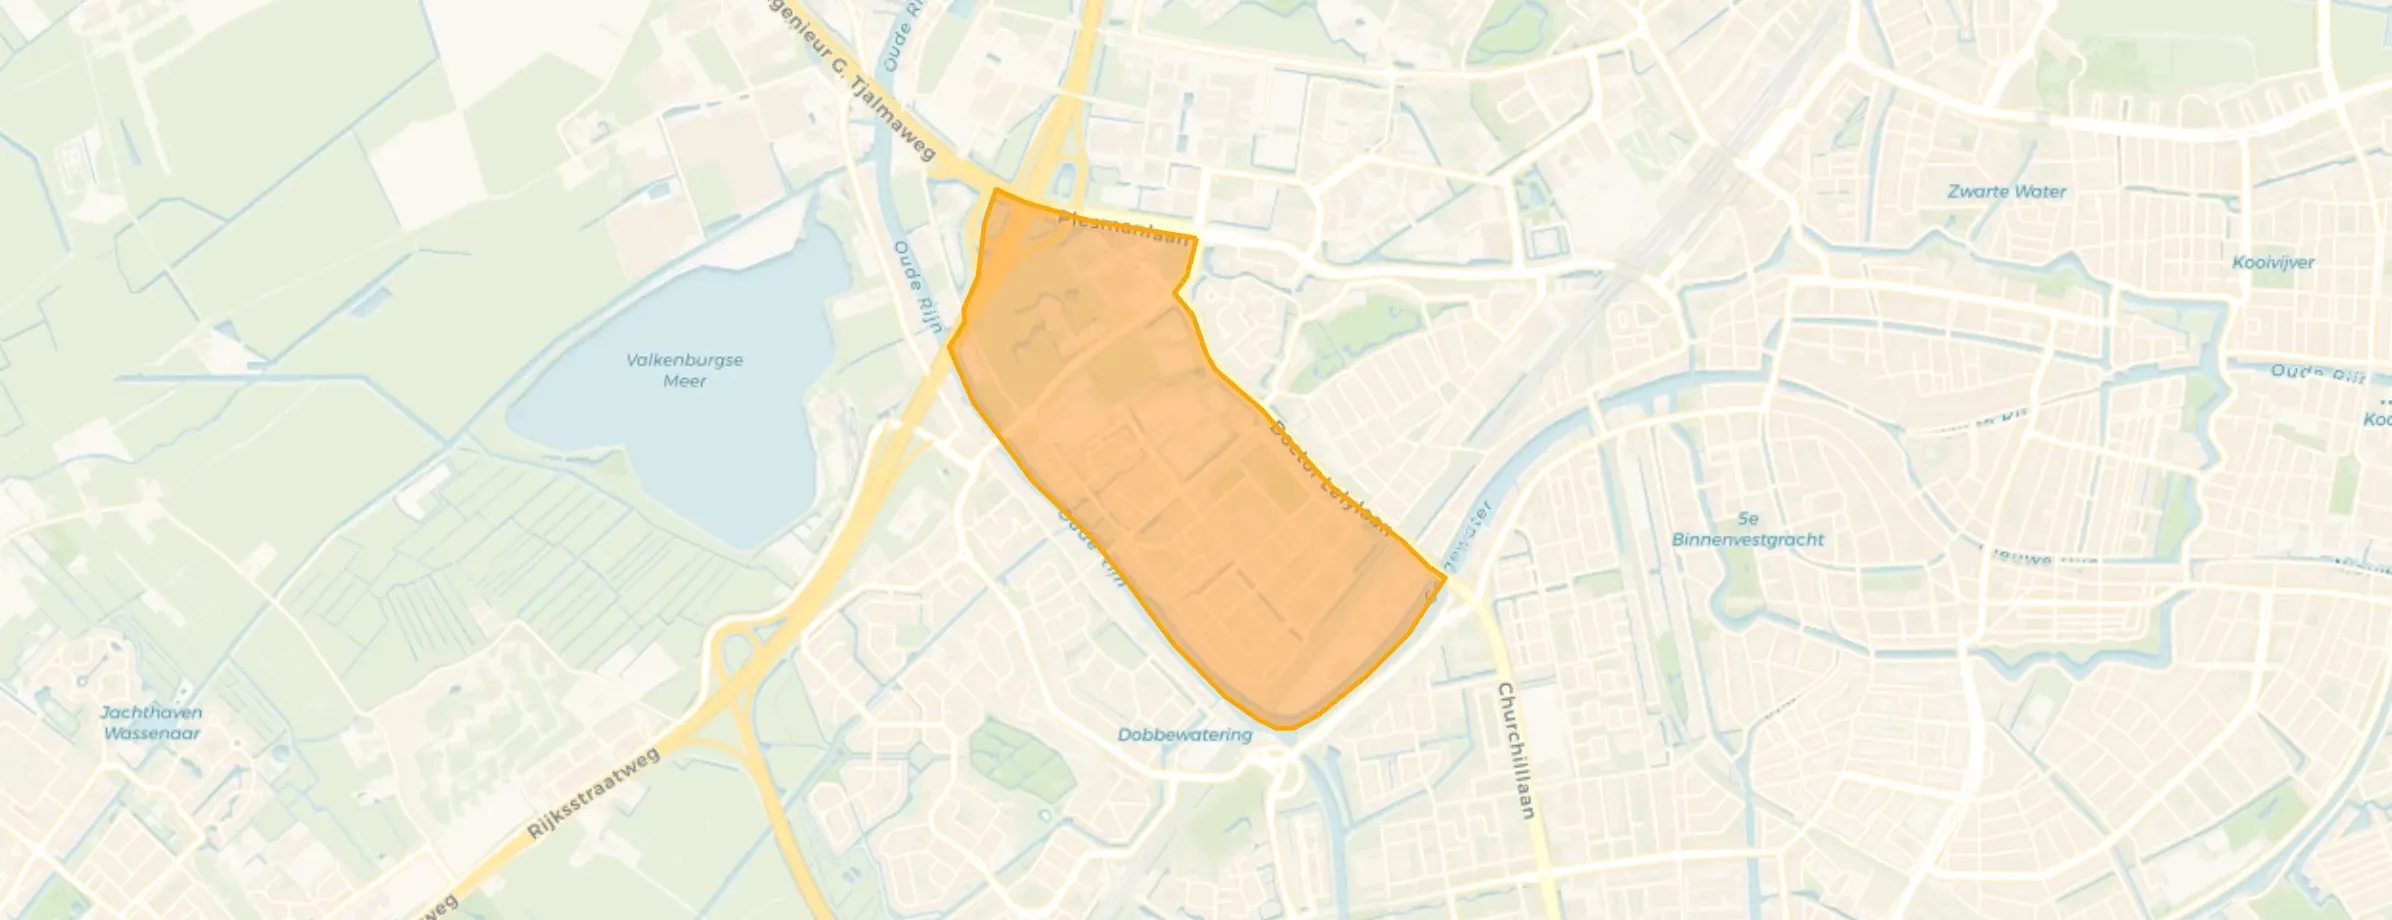
Morsdistrict is located in the province of Zuid-Holland, in the municipality of Leiden The district has a total area of 205 hectares, of which 196 hectares are land and 9 hectares are water. The district is coded as WK054606. The postcode area is 2312AA-2332ZZ.
Morsdistrict has 11.630 residents. Of these, 48,7% are men and 51,3% are women. Most residents are 25 to 45 years (31,9%). The other age groups are 22,5% for '45 to 65 years', 19,9% for '65 years or older', 14,0% for '15 to 25 years' and 11,7% for '0 to 15 years'. Of the residents, 58,7% is unmarried, 28,8% is married, 7,4% is divorced and 5,0% is widowed. 7.000 residents originate from the Netherlands, 1.495 come from Europe and 3.130 come from countries outside Europe.
There are 6.490 households in Morsdistrict. 54,5% of these are single-person households, 24,7% households without children and 20,7% households with children. The average household size is 1,8 persons. The national average is 2,1 persons.
In Morsdistrict there are 9.500 income recipients. The average income per income recipient is €40.300, which is €1.900 (5%) lower than the national average of €42.200. Per resident, the average income is €34.300, which is €600 (2%) lower than the national average of €34.900. Most residents of Morsdistrict are highly educated. 42,9% have a university or higher professional education (HBO/WO), 32,1% have an intermediate education (HAVO, VWO or MBO 2-4) and 25,0% have a lower education (VMBO or MBO 1).
Of the 11.630 residents, around 68% are in paid employment, which amounts to 7.908 people. This is 4% lower than the national average of 72%. The majority of workers are in salaried employment (87%), while 13% are self-employed. In Morsdistrict, 26% of residents receive a benefit. The largest group is those receiving a state pension (AOW). 2.110 people receive this benefit.
In Morsdistrict there are 5.821 homes with an average assessed value (WOZ) of €376.000. Of these, around 96% are occupied and 4% unoccupied. Most homes are rental properties. This amounts to 62% rental homes and 38% owner-occupied homes. Of the homes, 38% privately owned, 37% owned by housing associations and 25% owned by other landlords. The most common construction periods in Morsdistrict are 1970-1980 (24%) and 1980-1990 (22%).
There are currently no homes for sale in Morsdistrict. The most recently listed home is Lopsenstraat 18A by Kompas makelaars & taxateurs. No homes were sold in Morsdistrict over the past year.
There are currently no homes for rent in Morsdistrict. The most recent home is Verbeekstraat 1C14, offered by HOLLAND WEST MAKELAARDIJ op Funda. No homes were let in Morsdistrict over the past year.
No recent rental data available for Morsdistrict.
In Morsdistrict there are 4.495 addresses with a registered energy label. The most common labels are C (25%), A (24%) and B (14%). On average, an address in Morsdistrict uses 1.940 kWh of electricity per year. This is 24% below the national average of 2.550 kWh. With an annual consumption of 480 m³ per address, natural gas consumption is 40% below the national average of 800 m³.
Cosy flat with many elderly residents. A nice dog walking area that I look out onto. Also a beautiful park. However, too few shops, so little choice unfortunately. Only the park is not lit and there are regularly homeless people who also sleep in the bushes! The park is well maintained though. In short, I am very satisfied with the neighbourhood.
Auto-translated to English by AIGood experiences, nice people, plenty of space, a beautiful dog walking area and a nice park with play space for children!
Auto-translated to English by AIThe neighbourhood is quite simple along a road, and there are often students outside in the evenings. It is reasonably safe as long as all doors remain closed.
Auto-translated to English by AIIt is a safe neighbourhood with nice people, I have never had any bad experiences, but sometimes bikes are stolen, but no major burglaries, there is a supermarket, station, GP and school all within walking distance, sometimes it is a bit dirty
Auto-translated to English by AIIt used to be a very pleasant neighbourhood. Nowadays, nobody considers others anymore. The maintenance by the municipality and of private gardens is also very poor.
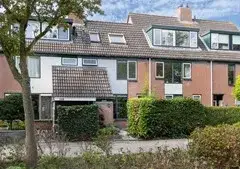
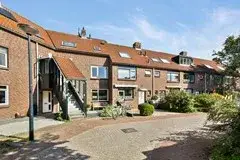
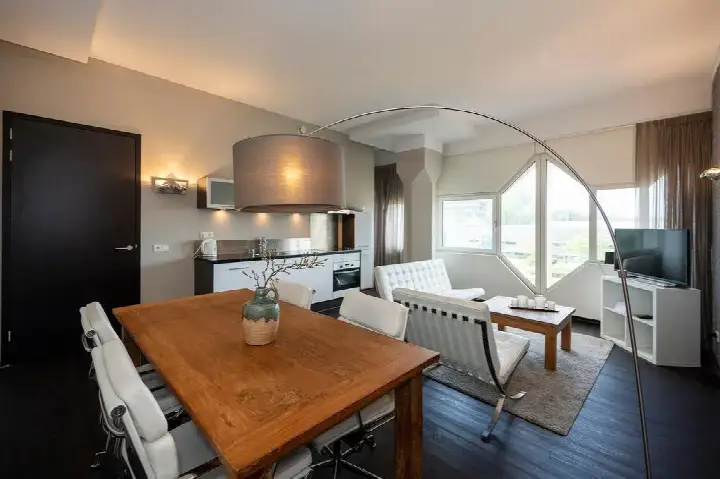
Auto-translated to English by AIThe housing stock is mainly post-war — 50% was built between 1945 and 1990. In addition, the most common type is flats (68%).
Over the past year a home for sale in Morsdistrict was listed for an average of €452,002 (€5,394 per m²). Last quarter prices rose by 32%.
A rental home in Morsdistrict cost an average of €1,788 per month (€24 per m²).
Residents give Morsdistrict a 7.4 out of 10 based on 5 reviews. Community stands out with a 7.8; cleanliness lags behind with a 6.4.
Wijk Morsdistrict has 11,630 residents. The largest age group is 25 to 45 years (32%). Notably, 55% of the households are single-person households.
From Morsdistrict you can on average reach a supermarket at 0.7 km, a GP at 0.6 km, a railway station at 1.6 km, a primary school at 0.7 km (as the crow flies, source: CBS).
Right now you will find 31 homes for sale and 19 homes for rent in Morsdistrict.